A Glance at the Participation of Adult Workers in Formal, Job-related Training Activities or Education in 2008

Archived Content
Information identified as archived is provided for reference, research or recordkeeping purposes. It is not subject to the Government of Canada Web Standards and has not been altered or updated since it was archived. Please "contact us" to request a format other than those available.
Louise Desjardins
Tourism and the Centre for Education Statistics Division
Statistics Canada
Age, sex and level of education of adult learners
Participation in training or education and characteristics of main job
Employer support for training activities
Training objectives
Unmet training needs or wants
Conclusion
The positive impact that human capital has on employment, employment earnings and a nation's economic growth has been discussed in a number of studies.1 Human capital is generally defined as the set of skills, abilities, credentials, experience and knowledge that determine an individual's capacity to work and produce for himself/herself or others. One of the key components of human capital is the acquisition of knowledge and credentials throughout the individual's lifetime, particularly during adulthood.
According to the 2008 Access and Support to Education and Training Survey (ASETS), nearly 8 million adults between the ages of 25 and 64 (7,750,000) took part in formal training activities or education between July 2007 and June 2008, and most of them (85%) did so for career- or job-related reasons. This article examines the participation of adult workers in formal, job-related training activities or education. The participation rates of adult workers are analyzed in relation to their demographic characteristics, occupation, employer characteristics, training objectives and learning obstacles.
Age, sex and level of education of adult learners
Between July 2007 and June 2008, just over four out of 10 adult workers (41.2%) participated in formal career- or job-related training activities or education. One-fifth of those who participated (20.6%) undertook studies leading to a formal credential such as a degree, diploma or certificate (that is, a program of study), and 86.8% took courses, workshops or seminars that did not lead to a formal credential (that is, training activities).2
Overall, female workers had a slightly higher rate of participation in job-related training activities or education than male workers (43.4% compared to 39.2%). Female participation was higher in every age group, with the largest difference—more than eight percentage points—in the 45-to-54 age group (Chart 1).
The differences in participation rates between the sexes may be related to the fact that proportionally fewer women than men were self-employed, as paid employees were more likely to take part in job-related training activities than self-employed workers (43.6% and 30.0%, respectively). Roughly one in seven female workers was self-employed (14.0%), compared with more than one-fifth of male workers (21.2%). In the 45-to-54 age group in particular, the self-employed proportion was nearly one quarter for men (24.5%) compared to 14.3% for women, a difference of 10 percentage points.
Participation in job-related training or education was closely associated with age. Workers under the age of 35 had the highest participation rate (45.4%), while workers approaching retirement (in the ages 55 to 64) had the lowest rate (29.2%). It is worth noting, however, that the median age of participants in job-related training activities or education was relatively high—age 41 for men and age 42 for women—a reflection of the aging of the Canadian labour force.
Chart 1
Participation of adult workers1 in job or career related training activities by sex and age group
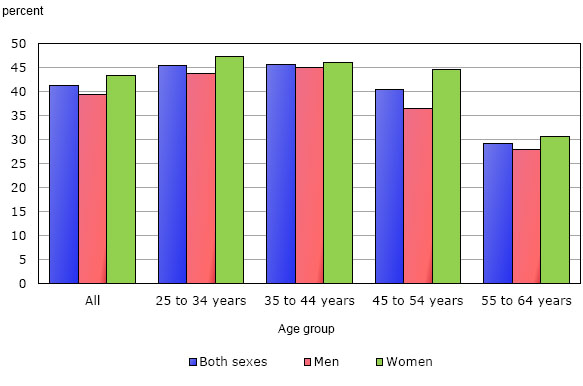
1 Individuals aged 25 to 64 who had a job during the survey's reference period.
Source: Statistics Canada, Access and Support to Education and Training Survey (ASETS), 2008.
Also associated with participation in job-related training activities or education was level of education. Less than one fifth of workers who had not completed high school (18%) took part in training activities or education, compared with nearly six out of 10 workers with a university degree (56.3%), a difference of more than 37 percentage points.
Female workers with a university degree had a higher participation rate than their male counterparts (59.5% compared to 53.0%). However, among workers with less than a high school education, men had a participation rate 10 percentage points higher than women (22.1% compared to 12.9%).
Participation in training or education and characteristics of main job
The differences related to level of education and gender are attributable in part to the nature of the work performed, as some occupations generally require a higher level of education or employ a substantial proportion of women.
For example, the highest participation rates in job-related training activities or education were observed in health occupations (62.3%), social science, education and government service occupations (60.7%), natural and applied sciences occupations (51.4%) and management occupations (50.6%).
In contrast, significantly below-average rates of participation were seen in occupations unique to primary industry (33.1%), sales and service occupations (29.8%), trade, transport and machinery occupations (29.6%) and occupations unique to processing, manufacturing and utilities (24.6%).
More than eight out of 10 people working in social science, education and government service (91.1%), health (89.8%) and natural and applied sciences (88.8%) had a postsecondary degree or certificate. In contrast, about half of sales and service workers (52.7%), trade, transport and machinery workers (51.1%) and processing, manufacturing and utilities workers (47.0%) and about four out of 10 primary industry workers (41.6%) had a postsecondary education (Table 1).
Within each occupation group, female and male workers had comparable rates of participation in job-related training activities or education.
While comparable proportions of female and male workers were unionized or covered by a union (37.7% and 34.4%, respectively), unionized women had a higher rate of participation in job-related training activities or education than unionized men (54.2% compared with 42.3%), and their rate exceeded the average rate for unionized workers (48.5%) by almost six percentage points. That may be attributable to the overrepresentation of women in health occupations (81.8%) and social science, education and government service occupations (68.1%), both of which are heavily unionized (54.6% and 55.4%, respectively) and have high rates of participation in job-related training activities or education (Table 1).
| Occupation | Participation rate in training | Women | Postsecondary education | Unionisation rate |
|---|---|---|---|---|
| percent | ||||
| All | 41.2 | 47.2 | 66.5 | 29.3 |
| Management | 50.6 | 35.7 | 70.9 | 8.0 |
| Business, finance and administration | 38.9 | 70.2 | 64.0 | 24.4 |
| Natural and applied sciences and related occupations | 51.4 | 21.5 | 88.8 | 25.1 |
| Health occupations | 62.3 | 81.8 | 89.8 | 54.6 |
| Social sciences, education, government service and religion | 60.7 | 68.1 | 91.1 | 55.4 |
| Art, Culture, Recreation and Sport | 39.4 | 55.3 | 79.4 | 18.6 |
| Sales and service occupations | 29.8 | 56.5 | 52.7 | 22.5 |
| Trade, transport and machinery | 29.6 | 6.8 | 51.1 | 33.7 |
| Occupations unique to Primary Industry | 33.1 | 17.2 | 41.6 | 14.2 |
| Occupations Unique to Processing, Manufacturing and Utilities | 24.6 | 27.2 | 47.0 | 39.2 |
| Source: Statistics Canada. 2009 Access and Support to Education and Training Survey (ASETS), 2008. | ||||
The larger the employer, the higher the rate of employee participation in training activities or education. This is likely because larger employers tend to have more resources to support or provide such training. More than half of the employees of employers with more than 500 employees (55.4%) took part in job-related training activities or education. That was 12 percentage points higher than the rate for employers with between 20 and 500 employees (43.9%) and 18 points higher than the rate for employers with fewer than 20 employees (36.9%).
Employer support for training activities
The Access and Support to Education and Training Survey asked workers who had taken either a program of study or non-program courses, workshops and seminars whether their employer had provided any support.
Employers supported worker education or training in various ways. They may have provided the training themselves, given the participants education leave, allowed them to work flexible hours, supplied transportation or paid or reimbursed tuition, registration or parking fees.
The results show that nearly seven out of 10 participants in education program who worked in establishments with more than 500 employees received support from their employer (69%), compared to 39.4% of participants who worked in establishments with fewer than 20 employees and 49.5% for all employers combined.3 For training activities such as job-related courses, workshops and seminars, the proportion sponsored by small establishments (fewer than 20 employees) was appreciably lower (84.0%) than the proportion sponsored by large establishments (93.9%).
The proportions of workers who received support from their employer were similar for women and men and for all age groups. On the other hand, some occupations had particularly high proportions of participants in employer-supported education programs. For example, seven out of 10 participants in education program who worked in management occupations (70.1%) received support from their employer; similarly, 95.4% of participants in courses, workshops and seminars in those occupations were sponsored by the employer, compared to 90% for all occupations combined.
Chart 2
Proportion of workers aged 25 to 64 who received employer support among those who took education programs
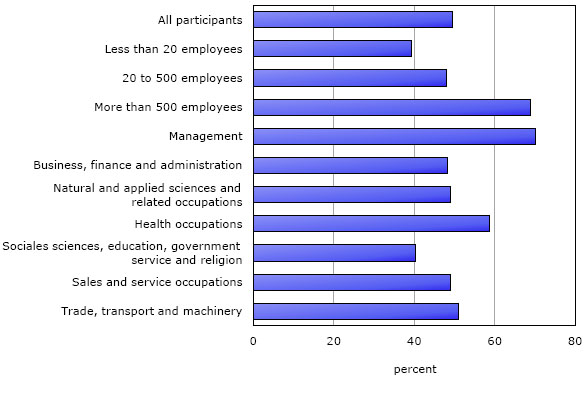
Note: Excludes self-employed workers.
Source: Statistics Canada, Access and Support to Education and Training Survey (ASETS), 2008.
Although worker participation in training activities was low (29.6%) in trade, transport and machinery occupations, a very high percentage of courses, workshops and seminars (94.8%) were sponsored by employers.
Training objectives
Whether or not they were supported by their employer, the majority (64.5%) of adult workers who took part in job- or career-related training activities or education did so to improve their job performance or their knowledge. This objective was more common among older workers, being reported by 73.9% of 55 to 64 year-olds and 70.5% of 45 to 54 year-olds. Younger workers aged 25 to 34 year-olds were much less likely to report this objective, at 54.5%.
In contrast, the second most common objective—to change careers or obtain a promotion—was mentioned more often by younger workers, at 20.7% and 16.2% of 25 to 34 year-olds and 35 to 44 year-olds, respectively. This objective was reported by fewer than one in ten 45 to 54 year-olds.
Just over one in 10 workers (11.8%) participated in training activities or education to meet a specific job requirement. There was little difference between males and females and across age groups in this respect, with the percentages ranging between 9.9% and 13.9%.
Last, 9% of workers in the 25-to-34 age group participated in education or training activities to prepare for their career or to find a job. This was the only age group in which a significant proportion of respondents reported this objective.
Overall, a majority of workers appear to have achieved their training objectives. About two-thirds (66.2%) reported that the training had helped them improve their work performance or their knowledge. For one person in six (16.6%), however, the training was of no value in achieving their objectives (Table 2). The proportions were similar for both sexes and for all age groups.
| All | 25 to 34 years old | 35 to 44 years old | 45 to 54 years old | 55 to 64 years old | |
|---|---|---|---|---|---|
| percent | |||||
| Training objectives | |||||
| Meet requirements | 11.8 | 9.9 | 10.8 | 13.9 | 13.7 |
| Perform better at job or increase knowledge | 64.5 | 54.5 | 64.9 | 70.5 | 73.9 |
| Prepare for first career or find a job | 4.2 | 9.0 | 3.0E | 1.8E | F |
| Change careers or get a promotion | 14.2 | 20.7 | 16.2 | 9.1 | 4.8E |
| Training outcomes | |||||
| Meet requirements | 1.1E | 1.4E | 1.1E | F | F |
| Perform better at job or increase knowledge | 66.2 | 55.7 | 67.0 | 74.6 | 71.7 |
| Prepare for first career or find a job | 3.7 | 7.3 | 2.7E | 1.8E | F |
| Change careers or get a promotion | 6.6 | 9.7 | 8.6 | 3.1 | 2.2E |
| Did not help | 16.6 | 20.6 | 14.6 | 14.6 | 16.2 |
|
E
use with caution F too unreliable to be published Note: Individuals aged 25 to 64 who had a job during the survey's reference period. Source: Statistics Canada. 2009 Access and Support to Education and Training Survey (ASETS), 2008. |
|||||
Unmet training needs or wants
Although the proportions of part-time employees and self-employed workers who participated in job-related training activities or education (32.4% and 30.0%, respectively) were significantly lower than the overall participation rate (41.2%), those groups were no more likely than other workers to report unmet training needs or wants.
Approximately three out of 10 workers (30.5%) reported that they did not get the training activities or education they wanted or needed. There were no statistically significant differences between men and women, between full-time and part-time workers, or between paid and self-employed workers.
However, significant differences between the sexes were observed with regard to the main obstacles encountered by workers. First, men were more likely than women to report that the training conflicted with their work schedule (49.8% and 40.7%, respectively). Second, two out of five female workers (39.5%) were unable to participate in the training they wanted or needed because of family responsibilities, compared with only about a quarter of male workers (26.6%). Third, the cost of the training was an obstacle for a higher proportion of women than men (42.8% and 31.3%, respectively) (Chart 3).
Chart 3
Barriers to training by sex
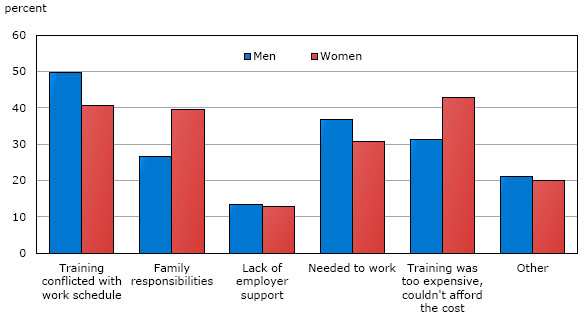
Note: Percentages do not sum up to 100 since multiple responses were permitted.
Source: Statistics Canada, Access and Support to Education and Training Survey (ASETS), 2008.
Conclusion
This article has shown that participation in job-related training activities or education is not evenly distributed across Canadian workers aged 25 to 64. Women, young people and more highly-educated workers were more likely to take part in structured training.
In addition, some characteristics of the workers' main jobs are closely associated with participation in training. For example, workers in health occupations and social science, education and government services occupations had higher participation rates than the overall rate. Those occupations generally require a high level of education and have a relatively high unionization rate.
The training participation rate was appreciably higher in large establishments than in smaller ones.
The majority of participants took the training to improve their job performance or their knowledge, an objective that was achieved in most cases.
The development of occupational skills also involves some self-directed training activities. Such activities may include using the Internet or new software applications, reading manuals, asking a mentor for advice, or receiving on-the-job training. In some workplaces, in some occupations, or in the case of some workers, such as self-employed workers, self-directed training may be the preferred method of acquiring knowledge or new skills. However, the lack of information on self-directed training activities prevents us from characterizing those activities or assessing how much they may have helped meet workers' training needs.
Notes
-
Examples include The Well-being of Nations: The Role of Human and Social Capital. Paris: OECD, 2001; Côté, Sylvain. 2001. "The contribution of human and social capital". ISUMA: Canadian Journal of Policy Research, Vol. 2, No. 1, pp. 25-33; and Coulombe, Serge, Jean-François Tremblay and Sylvie Marchand, 2004. "Literacy scores, human capital and growth across fourteen OECD countries", Statistics Canada Catalogue No. 89-552MIE2004011.
-
The percentages do not add up to 100 because some participants may have taken both a program of study and training activities.
- Date modified: