
Overweight and obese adults (self-reported), 2013

Archived Content
Information identified as archived is provided for reference, research or recordkeeping purposes. It is not subject to the Government of Canada Web Standards and has not been altered or updated since it was archived. Please "contact us" to request a format other than those available.

Obesity has been linked with many chronic diseases, including hypertension, type 2 diabetes, cardiovascular disease, osteoarthritis and certain types of cancer.Note 1
To assess the health risks of obesity, the World Health Organization and Health Canada use guidelines based on Body Mass IndexNote 2 (BMI), a measure that examines weight in relation to height. BMI is defined as weight in kilograms divided by the square of the height in metres (Table 1). BMI is calculated for the population aged 18 and older, excluding pregnant women, and persons less than 3 feet (0.914 metres) tall or greater than 6 feet 11 inches (2.108 metres).
| Height | Underweight* | Normal weight | Overweight* | Obese** |
|---|---|---|---|---|
| 5’4” | less than 107.5 lb | 107.6 to 145.2 lb | 145.3 to 174.3 lb | 174.4 lbs or more |
| 5’8” | less than 121.3 lb | 121.4 to 164.0 lb | 164.1 to 196.8 lb | 196.9 lbs or more |
| 6’0” | less than 136.0 lb | 136.1 to 183.8 lb | 183.9 to 220.6 lb | 220.7 lbs or more |
| 1.63 m | less than 48.8 kg | 48.9 to 66.0 kg | 66.1 to 79.2 kg | 79.3 kg or more |
| 1.73 m | less than 55.1 kg | 55.2 to 74.5 kg | 74.6 to 89.4 kg | 89.5 kg or more |
| 1.83 m | less than 61.8 kg | 61.9 to 83.5 kg | 83.6 to 100.2 kg | 100.3 kg or more |
|
||||
In 2013, 18.8% of Canadians aged 18 and older, roughly 4.9 million adults, reported height and weight that classified them as obese. The rate of obesity among men increased to 20.1% in 2013 from 18.7% in 2012, but was the same as the rate between 2009 and 2011. Among women, the rate of obesity in 2013 (17.4%) was about the same as in 2012 (Chart 1).
The rate of adults who reported height and weight that classified them as overweight in 2013 was 41.9% for men and 27.7% for women. The percentage of men who were overweight was about the same as 2012, but is an increase from 40.2% in 2011. The rate among women has been stable since 2003 (Chart 1).

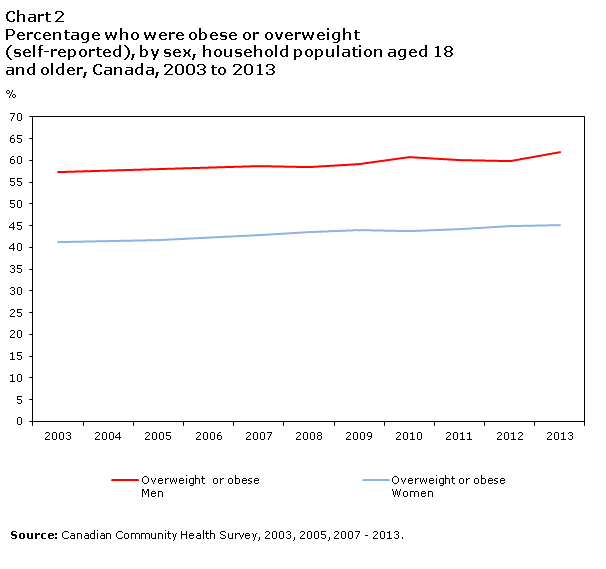
When those who were classified as obese were combined with those who were overweight, 62.0% (8.1 million) of men and 45.1% (5.8 million) of women had an increased health risk because of excess weight. The combined rate of overweight and obese women has remained stable since 2009. For men the rate in 2013 was a significant increase from 2012 (Chart 2).
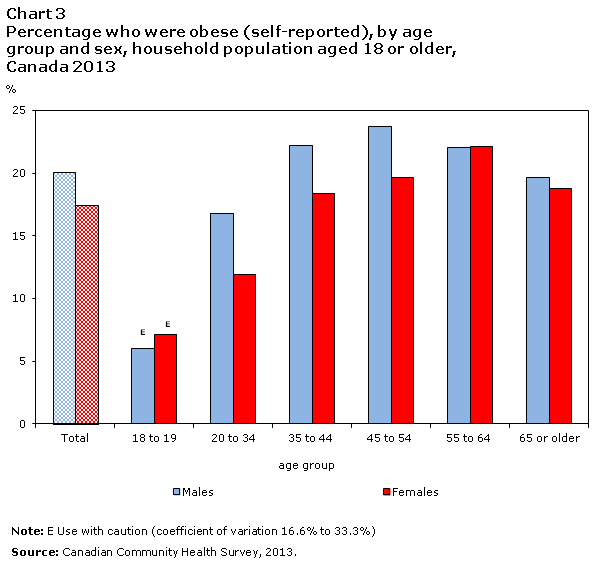
Between the ages of 20 and 54, significantly more men than women were obese. All other age groups were about the same for men and women. Among both sexes, those aged 18 to 19 had the lowest obesity rate (Chart 3).
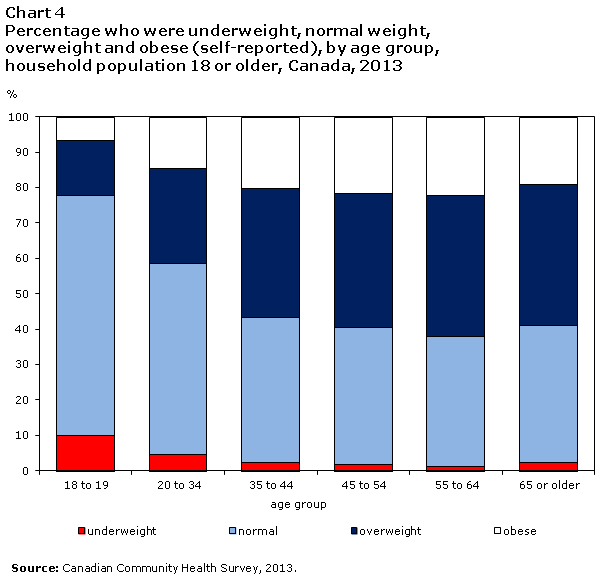
In 2013, the percentage of Canadians who were overweight or obese increased between the ages of 18 and 54, while the percentage of Canadians underweight decreased between the ages of 18 and 44 (Chart 4). People whose height and weight classifies them as underweight are also considered to have increased health risks.
The proportion of residents who were obese was lower than the national average (18.8%) in:
- Ontario (17.9%)
- British Columbia (15.0%)
The proportion of residents who were obese was higher than the national average in:
- Newfoundland and Labrador (29.4%)
- Prince Edward Island (26.7%)
- Nova Scotia (26.3%)
- New Brunswick (25.9%)
- Manitoba (23.8%)
- Saskatchewan (25.0%)
- Northwest Territories (24.5%)
- Nunavut (29.4%)
Residents of Quebec, Alberta, and Yukon reported rates of obesity that were about the same as the national average.
End notes
The results shown here are based on height and weight as reported by Canadians. Comparisons of self-reported height and weight with actual measurements have shown that women are more likely to underestimate their weight, while men tend to overestimate their height. Moreover, under-reporting of weight increases proportionately with actual weight. In other words, the more overweight a person is, the more likely they are to under-report their weight (see “Estimates of obesity based on self-report versus direct measures” in Health Reports).
References
Connor Gorber, Sarah, Margot Shields, Mark S.Tremblay and Ian McDowell. 2008. “The feasibility of establishing correction factors to adjust self–reported estimates of obesity.” Health Reports. Vol. 19, no. 3. September. Statistics Canada Catalogue no. 82-003. http://www.statcan.gc.ca/bsolc/olc-cel/olc-cel?lang=eng&catno=82-003-X200800310680 (accessed May 10, 2010).
Garriguet, Didier. 2008. “Obesity and the eating habits of the Aboriginal population.” Health Reports. Vol. 19, no. 1. March. Statistics Canada Catalogue no. 82-003. http://www.statcan.gc.ca/bsolc/olc-cel/olc-cel?lang=eng&catno=82-003-X200800110487 (accessed May 10, 2010).
Le Petit, Christel and Jean–Marie Berthelot. 2006. “Obesity—a growing issue.” Health Reports. Vol. 17, no. 3. June. Statistics Canada Catalogue no. 82-003. p. 43–50. http://www.statcan.gc.ca/studies-etudes/82-003/archive/2006/9278-eng.pdf (accessed May 10, 2010).
Orpana, Heather M., Mark S.Tremblay and Philippe Finès. 2007. “Trends in weight change among Canadian adults.” Health Reports. Vol. 18, no. 2. May. Statistics Canada Catalogue no. 82-003. http://www.statcan.gc.ca/bsolc/olc-cel/olc-cel?lang=eng&catno=82-003-X20060059633 (accessed May 10, 2010).
Shields, Margot, Sarah Connor Gorber and Mark S Tremblay. 2008. “Estimates of obesity based on self–report versus direct measures.” Health Reports. Vol. 19, no. 2. June. Statistics Canada Catalogue no. 82-003. http://www.statcan.gc.ca/bsolc/olc-cel/olc-cel?lang=eng&catno=82-003-X200800210569 (accessed May 10, 2010).
Shields, Margot, Sarah Connor Gorber and Mark S. Tremblay. 2008. “Effects of measurement on obesity and morbidity.” Health Reports. Vol. 19, no. 2. June. Statistics Canada Catalogue no. 82-003. http://www.statcan.gc.ca/pub/82-003-x/2008002/article/10564-eng.pdf (accessed May 10, 2010).
Shields, Margot and Mark S. Tremblay. 2008. “Screen time among Canadian adults: A profile.” Health Reports. Vol. 19, no. 2. June. Statistics Canada Catalogue no. 82-003. http://www.statcan.gc.ca/bsolc/olc-cel/olc-cel?lang=eng&catno=82-003-X200800210600 (accessed May 10, 2010).
Shields, Margot and Mark S. Tremblay. 2008. “Sedentary behaviour and obesity among Canadian adults.” Health Reports. Vol. 19, no. 2. June. Statistics Canada Catalogue no. 82-003. http://www.statcan.gc.ca/bsolc/olc-cel/olc-cel?lang=eng&catno=82-003-X200800210599 (accessed May 10, 2010).
Shields, Margot. 2006. “Overweight and obesity among children and youth.” Health Reports. Vol. 17, no. 3. August. Statistics Canada Catalogue no. 82-003. p. 27–42. http://www.statcan.gc.ca/studies-etudes/82-003/archive/2006/9277-eng.pdf (accessed May 10, 2010).
Shields, Margot and Michael Tjepkema. 2006. “Trends in adult obesity.” Health Reports. Vol. 17, no. 3. August. Statistics Canada Catalogue no. 82-003. p. 53–59. http://www.statcan.gc.ca/studies-etudes/82-003/archive/2006/9279-eng.pdf (accessed May 10, 2010).
Shields, Margot and Michael Tjepkema. 2006. “Regional differences in obesity.” Health Reports. Vol. 17, no. 3. August. Statistics Canada Catalogue no. 82-003. p. 61–67. http://www.statcan.gc.ca/studies-etudes/82-003/archive/2006/9280-eng.pdf (accessed May 10, 2010).
Tjepkema, Michael. 2006. “Adult Obesity.” Health Reports. Vol. 17, no. 3. August. Statistics Canada Catalogue no. 82-003. p. 9–24. http://www.statcan.gc.ca/studies-etudes/82-003/archive/2006/9276-eng.pdf (accessed May 10, 2010).
Tremblay, Mark S., Claudio E. Pérez, Chris I. Ardern, Shirley N. Bryan and Peter T. Katzmarzyk. 2005. “Obesity, overweight and ethnicity.” Health Reports. Vol. 16, no. 4. June. Statistics Canada Catalogue no. 82-003. p. 23–34. http://www.statcan.gc.ca/studies-etudes/82-003/archive/2005/8041-eng.pdf (accessed May 10, 2010).
Wilkins, Kathryn and Margaret de Groh. 2005. “Body mass and dependency.” Health Reports. Vol.17, no. 1. November. Statistics Canada Catalogue no. 82-003. p. 27–39. http://www.statcan.gc.ca/studies-etudes/82-003/archive/2005/8708-eng.pdf (accessed May 10, 2010).
Data
Additional data from the Canadian Community Health Survey are available from CANSIM table 105–0501.
- Date modified: