
Economic profiles of offenders in Saskatchewan

Archived Content
Information identified as archived is provided for reference, research or recordkeeping purposes. It is not subject to the Government of Canada Web Standards and has not been altered or updated since it was archived. Please "contact us" to request a format other than those available.
By Jillian Boyce, Sun Te and Shannon Brennan
Highlights
- In 2008—the year prior to contact with Saskatchewan police—adult offenders reported a median annual after-tax income of $13,380. This was about half the median annual after-tax income of the general population of Saskatchewan in 2008 ($26,930).
- Large variations in median annual after-tax income existed within the offending population. Offenders who had five or more re-contacts with police—referred to as chronic offenders—reported a median annual after-tax income that was about one-third the amount of offenders who did not have any re-contacts with police in the two years following their initial contact ($6,740 versus $19,080).
- Offenders often relied on government transfers as a source of income. The Economic Dependency Ratio (EDR) measures how many dollars of government transfers are received for every $100 of employment income. Among those who had a contact with police in Saskatchewan in 2009/2010 and also filed their taxes in 2008, the EDR was 29.35. This was close to double the EDR for the overall Canadian population, as well as the Saskatchewan population in general (15.50 and 15.70, respectively).
- Half of the approximately 21,000 adults who had a contact with Saskatchewan police in 2009/2010 and filed taxes in 2008, qualified as low-income, based on the Low Income Measure. This proportion was even higher when considering the number of re-contacts an individual had, with seven in ten (70%) chronic offenders qualifying as low-income.
- While a contact with police did not appear to impact the annual after-tax income of adult offenders, it did, however, appear to negatively impact their employment income earnings, as well as leave them more dependent on government transfers in both the year of contact, and the subsequent year.
- Material deprivation speaks to socio-economic privilege (or lack thereof) in the areas of housing, education, income and employment. Approximately 4 in 10 (42%) people who came into contact with Saskatchewan police in 2009/2010 were among the most materially deprived, compared to 17% of the Saskatchewan population.
- Among the offending population, chronic offenders were proportionately more likely to be materially marginalized. Overall, twice as many chronic offenders were materially deprived than offenders who did not have any re-contacts with police (57% and 28%, respectively).
- Compared to the Saskatchewan population in general, offenders also appeared to be proportionately more likely to experience residential instability (e.g., the tendency of neighbourhood inhabitants to fluctuate over time). Overall, 43% of individuals who had contact with the justice system in 2009/2010 experienced residential instability, compared with just 23% of the general Saskatchewan population.
Traditional crime statistics in Canada provide an indication of the number of offences that are committed and brought to the attention of police, but provide little in the way of determining the number or volume of offences that are committed by the same person (Brennan and Matarazzo 2016). Recently, however, improvements made to available information have allowed for a better understanding of the nature and extent of repeated contact with, and pathways through, the justice system. As a result, the number of people who come into contact with the justice system can be quantified, as can the frequency with which they come into contact. However, there remains relatively little empirical information on the socio-economic factors which contribute to both initial contact, as well as repeated contact, with the justice system.
The second in a series of articles (for the first article, see Brennan and Matarazzo 2016), this Juristat article will begin to address this data gap by examining the economic factors that differentiate those who only come into contact with the justice system once compared to those who have had repeated contact.
Linking justice data from the Saskatchewan re-contact analytical fileNote and tax information from the T1 Family File (T1FF), this article will first provide an economic and employment profile of adults (aged 18 and older) who had contact with Saskatchewan police between April 2009 and March 2010. The article will also explore the possible impact that a contact with the justice system can have on one’s economic and employment well-being. The second half of this article uses information from a census and geographically based index to explore inequalities in various measures of health and social well-being for those who had a contact with Saskatchewan police between 2009 and 2010.
Start of text box
Text box 1
Definitions and concepts
Contact
A contact with the justice system is defined as an official intervention, which is the date that the accused was charged by police in relation to a reported incident or the date the charge was cleared otherwise.Note For the purpose of this project, the contact with police must have happened between April 2009 and March 2010. While this is considered their first contact within this study, it is possible that the individual had prior contacts before this time period and additional re-contacts after this time period.
Re-contact
A re-contact is defined as a subsequent contact with police (i.e., a new charge/charge cleared otherwise) in the two years following the individual’s first contact with police between April 2009 and March 2010.
Offender
For the purposes of this article, an offender refers to someone who came into contact with police in Saskatchewan in 2009/2010 and was charged by police in relation to a reported incident or the charge was cleared otherwise. The individual did not necessarily proceed to the court system, nor were they necessarily found guilty of the crime.
One-time offender
An individual who had a contact with police in Saskatchewan in 2009/2010 and did not have a subsequent contact in the two years following the date of the initial contact.
Repeat offender
An individual who had a contact with police in Saskatchewan in 2009/2010 and had between one and four subsequent re-contacts with Saskatchewan police in the two years following the date of the initial contact.
Chronic offender
An individual who had a contact with police in Saskatchewan in 2009/2010 and had five or more subsequent re-contacts with Saskatchewan police in the two years following the date of the initial contact.
End of text box
The social, economic and employment profile of adults (aged 18 and older) who had a contact with the Saskatchewan police in 2009/2010 and filed taxes in 2008
In 2009/2010, 37,054 individuals came into contact with police in Saskatchewan.Note Note Of these individuals, 22,180 (60%) filed their taxes in 2008,Note providing insight into the economic situation of these individuals in the year prior to their initial police contact (see Text box 2 for information on offenders who did not file their taxes in 2008).
Since the vast majority (96%) of individuals who filed taxes were adults aged 18 and older, this analysis focuses solely on those 21,322 adults who filed taxes, excluding the youth tax filers (see Text box 3 for information on youth). Among these adults, 38% were one-time offenders, 44% were repeat offenders, and 18% were chronic offenders (see Text box 1 for definitions).
Text box 2
Characteristics of non-tax filers
Differences in offender characteristics were noted among those who filed taxes in 2008 and those who did not. Overall, compared to those who had filed taxes, non-tax filers came into contact with the justice system more frequently, and for more serious offences.
Among offenders aged 18 and over, those who did not file their taxes in 2008 were proportionately more likely than those who did file their taxes to be chronic offenders (27% versus 18%). In addition, when considering the severity of crime, non-filers generally came into contact with police for more serious offences than filers.Note Non-tax filing individuals (25%) were also proportionately more likely than tax filing individuals (17%) to move through the justice system—that is, from policing through to corrections.
Youth who did not file taxes were on average younger than youth who did file taxes (14 years of age versus 16 years of age), pointing to the reality that some youth may not have filed taxes simply because they did not have a source of employment. That said, youth who did not file taxes still shared similarities with their older counterparts. Specifically, youth who did not file taxes were proportionately more likely than youth who did file taxes to be chronic offenders (26% versus 10%). Additionally, youth who did not file taxes were, overall, involved in more serious offences than youth who filed taxes.Note
End of text box
Majority of offenders are not married
Marriage, or a stable relationship, has previously been identified as a factor resulting in a movement away from crime (Wyse et al. 2014). Among the 21,322 adults who had a contact with police in 2009/2010 and filed their taxes in 2008, about one-third (32%) were either married or in a common-law relationship. Consistent with prior research, the proportion of offenders who were married or common-law varied based on the frequency of re-contact. Chronic offenders were proportionately less likely to be married or in a common-law relationship than one-time offenders (27% versus 35%).
The remaining 68% of offenders who were not married or in common-law relationships were considered to be single. These offenders were either: single and living at home with at least one of their parents (i.e., children) (25%), single and living on their own or with someone other than their parents (25%), or lone parents living with their child/children (18%).
Regardless of relationship status, just over four in ten (42%) offenders had a child/dependent living with them. While this did not typically differ based on the number of re-contacts one had with police, a slightly higher proportion of repeat offenders (21%) and chronic offenders (19%) were lone parents compared to one-time offenders (16%).
Annual after-tax income of individuals who had a contact with police slightly more than $10,000
There are many motives for engaging in criminal acts, with financial gain being one of them (Felson and Staff 2017; Gudjonsson and Sigurdsson 2004). Understanding the economic situation of offenders could provide some insight as to whether this may be a factor in engagement in crime. In 2008, the median individual after-tax income of those who had a contact with Saskatchewan police the following year was $13,380.Note Note This is approximately half the median after-tax income of individuals in Saskatchewan in 2008 ($26,930) (Statistics Canada, table 11-10-0050-01).Note
Large variations in annual after-tax income were also noted within the offending population. Specifically, there was a difference in the annual income of individuals depending on the number of re-contacts they had with police. For instance, chronic offenders ($6,740) recorded a median income that was about one-third the amount of one-time offenders ($19,080) (Table 1, Chart 1). A similar trend was also noted for median annual after-tax family income, although the difference was slightly less, with the median annual family income being about half of that for chronic offenders ($16,910) compared with one-time offenders ($36,480).
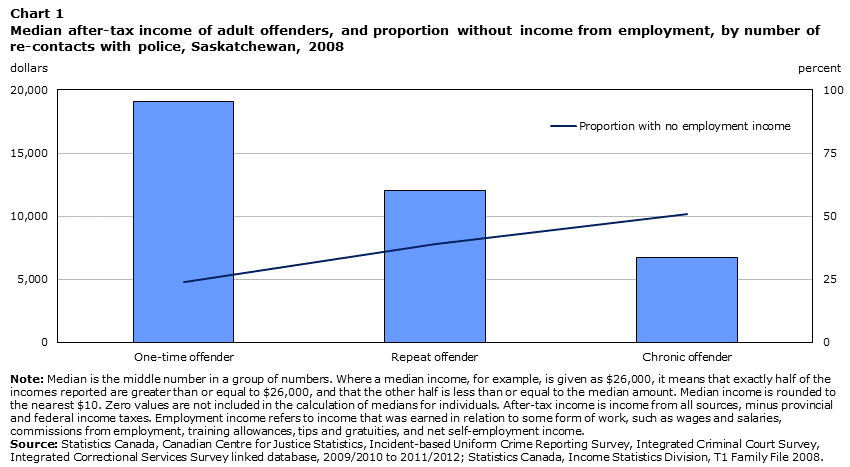
Data table for Chart 1
| Dollars | Proportion with no employment income | |
|---|---|---|
| dollars | percent | |
| One-time offender | 19,080 | 24 |
| Repeat offender | 12,070 | 39 |
| Chronic offender | 6,740 | 51 |
|
Note: Median is the middle number in a group of numbers. Where a median income, for example, is given as $26,000, it means that exactly half of the incomes reported are greater than or equal to $26,000, and that the other half is less than or equal to the median amount. Median income is rounded to the nearest $10. Zero values are not included in the calculation of medians for individuals. After-tax income is income from all sources, minus provincial and federal income taxes. Employment income refers to income that was earned in relation to some form of work, such as wages and salaries, commissions from employment, training allowances, tips and gratuities, and net self-employment income. Source: Statistics Canada, Canadian Centre for Justice Statistics, Incident-based Uniform Crime Reporting Survey, Integrated Criminal Court Survey, Integrated Correctional Services Survey linked database, 2009/2010 to 2011/2012; Statistics Canada, Income Statistics Division, T1 Family File 2008. |
||
Approximately one-half of chronic offenders had no employment income
While after-tax income includes multiple sources of revenue including money obtained from wages and salaries, government transfers and other sources (e.g., investments, pensions, or alimony), employment income looks at money that was earned in relation to some form of work, such as wages and salaries, commissions from employment, training allowances, tips and gratuities, and self-employment income.
Of the 21,322 offending adults who filed taxes in 2008, more than one-third (35%) indicated that they had no employment income. Chronic offenders were proportionately more likely than both one-time and repeat offenders to have had no employment income. In total, approximately half (51%) of all chronic offenders reported having no employment income, compared to 24% of one-time and 39% of repeat offenders (Chart 1). Part of this could be explained by the fact that chronic offenders have more difficulty securing employment as a result of their criminal history, or were unable to hold down a job based on time spent in the justice system (e.g., court procedures, incarceration) (Stoll and Bushway 2008).
Chronic offenders most commonly rely on government transfers as main source of income
By understanding the various sources that make up one’s overall income, it is possible to determine an individual’s main source of income, which can provide insight into how reliant they are on government transfersNote —also known as the Economic Dependency Ratio (EDR).Note The EDR tells us how many dollars of government transfers are received for every $100 of employment earnings. Among those who had a contact with police in Saskatchewan in 2009/2010 and also filed their taxes in 2008, the EDR was 29.35 (Table 1). Said otherwise, on average, $29.35 in government transfers were received for every $100 of employment income. This was close to double the EDR for the overall Canadian population (15.50), as well as the general population in Saskatchewan (15.70) in 2008 (Statistics Canada, table 11-10-0033-01).
Knowing that government transfers were the main source of income for a higher proportion of chronic offenders (56%) than for repeat offenders (44%) or one-time offenders (28%), it is to be expected that they would have a higher EDR than the other two groups. Based on the 2008 tax information, chronic offenders (61.95) had an EDR that was more than one and a half times higher than repeat offenders (39.30), and more than three times higher than one-time offenders (18.23) (Chart 2). This is of particular importance, as it indicates that chronic offending is also a social system concern and not simply a justice system consideration.
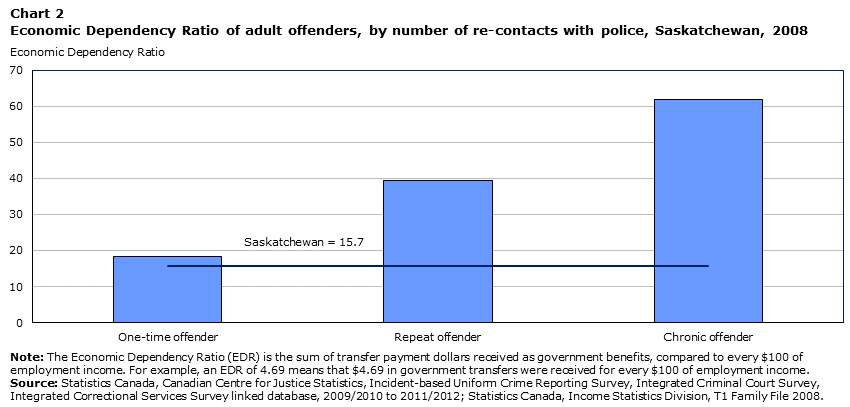
Data table for Chart 2
| Saskatchewan | ||
|---|---|---|
| Economic Dependency Ratio | ||
| One-time offender | 18.23 | 15.7 |
| Repeat offender | 39.30 | 15.7 |
| Chronic offender | 61.95 | 15.7 |
|
Note: The Economic Dependency Ratio (EDR) is the sum of transfer payment dollars received as government benefits, compared to every $100 of employment income. For example, an EDR of 4.69 means that $4.69 in government transfers were received for every $100 of employment income. Source: Statistics Canada, Canadian Centre for Justice Statistics, Incident-based Uniform Crime Reporting Survey, Integrated Criminal Court Survey, Integrated Correctional Services Survey linked database, 2009/2010 to 2011/2012; Statistics Canada, Income Statistics Division, T1 Family File 2008. |
||
Half of offenders were considered to be in a situation of low income
Not only did the individuals who came into contact with police in Saskatchewan in 2009/2010 typically have a lower income than the overall Saskatchewan population, but many of them were considered to be in a situation of low income. In 2008, half (51%) of the approximately 21,000 individuals who had contact with Saskatchewan police in 2009/2010 and filed taxes in 2008 qualified as low-income, based on the Low Income Measure (LIM)Note (Table 1). This proportion was even higher when considering the number of re-contacts an individual had, with seven in ten (70%) chronic offenders qualifying as low income compared with 57% of repeat offenders and 35% of one-time offenders.
Construction the most common employment industry listed by individuals who came into contact with police
When considering the types of employment that these offenders were engaged in, construction was the most commonly listed industry, regardless of the number of re-contacts. More specifically, 19% of chronic offenders, 17% of repeat offenders and 14% of one-time offenders reported construction as their main employment industry for earnings (Chart 3). Other commonly listed industries among offenders included: accommodation and food services, retail trade, public administration and manufacturing.Note
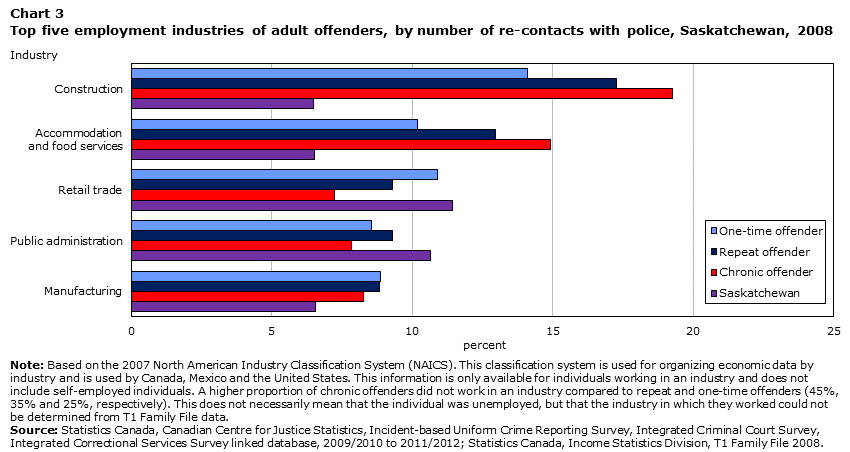
Data table for Chart 3
| Industry | One-time offender | Repeat offender | Chronic offender | Saskatchewan |
|---|---|---|---|---|
| percent | ||||
| Construction | 14.12 | 17.27 | 19.27 | 6.47 |
| Accommodation and food services | 10.17 | 12.97 | 14.91 | 6.51 |
| Retail trade | 10.89 | 9.30 | 7.22 | 11.44 |
| Public administration | 8.56 | 9.31 | 7.83 | 10.64 |
| Manufacturing | 8.86 | 8.85 | 8.25 | 6.55 |
|
Note: Based on the 2007 North American Industry Classification System (NAICS). This classification system is used for organizing economic data by industry and is used by Canada, Mexico and the United States. This information is only available for individuals working in an industry and does not include self-employed individuals. A higher proportion of chronic offenders did not work in an industry compared to repeat and one-time offenders (45%, 35% and 25%, respectively). This does not necessarily mean that the individual was unemployed, but that the industry in which they worked could not be determined from T1 Family File data. Source: Statistics Canada, Canadian Centre for Justice Statistics, Incident-based Uniform Crime Reporting Survey, Integrated Criminal Court Survey, Integrated Correctional Services Survey linked database, 2009/2010 to 2011/2012; Statistics Canada, Income Statistics Division, T1 Family File 2008. |
||||
The impact of a contact with the justice system on the economic and employment profile of adults (aged 18 and older)
Based on the above information, these offenders were more financially marginalized relative to the general population. These offenders had a lower annual income, were proportionately more likely to be in a situation of low income, as well as relied more heavily on government transfers than the general population. This is of concern since a contact with the justice system could potentially worsen this situation. For instance, a contact with police for involvement in a criminal incident may pose a threat to an individual’s current job, especially if time away is needed for court appearances and/or time spent in a correctional facility. Additionally, having a criminal record can impact future job prospects (Farrington 2003). Therefore, it is possible that the contact with police could exacerbate an individual’s financial problems, leaving them even more economically disadvantaged than before their contact with the police in 2009/2010 (Lopes et al. 2012).
By analyzing individuals who had a contact with Saskatchewan police in 2009/2010 and also consistently filed their taxes for the years 2008, 2009, 2010, 2011, it is possible to gain a better understanding if, and how, a contact with the justice system could impact their economic and employment situation. Of the 21,322 individuals who filed taxes for 2008, 71%, or 15,198, also filed taxes for 2009, 2010 and 2011. The next section analyzes the income patterns of these specific individuals over a four-year period.Note
Employment income decreased after contact with police
Overall, individuals who came into contact with police in 2009/2010 experienced decreases in their employment income. The impact on salary was greatest among chronic offenders, who experienced a 23% decline in their employment income between 2008 and 2009. While their employment incomes began to rebound in 2010, it remained 14% lower than 2008. That said, by 2011, their wages and salary returned to 2008 levels (Chart 4).
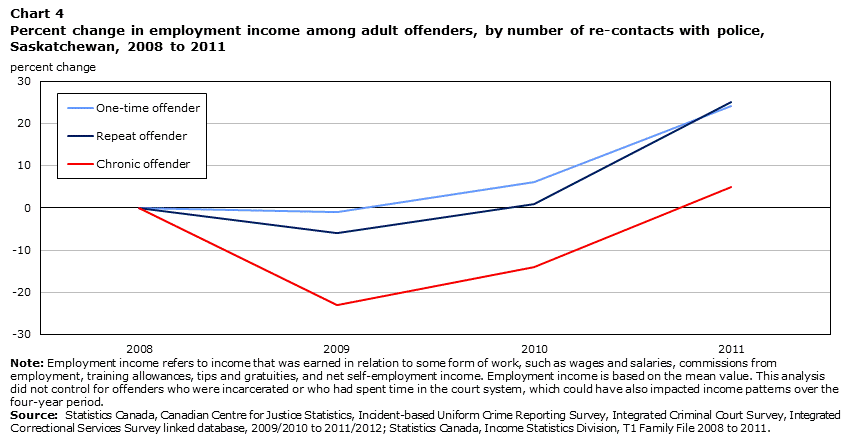
Data table for Chart 4
| 2008 | 2009 | 2010 | 2011 | |
|---|---|---|---|---|
| percent change | ||||
| One-time offender | 0.0 | -1.0 | 6.0 | 24.0 |
| Repeat offender | 0.0 | -6.0 | 1.0 | 25.0 |
| Chronic offender | 0.0 | -23.0 | -14.0 | 5.0 |
|
Note: Employment income refers to income that was earned in relation to some form of work, such as wages and salaries, commissions from employment, training allowances, tips and gratuities, and net self-employment income. This analysis did not control for offenders who were incarcerated or who had spent time in the court system, which could have also impacted income patterns over the four-year period. Source: Statistics Canada, Canadian Centre for Justice Statistics, Incident-based Uniform Crime Reporting Survey, Integrated Criminal Court Survey, Integrated Correctional Services Survey linked database, 2009/2010 to 2011/2012; Statistics Canada, Income Statistics Division, T1 Family File 2008 to 2011. |
||||
Comparatively, the impact of contact with police was not as significant for repeat and one-time offenders. Repeat offenders experienced a more modest decrease (-6%) in employment income between 2008 and 2009, however by 2010 their salary began to rise, and by 2011, their employment income was 25% higher compared to 2008. One-time offenders experienced a slight decrease in salaries between 2008 and 2009, however their salaries increased steadily in 2010 (+6%) and in 2011 (+24%).
Despite decreases in employment income, individuals who came into contact with police in Saskatchewan in 2009/2010 actually saw slight increases in their overall annual after-tax income, starting in 2009, and continuing in both 2010 and 2011. As will be described below, this increase may be due in part to an increase in government transfers, which offset decreases in employment income.
Reliance on government transfers as main source of income increases for offenders in year of police contact
While the overall annual after-tax income of offenders did not appear to be negatively impacted by their contact with the justice system, it did however appear to leave offenders more dependent on government transfers in both the year of contact, and the subsequent year. Said otherwise, in 2008, wages and salaries were the most commonly reported main source of income among individuals, followed by government transfers (50% and 42%, respectively). In 2009, however, equal proportions of offenders reported wages and salaries (46%) and government transfers (46%) as their main sources of income. In 2010, government transfers became the most common main source of income among offenders (48%), followed by wages and salaries (45%). The trend reversed itself again in 2011, with wages and salaries (47%) listed as the most common source of income among offenders, followed by government transfers (45%), however the percentage point difference between the two never quite reached 2008 levels.
Similar trends were seen regardless of the number of re-contacts individuals had with police. Offenders essentially became more reliant on government transfers—and less reliant on wages and salaries—as their main source of income in both the year of contact, and the year following. While the proportion of repeat and chronic offenders who reported government transfers as their main source of income decreased between 2010 and 2011, proportions still remained higher than the year prior to their contact.
As offenders become more reliant on government transfers, it is expected that the economic dependency ratio (EDR) would increase (Chart 5). More specifically, the EDR increased in the year of contact and generally remained relatively stable the following year before tapering off in 2011. This pattern was fairly consistent, regardless of the number of re-contacts one had with police, with the exception of chronic offenders whose overall EDR never quite returned to 2008 levels in 2011 (78.94 and 91.57, respectively).
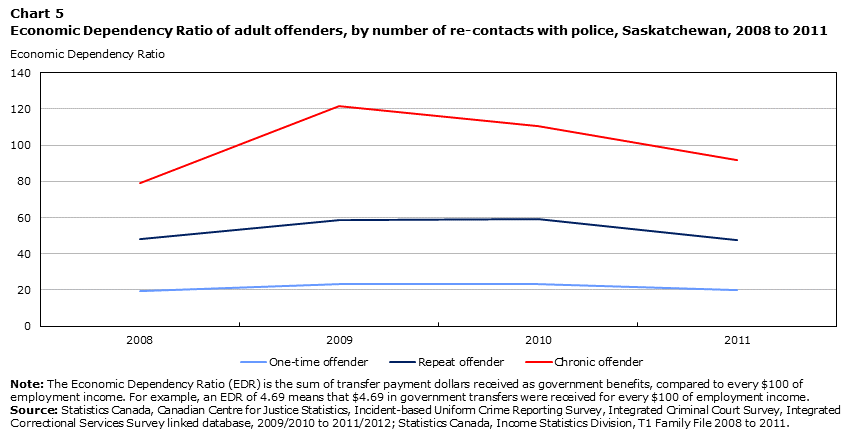
Data table for Chart 5
| Year | One-time offender | Repeat offender | Chronic offender |
|---|---|---|---|
| Economic Dependency Ratio | |||
| 2008 | 19.31 | 48.21 | 78.94 |
| 2009 | 23.41 | 58.75 | 121.60 |
| 2010 | 23.08 | 59.23 | 110.58 |
| 2011 | 19.89 | 47.75 | 91.57 |
|
Note: The Economic Dependency Ratio (EDR) is the sum of transfer payment dollars received as government benefits, compared to every $100 of employment income. For example, an EDR of 4.69 means that $4.69 in government transfers were received for every $100 of employment income. Source: Statistics Canada, Canadian Centre for Justice Statistics, Incident-based Uniform Crime Reporting Survey, Integrated Criminal Court Survey, Integrated Correctional Services Survey linked database, 2009/2010 to 2011/2012; Statistics Canada, Income Statistics Division, T1 Family File 2008 to 2011. |
|||
Proportion of offenders considered to be low income remained relatively stable
Offenders who were considered to be in a situation of low income remained relatively stable between 2008 and 2011. Specifically, the proportion of offenders who qualified as being low income, as determined by the Low Income Measure (LIM), remained virtually unchanged between 2008 and 2009 (both 50%), and tapered off slightly in 2010 and 2011 (49% and 47%, respectively). Small variations to the trend existed depending on the number of re-contacts offenders had with police. For instance, the proportion of chronic offenders considered to be in a situation of low income increased slightly between 2008 and 2009—up from 71% to 73%—remained stable in 2010 (73%), and tapered off slightly reaching 2008 levels again in 2011 (71%).
Text box 3
An economic profile of youth offenders in Saskatchewan and the impact of contact with the justice system
Even though youth (aged 17 and under) made up a small proportion of the re-contact population who filed taxes for 2008, analysis of their tax information can provide some insight on the economic situation of youth offenders, and the impact that a contact with the justice system could have on their economic and employment situation. Of the 37,054 individuals who had a contact with the Saskatchewan police in 2009/2010, 7,615 (21%) were aged 17 and younger. Among those youth offenders, 858 (11%) of them filed taxes for the year prior to their contact with Saskatchewan police in 2009/2010.
Chronic offenders earned less than one-time offenders
Information on youths’ economic and employment situation gathered through the 2008 T1FF is mainly limited to employment income and occupational industry, as the majority of youth did not qualify for government assistance programs or other tax credit programs. The median individual after-tax income of all youth offenders in 2008 was $4,970, with more than half of employed youth working in the retail trade industry (29%) or the accommodation and food services industry (31%).Note Youth with a higher number of police re-contacts experienced a lower median individual after-tax income, in which chronic offenders earned less ($3,900) than both repeat offenders and one-time offenders ($5,100 and $5,110, respectively).
The impact of a contact with the justice system on the economic and employment profile of youth
By having an established economic profile of youth the year prior to their contact with police, subsequent tax filings during the year of contact and beyond can help determine the potential economic impact of the contact. Of the 858 youth that filed taxes for 2008, 729 (85%) continued to file taxes consecutively for the following three years. Possible reasons for not continuing to file consecutively could include participation in criminal activity, as 26% of youth who did not continue to file consecutively were chronic offenders compared to 7% of subsequent filers.
Annual income of youth offenders increased over a four-year period
As youth transition into adulthood, an increase in their median individual after-tax income is to be expected. Noted increases could be due to increased work hours, more experience and hence increases in hourly wages, as well as the possible attainment of higher paying occupations (Shaienks and Gluszynski 2009; Danziger and Ratner 2010). From 2008 to 2011, youth shifted away from employment in the retail trade industry (down from 30% in 2008 to 19% in 2011), as well as the accommodation and food services industry (down from 28% in 2008 to 14% in 2011), toward other industries, most notably the construction industry (up from 7% in 2008 to 20% in 2011).Note
Coinciding with this shift, between 2008 and 2011, the overall individual median after-tax income more than tripled for youth offenders, reaching $16,090 by 2011. Both one-time offenders and repeat offenders saw an annual increase in their after-tax income over the four-year period. Chronic offenders, however, saw their after-tax income decrease slightly between 2008 and 2009, before increasing the following years. Regardless of these increases, chronic offenders consistently earned below what one-time offenders and repeat offenders earned, however, the gap between offender groups had begun to shrink by 2011.
End of text box
Deprivation and marginalization among offenders
In addition to examining tax and employment data as an indicator of well-being, indices of marginalization can be used to understand inequalities in various measures of health and social well-being, both between population groups and between geographical areas. The benefit of these indices is that information is available for even the most marginalized populations, who may not be represented in more traditional sources, such as tax data.Note
One such index is the Canadian Marginalization Index, which is geographically derived using census data to measure four key dimensions of marginalization: material deprivation, residential instability, dependency and ethnic concentration. The various dimensions of the index can be used to compare across (sub) groups of offenders, in this case, highlighting differences between one-time and chronic offenders.
Chronic offenders twice as likely as one-time offenders to experience material deprivation
Material deprivation speaks to socio-economic privilege (or lack thereof) in the areas of housing, education, income and employment. It takes into account a number of different factors, including: the proportion of the population aged 25 to 64 without a high school diploma; the unemployment rate; the proportion of homes needing major repairs; the unemployment rate of private households with children under 6 years old; and, crowding, or the average number of persons per room.
The association between contact with the justice system and material deprivation becomes apparent when comparing the offending population to the Saskatchewan population in general. Just over 4 in 10 (42%) people who came into contact with Saskatchewan police in 2009/2010 were among the most materially deprived, compared to 17% of the Saskatchewan population.
Among offenders, chronic offenders were proportionately more likely to be at risk for material deprivation. Overall, twice as many chronic offenders than one-time offenders were materially marginalized (57% versus 28%) (Chart 6, Table 2).
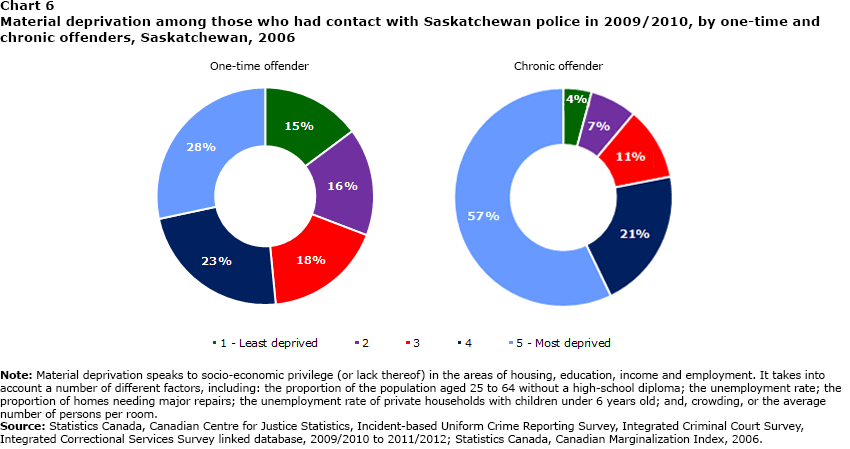
Data table for Chart 6
| One-time offender | percent |
|---|---|
| 1 - Least deprived | 15 |
| 2 | 16 |
| 3 | 18 |
| 4 | 23 |
| 5 - Most deprived | 28 |
| Chronic offender | |
| 1 - Least deprived | 4 |
| 2 | 7 |
| 3 | 11 |
| 4 | 21 |
| 5 - Most deprived | 57 |
|
Note: Material deprivation speaks to socio-economic privilege (or lack thereof) in the areas of housing, education, income and employment. It takes into account a number of different factors, including: the proportion of the population aged 25 to 64 without a high-school diploma; the unemployment rate; the proportion of homes needing major repairs; the unemployment rate of private households with children under 6 years old; and, crowding, or the average number of persons per room. Source: Statistics Canada, Canadian Centre for Justice Statistics, Incident-based Uniform Crime Reporting Survey, Integrated Criminal Court Survey, Integrated Correctional Services Survey linked database, 2009/2010 to 2011/2012; Statistics Canada, Canadian Marginalization Index, 2006. |
|
Residential instability impacts close to one-half of chronic offenders
While material deprivation focuses on socio-economic status, residential instability speaks to the tendency of neighbourhood inhabitants to fluctuate over time, taking into account factors such as the proportion of dwellings that are apartment buildings, residential migration,Note the proportion of the population considered low income, and the proportion of occupied units that are rented rather than owned.
Previous research has shown that residential instability is a contributing risk factor for having contact with the justice system (Boggess and Hipp 2010). The results of this study also highlights an association between residential instability and repeated contact with the justice system. Overall, 43% of individuals who had contact with the justice system in 2009/2010 experienced residential instability, compared to just 23% of the Saskatchewan population in general. Among offenders, close to half (46%) of chronic offenders were in danger of residential instability, a proportion slightly higher than that of one-time offenders (41%) (Table 2).
Risk of dependency similar among all offenders
Although material deprivation and residential instability were found to play a more significant role in explaining differences between offenders and the Saskatchewan population in general, the factors relating to dependency and ethnic concentration showed similar risk between all groups.
In general, dependency relates to reliance on the workforce, and takes into account factors such as the proportion of the population aged 65 and older, the proportion of the population that is female, and the proportion of the population that is separated, divorced or widowed. Overall, 16% of individuals who came into contact with police in Saskatchewan in 2009/2010 were the most likely to experience dependency, a proportion comparable to the population in general (17%). Unlike the risks for material deprivation and residential instability, chronic offenders were slightly less likely than one-time offenders to be among the most dependant (13% versus 16%). This may be due in part to the age distribution of these groups, as chronic offenders typically tend to be younger than one-time offenders.
Conversely, ethnic concentration relates to the community make-up of immigrant populations, and takes into consideration factors such as the proportion of the population who are recent immigrants, the proportion of the population who self-identified as a visible minority, the proportion of the population born outside of Canada, and linguistic isolation—the proportion of the population who speak neither English nor French. In general, the association between ethnic concentration and contact with the justice system proved to be minimal, with 26% of the study population being among the most concentrated compared to 24% of the Saskatchewan population. The difference between chronic offenders and one-time offenders was also found to be minimal, when looking at those considered to be among the most marginalized (28% versus 26%).
Summary
The findings of this article indicate that many of the individuals who came into contact with the justice system in Saskatchewan were economically marginalized. More specifically, the median annual after-tax income of individuals who had a contact with police was about half that of the Saskatchewan population in general. The earning discrepancy was particularly evident among chronic offenders, who earned approximately one-third of the amount reported by one-time offenders. Further, half of individuals who had a contact with police were considered low income, and many, notably chronic offenders, relied on government transfers as their main source of income.
Findings also indicated that the economic situation of those who came into contact with police in 2009/2010 worsened both that year and the following year, possibly as a result of their contact with the justice system. This was particularly true for chronic offenders, who not only experienced a decrease in wages and salaries, but also recorded an increasing reliance on government transfers.
In addition to examining economic and employment data as an indicator of well-being, indices of marginalization can also be used to understand inequalities in various measures of health and social well-being. More specifically, certain factors—namely material deprivation, and to a lesser extent, residential instability—appeared to be associated with differences among the offending population and the Saskatchewan population in general, as well as differences within the offending population. Other factors, including dependency and ethnic concentration, showed similar risk regardless of the population of interest.
Detailed data tables
Survey description
Re-contact data
This study uses special data extracts received in cooperation with, and supported by, the Ministry of Justice, the Royal Canadian Mounted Police and municipal police services in Saskatchewan. The research is also based on data, including additional linking variables, from the Uniform Crime Reporting (UCR2) Survey, the Integrated Criminal Court Survey (ICCS) and the Integrated Correctional Services Survey (ICSS).
The study established the number of people who came into contact and/or had a re-contact with the justice system in Saskatchewan in 2009/2010 by examining records of all founded incidents reported by Saskatchewan police services to the UCR2 survey from 2009/2010 to 2011/2012. The pathways of individuals through the system were established by linking police-reported UCR2 records to data collected through the ICCS and ICSS.
T1 Family File
The Income Statistics Division (ISD) has produced the T1 Family File (T1FF) annually at Statistics Canada since 1982, for the purpose of recreating Canada’s population and family universe. The ISD constructs the file by taking data on individuals who completed a T1 return of income for the reference year and combining those data with information on non-filing spouses and data on children from the Canada Child Tax Benefits (CCTB), vital statistics, and a historical file. It then groups individuals into census families by means of a complex methodology. This approach serves to create an annual file that covers approximately 95% of the Canadian population and contains basic tax and demographic information on the Canadian population.
Canadian Marginalization Index
The Canadian Centre for Justice Statistics produced a Canadian Marginalization Index (Can-Marg) specific to Saskatchewan using 2006 Census of Population data. It is based on methodologies established by Matheson et al. (2012) for the creation of the Canadian Marginalization Index.
It is an area-based index that identifies four dimensions of deprivation and marginalization: material deprivation, residential instability, dependency and ethnic concentration. It uses data from dissemination areas (DA) within Saskatchewan.
Using factor analysis, DA-level factor scores were calculated for each dimension. Within a dimension, ordered scores were assigned a quintile value, 1 through 5, where 1 represents the least deprived and 5 represents the most deprived. Index scores and quintiles were calculated for 98% of the DAs in Saskatchewan.
The index was used as a proxy for individual-level information.
References
Babyak, C., Alavi, A. Collins, K., Halladay, A. and Tapper, D. 2009. The Methodology of the Police-Reported Crime Severity Index. Statistics Canada Catalogue no. HSMD-2009-006.
Boggess, L.N. and Hipp, J.R. 2010. “Violent crime, residential instability and mobility: Does the relationship differ in minority neighborhoods?” Journal of Quantitative Criminology. Vol. 26, no. 3. p. 351-370.
Brennan, S. and Matarazzo, A. 2016. “Re-contact with the Saskatchewan Justice System.” Juristat. Statistics Canada Catalogue no. 85-002-X.
Danziger, S. and Ratner, D. 2010. “Labor market outcomes and the transition to adulthood.” The Future of Children. Vol. 20, no. 1. p. 133-158.
Farrington, D.P. 2003. “Developmental and life-course criminology: Key theoretical and empirical issues—the 2002 Sutherland award address.” Criminology. Vol. 41, no. 2. p. 221-255.
Felson, R.B. and Staff, J. 2017. “Committing economic crime for drug money.” Crime and Delinquency. Vol. 63, no. 4. p. 375-390.
Gudjonsson, G.H. and Sigurdsson, J.F. 2004. “Motivation for offending and personality.” Legal and Criminological Psychology. Vol. 9, no. 1. p. 69-81.
Lopes, G., M.D. Krohn, A.J. Lizotte, N.M. Schmidt, B.E. Vàsquez and J.G. Bernburg. 2012. “Labeling and cumulative disadvantage: The impact of formal police intervention on life chances and crime during emerging adulthood.” Crime and Delinquency. Vol. 58, no. 3. p. 456-488.
Matheson, F.I., J.R. Dunn, K.L.W. Smith, R. Moineddin and R.H. Glazier. 2012. “Development of the Canadian Marginalization Index: A new tool for the study of inequality.” Canadian Journal of Public Health. Vol. 103, suppl. 2. p. s12-s16.
Shaienks, D. and Gluszynski, T. 2009. “Education and labour market transitions in young adulthood.” Culture, Tourism and the Centre for Education Statistics Research Papers. Statistics Canada Catalogue no. 81-595-M.
Statistics Canada. Table 11-10-0033-01 Economic dependency profile of tax filers by source of income and sex.
Statistics Canada. Table 11-10-0050-01 Tax filers and dependents with income by after-tax income, sex and age.
Stoll, M.A. and S.D. Bushway. 2008. “The effects of criminal background checks on hiring ex-offenders.” Criminology and Public Policy. Vol. 7, no. 3. p. 371-404.
Wallace, M., Turner, J., Matarazzo, A. and Babyak, C. 2009. Measuring Crime in Canada: Introducing the Crime Severity Index and Improvements to the Uniform Crime Reporting Survey. Statistics Canada Catalogue no. 85-004-X.
Wyse, J.J.B., D.J. Harding and J.D. Morenoff. 2014. “Romantic relationships and criminal desistance: Pathways and processes.” Eastern Sociological Society. Vol. 29. p. 365-385.
- Date modified: