
Chart 7
Average after-tax personal income of women and men aged 15 or older, by disability status and region, Canada, 2010
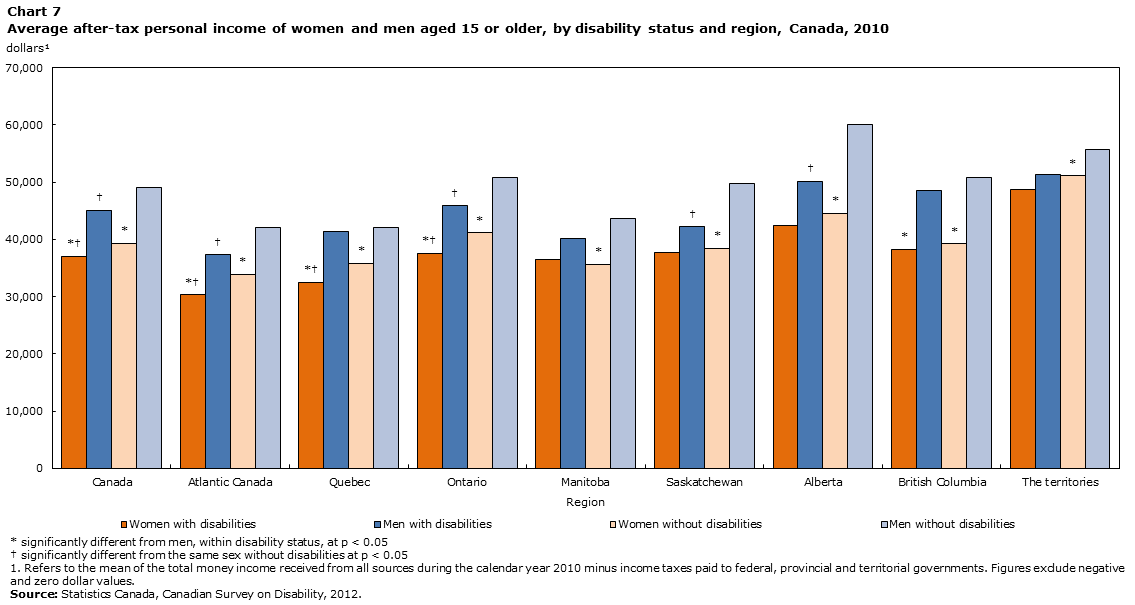
Data table for Chart 7
| Region | Women with disabilities | Men with disabilities | Women without disabilities | Men without disabilities |
|---|---|---|---|---|
| Dollars | ||||
| Canada | 37,070Note * Data table Note † | 45,080Data table Note † | 39,320Note * | 49,050 |
| Atlantic Canada | 30,290Note * Data table Note † | 37,300Data table Note † | 33,930Note * | 42,120 |
| Quebec | 32,550Note * Data table Note † | 41,430 | 35,850Note * | 42,060 |
| Ontario | 37,560Note * Data table Note † | 45,840Data table Note † | 41,190Note * | 50,800 |
| Manitoba | 36,430 | 40,150 | 35,660Note * | 43,660 |
| Saskatchewan | 37,650 | 42,250Data table Note † | 38,480Note * | 49,690 |
| Alberta | 42,430 | 50,200Data table Note † | 44,610Note * | 60,010 |
| British Columbia | 38,270Note * | 48,590 | 39,240Note * | 50,740 |
| The territories | 48,660 | 51,290 | 51,160Note * | 55,730 |
Source: Statistics Canada, Canadian Survey on Disability, 2012. |
||||
- Date modified: