
Illustrated Glossary
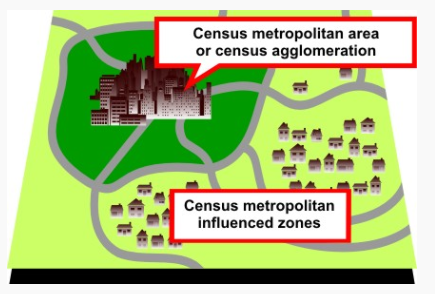
Census metropolitan influenced zone (MIZ)
Definition
The census metropolitan influenced zone (MIZ) is a concept that geographically differentiates the area of Canada outside census metropolitan areas (CMAs) and census agglomerations (CAs). Census subdivisions (CSDs) within provinces that are outside CMAs and CAs are assigned to one of four categories according to the degree of influence (strong, moderate, weak or no influence) that the CMAs or CAs have on them. CSDs within the territories that are outside CAs are assigned to a separate category.
For more information on the census metropolitan influenced zone, consult the Dictionary, Census of Population, 2016.
MIZ tutorial
Census metropolitan areas (CMAs) and census agglomerations (CAs) exert a social and economic influence beyond their geographic limits. The census metropolitan influenced zone (MIZ) classification categorizes census subdivisions (CSDs) that are outside of a CMA or CA based on the degree of influence that CMAs and CAs have on them.
A CSD within a province is assigned to a MIZ category depending on the percentage of its resident employed labour force that commute to work in one or more of the CSDs that are part of the delineation core of a CMA or CA.
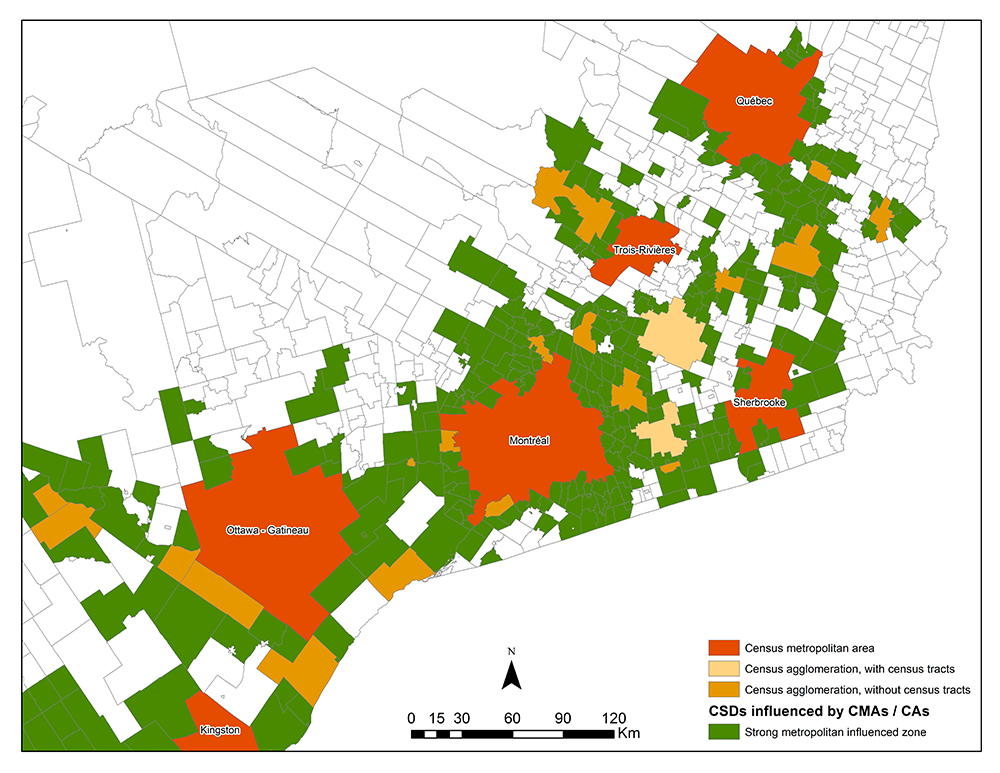
The strong metropolitan influenced zone (strong MIZ) category includes CSDs in provinces where at least 30% of the resident employed labour force living in the CSD works in any CMA or CA core. It excludes CSDs with fewer than 40 persons in their resident employed labour force from the previous census.
Census subdivisions categorized by strong metropolitan influenced zone in Eastern Ontario and Southwestern Quebec
Description for Map
Census subdivisions categorized by strong metropolitan influenced zone in Eastern Ontario and Southwestern Quebec
This map shows the census metropolitan areas (CMAs), census agglomerations (CAs) (subdivided and not subdivided into census tracts) and census subdivisions (CSDs) in Eastern Ontario and Southwestern Quebec. The CSDs are shaded according to which census metropolitan influenced zone (MIZ) category they fall. CSDs in the strong metropolitan influenced zone (strong MIZ) category are shaded on this map.
Source: Statistics Canada, 2016 Census of Population.
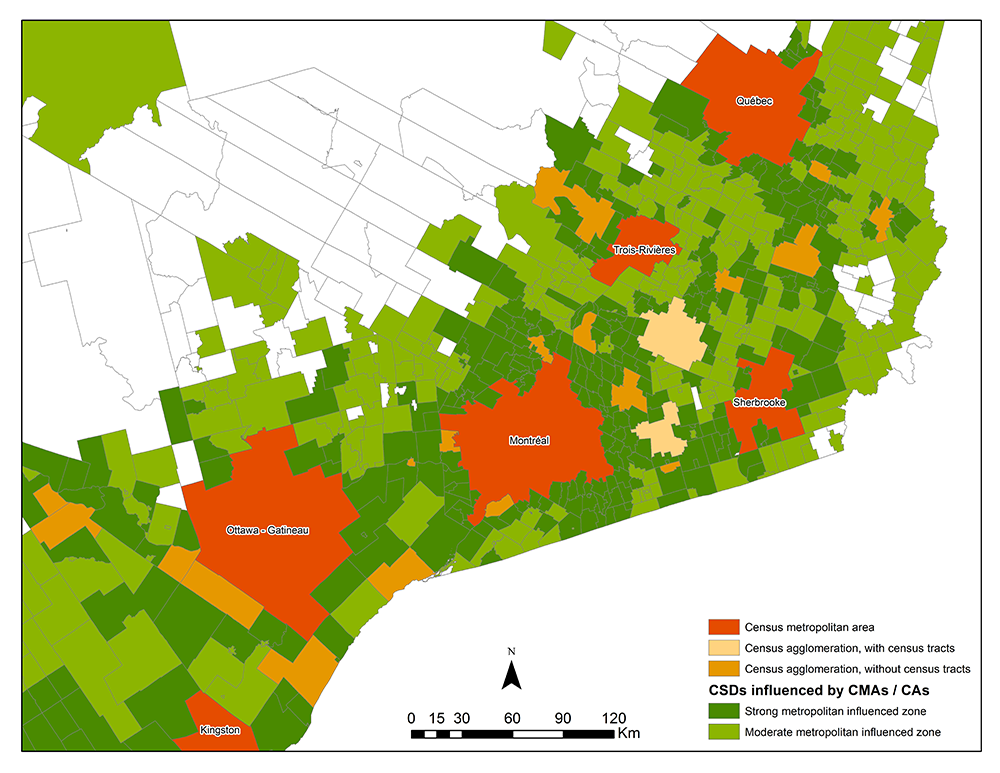
The moderate metropolitan influenced zone (moderate MIZ) category includes CSDs in provinces where at least 5%, but less than 30% of the resident employed labour force living in the CSD works in any CMA or CA core. It excludes CSDs with fewer than 40 persons in their resident employed labour force from the previous census.
Census subdivisions categorized by strong and moderate metropolitan influenced zones in Eastern Ontario and Southwestern Quebec
Description for Map
Census subdivisions categorized by strong and moderate metropolitan influenced zones in Eastern Ontario and Southwestern Quebec
This map shows the census metropolitan areas (CMAs), census agglomerations (CAs) (subdivided and not subdivided into census tracts) and census subdivisions (CSDs) in Eastern Ontario and Southwestern Quebec. The CSDs are shaded according to which census metropolitan influenced zone (MIZ) category they fall. CSDs in the strong metropolitan influenced zone (strong MIZ) and moderate metropolitan influenced zone (moderate MIZ) categories are shaded on this map.
Source: Statistics Canada, 2016 Census of Population.
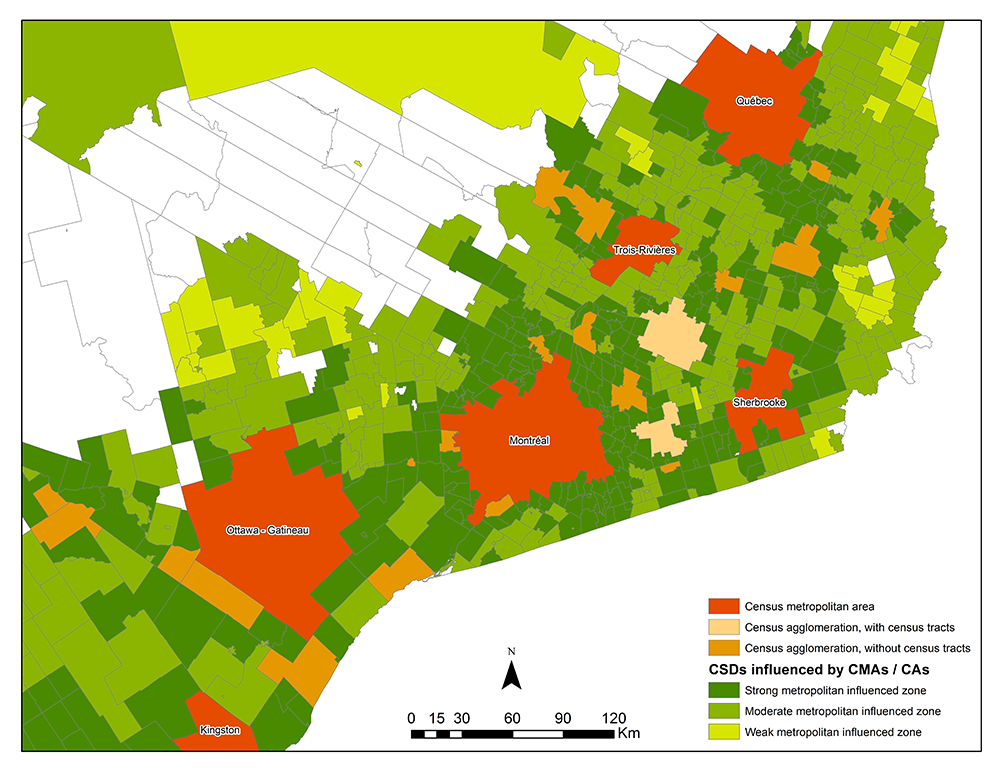
The weak metropolitan influenced zone (weak MIZ) category includes CSDs in provinces where more than 0%, but less than 5% of the resident employed labour force living in the CSD works in any CMA or CA core. It excludes CSDs with fewer than 40 persons in their resident employed labour force from the previous census.
Census subdivisions categorized by strong, moderate and weak metropolitan influenced zones in Eastern Ontario and Southwestern Quebec
Description for Map
Census subdivisions categorized by strong, moderate and weak metropolitan influenced zones in Eastern Ontario and Southwestern Quebec
This map shows the census metropolitan areas (CMAs), census agglomerations (CAs) (subdivided and not subdivided into census tracts) and census subdivisions (CSDs) in Eastern Ontario and Southwestern Quebec. The CSDs are shaded according to which census metropolitan influenced zone (MIZ) category they fall. CSDs in the strong metropolitan influenced zone (strong MIZ), moderate metropolitan influenced zone (moderate MIZ) and weak metropolitan influenced zone (weak MIZ) categories are shaded on this map.
Source: Statistics Canada, 2016 Census of Population.
The no metropolitan influenced zone (no MIZ) category includes CSDs in provinces where no people of the resident employed labour force commutes to work in a CMA or CA core. It also includes CSDs in provinces with fewer than 40 persons in their resident employed labour force from the previous census.
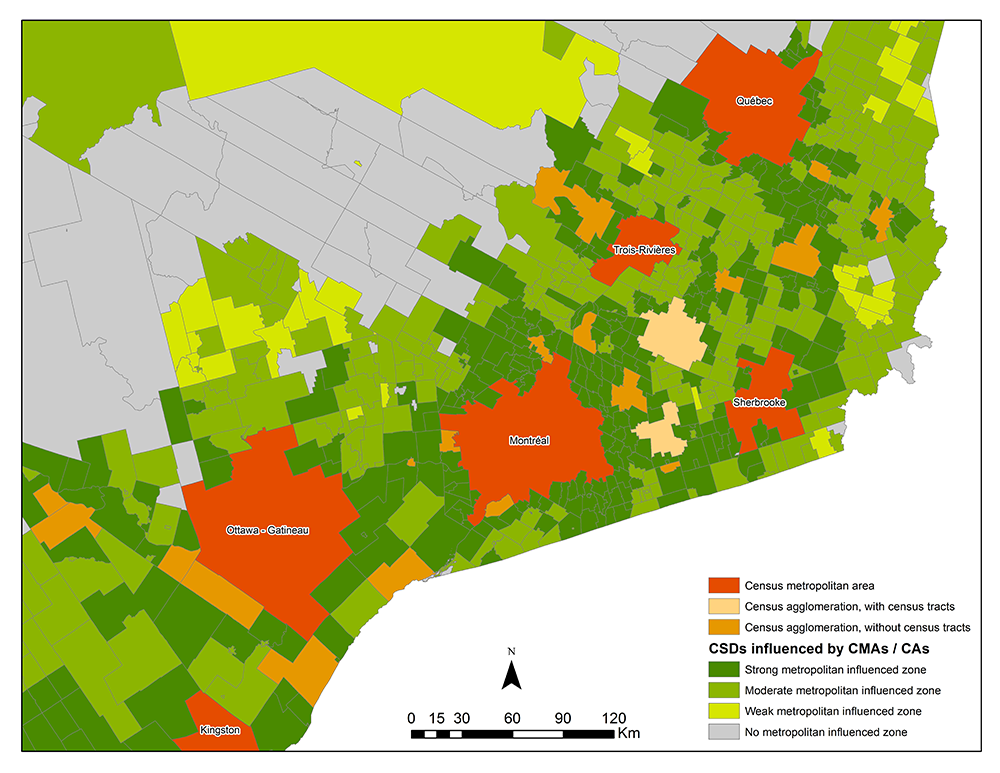
Census subdivisions categorized by strong, moderate, weak and no metropolitan influenced zones in Eastern Ontario and Southwestern Quebec
Description for Map
Census subdivisions categorized by strong, moderate, weak and no metropolitan influenced zones in Eastern Ontario and Southwestern Quebec
This map shows the census metropolitan areas (CMAs), census agglomerations (CAs) (subdivided and not subdivided into census tracts) and census subdivisions (CSDs) in Eastern Ontario and Southwestern Quebec. The CSDs are shaded according to which census metropolitan influenced zone (MIZ) category they fall. CSDs in the strong metropolitan influenced zone (strong MIZ), moderate metropolitan influenced zone (moderate MIZ), weak metropolitan influenced zone (weak MIZ) and no metropolitan influenced zone (no MIZ) categories are shaded on this map.
Source: Statistics Canada, 2016 Census of Population.
- Date modified: