
Feeding the soil puts food on your plate

Archived Content
Information identified as archived is provided for reference, research or recordkeeping purposes. It is not subject to the Government of Canada Web Standards and has not been altered or updated since it was archived. Please "contact us" to request a format other than those available.
By Erik Dorff and Martin S. Beaulieu, Agriculture Division
- Use of commercial fertilizers on the rise
- Where are commercial fertilizers and lime used?
- Manure – the natural fertilizer
- The balancing act of managing crop nutrient costs
- Nutrient management plan
- Feed the crops, feed yourself
As crops grow, they deplete the soil's fertility by absorbing nutrients from the land. These nutrients, then, need to be replenished in order to ensure that there is something in the soil for the next year's crops. Canadian agriculture relies heavily on commercial fertilizers as well as manure to replenish soil's nutrients. This article examines how farmers provide their crops with the nutrients they need to grow and how these farming practices have changed over time.
Use of commercial fertilizers on the rise
From 1971 to 2011, fertilizer shipments to Canadian agriculture markets grew significantly. In 2010-2011, Canadian farmers used twice the amount of nitrogen from commercial fertilizers than they did 30 years earlier in 1980-1981.The amounts remained at similar levels for phosphateNote 1 and potash between the two dates (Chart 1).
The growth in fertilizer use, especially nitrogen, was not the result of an increase in the number of farms reporting the use of commercial fertilizers. That total actually fell by almost half from 188,726 in 1980 to 99,599 farms in 2010.
As well, the share of farms reporting using commercial fertilizers also decreased from 64.7% in 1980-1981 to 57.1% in 2010-2011.
Growth then, was tied to a few different factors. Total cropland grew 14.2% between 1981 and 2011 from 31 million to 35.4 million hectares. Land applied with commercial fertilizers also grew 7.6% from 18.5 million to 24.9 million hectares (Chart 2).
Fertilizer use has also become more intensive (more was applied per hectare of fertilized area) for larger farms. Chart 3 shows that the largest farms used commercial fertilizers with greater intensity, rising from 62.0% of cropland treated with fertilizers in 1980-1981 to 75.9% in 2010-2011. This increase was partially offset, in turn, by smaller farms using relatively less commercial fertilizers during the same period. The combination of the two scenarios, offers some explanation as to why the overall intensity of commercial fertilizer use looks to have levelled off at around 70% of all croplands.
Where are commercial fertilizers and lime used?
The 2011 Census of Agriculture reported that commercial fertilizers were applied on 24.9 million hectares of land in 2010 and that less than 100,000 farms reported using commercial fertilizers. The Prairie provinces, known as Canada's breadbasket since they harvest the majority of the country's grain, reported the majority of fertilized areas in 2010 with 84.5% of total commercial fertilized areas. Saskatchewan had the largest share with 42.1% of commercially fertilized land, followed by Alberta (28.5%).
Soil acidity affects nutrient availability. Lime, which is used to manage soil acidity, was applied on 384,482 hectares in 2010. Lime was primarily applied in Eastern Canada, which accounted for 79.8% of the area where it was used. The practice of liming is less popular in the provinces west of Quebec, since soils are generally less acidic in these regions. Approximately 37.0% of the limed areas were in Quebec, followed by Ontario (27.7%). Saskatchewan was third among provinces with 9.4% of the country's limed areas (Chart 4).
Chart 5 shows the relative importance of the commercial fertilizer and lime areas over the provincial cropland. The distribution varied greatly from one province to another. For example, commercial fertilizers were applied to 79.4% of total cropland in Manitoba in 2010. In contrast, they were applied to about half the cropland in Quebec and British Columbia. These regional differences can be traced to the crop mix grown and the type of soil.
The distribution of lime use also varied greatly from one province to another. Lime was used on only 1.1% of cropland across the country in 2010 according to the 2011 Census of Agriculture. The practice of liming was most common in the Atlantic provinces and in Quebec. In 2010, Prince Edward Island applied lime to 20.2% of the province's cropland—the highest proportion in the country. Newfoundland and Labrador was second, applying lime on 19.5% of cropland, followed by New Brunswick at 11.3%, and Quebec and Nova Scotia each applied it to 7.5% of their respective cropland.
Manure – the natural fertilizer
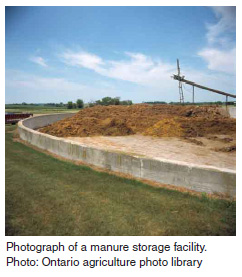
Manure is a natural fertilizer whose benefits include adding nutrients and organic matter to the soil, while reducing the use of chemical fertilizers. Manure also improves the soil structure which, in return, reduces the risk of erosion, run-off and the infiltration of chemicals, organic substances or pathogens into surface and ground water. While the individual nutrient components in formulated fertilizers can be altered and tailored to an individual crop's nutrient requirements, manure presents a more difficult balancing act. Not only does the volume of manure vary, depending on the type of livestock, but so too does its nutrient profile. To make things even more complicated, the manner in which the manure has been stored and how it is applied will also affect what nutrients are available. Often, applying manure at a rate that would match the crop's requirement for one nutrient leaves a deficiency or surplus of another nutrient.
According to the Census of Agriculture, almost half (48.4%) of all Canadian farms applied manure on their land in 2010. Most of them were located in Ontario (28.2%), Alberta (21.6%) and Quebec (15.6%). These three provinces accounted for almost three quarters (72.0%) of total farm cash receipts for livestock and livestock products in 2010.Note 2
Table 1 also shows manure areas by different methods of application. Over one third (37.0%) of land applied with manure or just above 1 million hectares were treated with the application of solid manure incorporated into soil. The second largest area was for solid manure, but not incorporated into soil, with 685,416 hectares (23.9%), followed closely by areas where liquid manure was injected into the soil (22.1% or 633,370 hectares).
| Province | Applied manure | Solid manure incorporated into soil | Solid manure not incorporated into soil | Liquid manure injected into soil | Liquid manure left on soil surface | ||||
|---|---|---|---|---|---|---|---|---|---|
| farms | farms | hectares | farms | hectares | farms | hectares | farms | hectares | |
| Canada | 99,573 | 38,664 | 1,061,393 | 27,988 | 685,416 | 9,312 | 633,730 | 9,612 | 487,471 |
| Newfoundland and Labrador | 231 | 98 | 718 | 70 | 835 | 13 | 633 | 30 | 1,892 |
| Prince Edward Island | 877 | 533 | 14,307 | 293 | 6,582 | 54 | 3,438 | 65 | 3,588 |
| Nova Scotia | 1,799 | 767 | 11,105 | 757 | 13,065 | 87 | 4,325 | 179 | 11,404 |
| New Brunswick | 1,310 | 504 | 6,420 | 585 | 12,498 | 69 | 3,830 | 148 | 10,273 |
| Quebec | 15,535 | 5,968 | 167,328 | 5,608 | 169,363 | 3,831 | 207,045 | 5,690 | 288,455 |
| Ontario | 28,071 | 13,736 | 279,266 | 9,431 | 149,421 | 3,079 | 179,967 | 2,436 | 110,634 |
| Manitoba | 7,453 | 2,790 | 102,742 | 1,980 | 61,519 | 652 | 81,669 | 201 | 17,725 |
| Saskatchewan | 13,324 | 4,110 | 176,746 | 3,260 | 120,791 | 405 | 59,259 | 66 | 5,496 |
| Alberta | 21,494 | 6,835 | 275,724 | 4,049 | 129,813 | 721 | 80,602 | 249 | 20,179 |
| British Columbia | 9,479 | 3,323 | 27,037 | 1,955 | 21,528 | 401 | 12,962 | 548 | 17,826 |
|
Note: Includes field crops, hay, fruits, vegetables, sod, nursery but excludes Christmas tree areas. Source: Statistics Canada, Census of Agriculture, 2011 |
|||||||||
Land areas where solid manure was incorporated into soil were mainly located in Ontario (26.3%), Alberta (26.0%), followed by Saskatchewan (16.7%) and Quebec (15.8%). These are big cattle and dairy producing provinces accounting for 83.8% of the total cattle and calves counted in the 2011 Census.
Liquid manure injected into the soil was mainly reported in Quebec with almost one-third of the total of all areas treated in this way (32.7%), followed by Ontario (28.4%) and Manitoba (12.9%).
Liquid manure storage is the preferable manure storage option for pig operations. These three provinces accounted for 79.1% of all pigs in 2011. Liquid manure left on the surface was generally used in two provinces, Quebec and Ontario, which together accounted for 81.9% of all manure areas applied in this method.
Chart 6 shows changes in the type of manure and application method over time. The 1996 Census of Agriculture was the first time the detailed manure application methods were reported. The intensification of livestock production (increasing use of liquid manure storage system) and stronger environmental regulations (promoting practices such as the injection of liquid manure into soil), meant that between 1995 and 2010 there was a shift toward less area spread with solid manure and more areas where liquid manure was injected into soil.
The balancing act of managing crop nutrient costs
Applying nutrients—whether from commercial fertilizers, lime or manure applications—may be essential for ensuring sustained crop production, but it comes at a cost for farmers. While it is more difficult to isolate the cost related to manure storage, handing and disposal, it is easier for farmers to report commercial fertilizer and lime expenses. These two expense items amounted to $3.6 billion in 2010 and, together, they comprised 8.4% of total farm operating expenses that year, according to the 2011 Census of Agriculture. This expense item accounted for a greater share of farm expenses in the country's grain and oilseeds producing areas—the Prairies provinces—and potato producing regions like Prince Edward Island (Chart 7).
Nutrient management plan
According to Statistics Canada's farm input price index, prices for fertilizer rose, on average, 10.9% each year between 2000 and 2007.Note 3 Breaking these fertilizers down to individual commodities, prices for nitrogen fertilizers increased 12.7% per year, phosphorous fertilizers rose 7.4% per year, and potassium fertilizers prices saw an annual average growth of 8.4%. It should, therefore, come as no surprise that farmers work to balance differing crop nutrient appetites against what is already in the soil in order to spend their fertilizer budget most efficiently. Achieving proper field fertility levels based on crop production is not only economically important, but is also a key factor in meeting environmental regulations.
Chart 8 shows that 41,541 farms reported the practice of nutrient management planning, according to the Census of Agriculture 2011. They accounted for 23.8% of all farms reporting cropland in 2011. The adoption of a nutrient management plan varied from one province to another. Five provinces were above the national average. Quebec had the most with 36.9% of farms with a nutrient management plan, followed by Prince Edward Island (34.2%), Nova Scotia (31.1%), Ontario (25.1%) and Manitoba (24.4%).
Feed the crops, feed yourself
Sustaining a healthy crop requires that farmers provide balanced nutrient conditions. By applying fertilizer and manure to the soil, farmers compensate for deficiencies and, thereby, ensure that the crops have the nutrients they need to grow. This article highlighted how Canadian farmers used commercial fertilizers, lime and manure to achieve this goal.
Commercial fertilizers continue to play an important role. There has been a rise in the use of commercial fertilizers, but use seems to have leveled off over the last few censuses with about 70% of cropland areas being treated. Rising fertilizer costs have likely induced further examination on the use of this farm input.
N-P-K and the rest of the gang: Who are they and what do they do?
Just as the body requires a range of food groups to ensure it receives the proper balance of carbohydrates, fats, vitamins and minerals in sufficient quantities, plants require a variety of nutrients (Table 2). Some nutrients are more important than others, and these requirements vary by crop. In terms of quantity, primary macronutrients—nitrogen, phosphorus, and potassium—are critical for plant growth and are therefore in high demand. It is for this reason that their elemental symbols—N for nitrogen, P for phosphorus, and K for potassium—are displayed prominently on advertisements for fertilizers. Secondary macronutrients on the plant menu include calcium (Ca), magnesium (Mg), and sulfur (S). Finally, micronutrients are required in much smaller amounts and include iron, manganese, zinc, copper, boron, molybdenum, nickel and chlorine. Different fertilization practices—e.g., applying synthetic fertilizers or organic manure—are thus different sources of the same key elements of nitrogen, phosphorus and potassium.
| Element | Symbol | Role in plant growth |
|---|---|---|
| Nitrogen | N | Responsible for plant growth and protein production |
| Phosphorus | P | Essential for seed, fruit, and flower production. |
| Potassium | K | Plays a critical role in a wide number of physiological processes including photosynthesis, protein formation and water use |
| Calcium | Ca | Important component of plant cell walls. |
| Magnesium | Mg | As a key component of chlorophyll, plays an important role in photosynthesis |
| Sulfur | S | Common component of proteins and vitamins. |
| Source: Canadian Fertilizer Institute | ||
While some nutrients are deemed more important than others, the overall nutrient balance is the critical factor affecting plant growth. Justus von Liebig (1803 – 1873), a German chemist known as the "father of agricultural chemistry and the fertilizer industry,� coined the concept of the "law of the minimum� which states that "if one nutritive element is deficient, plant growth will be limited even though supplies of all other vital nutrient elements are adequate.� This law still holds true today.
Notes
- Date modified: