Map 1
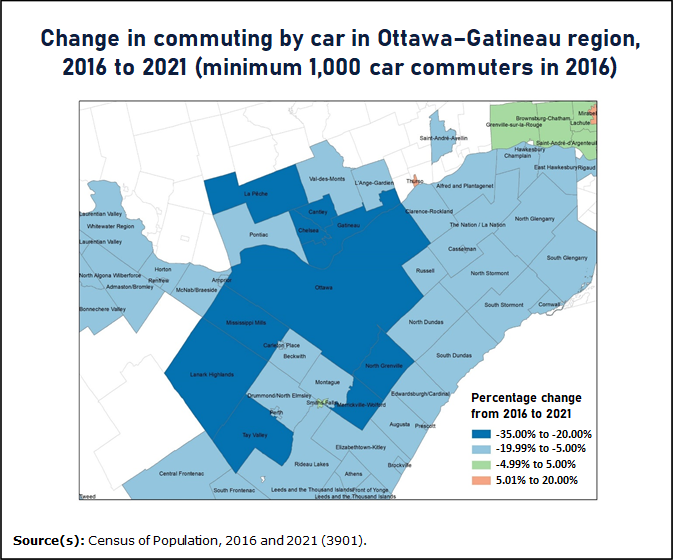
Commuting by car decreases throughout the Ottawa–Gatineau region in May 2021

Map description
The title of the map is "Commuting by car decreases throughout the Ottawa–Gatineau region in May 2021"
This is a map of the Ottawa–Gatineau region, showing the percentage change in car commuting from 2016 to 2021 for census subdivisions with a minimum of 1,000 car commuters in 2016.
The map shows census subdivisions where the percentage change in car commuting from 2016 to 2021 is divided among the following ranges: -35.00% to -20.00%, -19.99% to -5.00%, -4.99% to 5.00%, and 5.01% to 20.00%.
The map shows 10 census subdivisions with a percentage change in car commuting from 2016 to 2021 ranging from -35.00% to -20.00%. These census subdivisions are Gatineau, Cantley, Chelsea and La Pêche in Quebec, and Ottawa, Merrickville-Wolford, North Grenville, Tay Valley, Mississippi Mills and Lanark Highlands in Ontario.
The map shows 45 census subdivisions with a percentage change in car commuting from 2016 to 2021 ranging from -19.99% to -5.00%. These census subdivisions are Rigaud, Saint-André-Avellin, L'Ange-Gardien, Val-des-Monts and Pontiac in Quebec, and South Glengarry, South Stormont, Cornwall, South Dundas, North Dundas, North Stormont, North Glengarry, East Hawkesbury, Hawkesbury, Champlain, Alfred and Plantagenet, The Nation, Clarence-Rockland, Casselman, Russell, Edwardsburgh/Cardinal, Augusta, Prescott, Elizabethtown-Kitley, Brockville, Front of Yonge, Leeds and the Thousand Islands, Rideau Lakes, Athens, Montague, Drummond/North Elmsley, Perth, Beckwith, Carleton Place, South Frontenac, Central Frontenac, Arnprior, McNab/Braeside, Bonnechere Valley, Admaston/Bromley, Horton, Renfrew, Whitewater Region, North Algona Wilberforce and Laurentian Valley in Ontario.
The map shows five census subdivisions with a percentage change in car commuting from 2016 to 2021 ranging from -4.99% to 5.00%. These census subdivisions are Saint-André-d'Argenteuil, Lachute, Brownsburg-Chatham and Grenville-sur-la-Rouge in Quebec, and Smiths Falls in Ontario.
The map shows two census subdivisions with a percentage change in car commuting from 2016 to 2021 ranging from 5.01% to 20.00%. These census subdivisions are Mirabel and Thurso in Quebec.
Source(s): Census of Population, 2016 and 2021 (3901).
- Date modified: