
2016: The year in statistics

2016 was a year of statistical highs at Canada's national statistical organization.
The census was received with great enthusiasm, with Canadians filling it out at an unprecedented rate.
With the arrival of a wave of refugees early in the year, Canada received the largest volume of new immigrants for one quarter, according to the agency's population estimates.
Statistics Canada flexed its analytical muscles in 2016, delving into the social and economic situation of Indigenous people and immigrants in Canada and began to assess the impact of the wildfire in northern Alberta.
The agency took on several initiatives to meet the emerging information needs of Canadians. We released new measures to track inflation and online sales, extended our coverage of children's health through a pilot survey and relaunched an important survey on postsecondary institutions.
We upped our technology game, launching a number of new initiatives, such as using new data visualization tools to release data and a crowdsourcing platform to collect data.
In September 2016, Statistics Canada also welcomed Anil Arora back to the agency, as the new Chief Statistician.
It was a year of achievement, innovation and evolution at Statistics Canada.
Best census since 1666
In 2016, Statistics Canada conducted the Census of Population and Census of Agriculture. Overall, 98.4% of households participated in the Census of Population, up from both the 2006 and 2011 censuses. The participation rate for the long-form questionnaire reached a record high of 97.8%, making it the best census since 1666.
The 2016 Census of Agriculture was also highly successful. More farm operators than ever filled out the questionnaire online in 2016, and the collection period was three months shorter than in 2011. As a result, the 2016 Census of Agriculture was very efficient, and is expected to yield high-quality data.
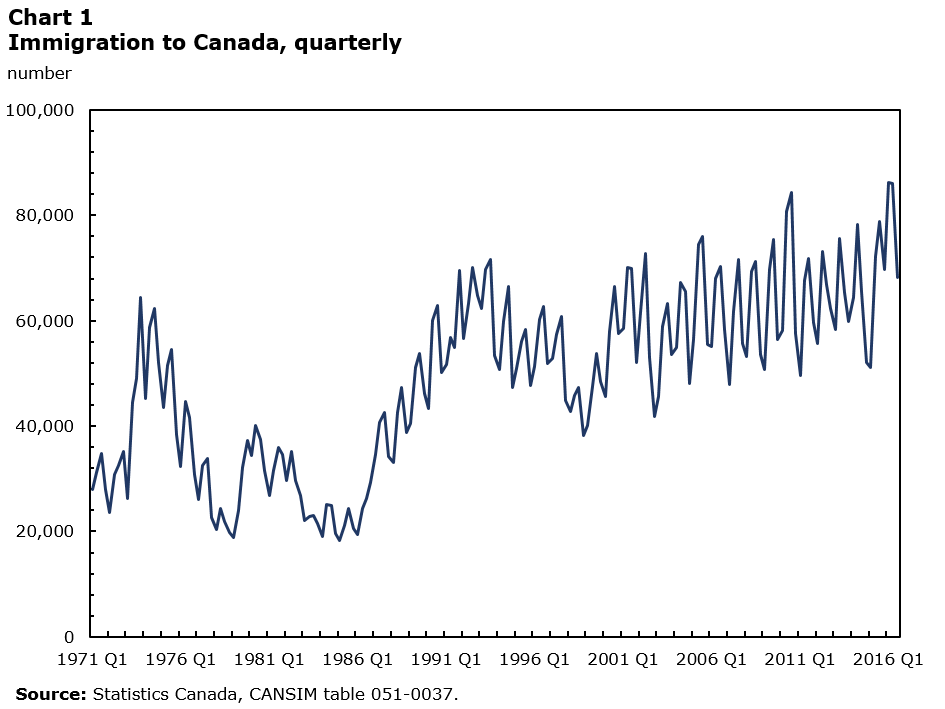
Immigration to Canada has a record high quarter
In summer 2016, Statistics Canada announced that the country had received the largest number of immigrants in a single quarter since the adoption of the current system of demographic accounts in 1971. According to StatCan's population estimates, 86,216 people immigrated to the country in the first quarter, with a large number of Syrian refugees included in these arrivals.
While the immigration levels were not as high in the second and third quarters of 2016, the total for the first three quarters was nevertheless the highest since 1971, with 240,548 immigrants arriving in Canada from January to September 2016, according to population estimates.
Description of Chart 1
| Number of immigrants | |
|---|---|
| Source: Statistics Canada, CANSIM table 051-0037. | |
| 1971 Q1 | 27,899 |
| 1971 Q2 | 31,278 |
| 1971 Q3 | 34,828 |
| 1971 Q4 | 27,895 |
| 1972 Q1 | 23,567 |
| 1972 Q2 | 30,746 |
| 1972 Q3 | 32,474 |
| 1972 Q4 | 35,219 |
| 1973 Q1 | 26,288 |
| 1973 Q2 | 44,545 |
| 1973 Q3 | 49,057 |
| 1973 Q4 | 64,310 |
| 1974 Q1 | 45,302 |
| 1974 Q2 | 58,787 |
| 1974 Q3 | 62,312 |
| 1974 Q4 | 52,064 |
| 1975 Q1 | 43,448 |
| 1975 Q2 | 51,459 |
| 1975 Q3 | 54,550 |
| 1975 Q4 | 38,424 |
| 1976 Q1 | 32,359 |
| 1976 Q2 | 44,695 |
| 1976 Q3 | 41,539 |
| 1976 Q4 | 30,836 |
| 1977 Q1 | 26,048 |
| 1977 Q2 | 32,508 |
| 1977 Q3 | 33,797 |
| 1977 Q4 | 22,561 |
| 1978 Q1 | 20,332 |
| 1978 Q2 | 24,277 |
| 1978 Q3 | 21,948 |
| 1978 Q4 | 19,756 |
| 1979 Q1 | 18,866 |
| 1979 Q2 | 23,948 |
| 1979 Q3 | 32,052 |
| 1979 Q4 | 37,230 |
| 1980 Q1 | 34,349 |
| 1980 Q2 | 40,194 |
| 1980 Q3 | 37,376 |
| 1980 Q4 | 31,579 |
| 1981 Q1 | 26,789 |
| 1981 Q2 | 31,494 |
| 1981 Q3 | 35,931 |
| 1981 Q4 | 34,580 |
| 1982 Q1 | 29,707 |
| 1982 Q2 | 35,121 |
| 1982 Q3 | 29,700 |
| 1982 Q4 | 26,803 |
| 1983 Q1 | 22,002 |
| 1983 Q2 | 22,899 |
| 1983 Q3 | 23,008 |
| 1983 Q4 | 21,468 |
| 1984 Q1 | 19,052 |
| 1984 Q2 | 25,064 |
| 1984 Q3 | 24,881 |
| 1984 Q4 | 19,602 |
| 1985 Q1 | 18,221 |
| 1985 Q2 | 21,221 |
| 1985 Q3 | 24,330 |
| 1985 Q4 | 20,567 |
| 1986 Q1 | 19,342 |
| 1986 Q2 | 24,418 |
| 1986 Q3 | 26,207 |
| 1986 Q4 | 29,376 |
| 1987 Q1 | 34,688 |
| 1987 Q2 | 40,609 |
| 1987 Q3 | 42,535 |
| 1987 Q4 | 34,199 |
| 1988 Q1 | 32,999 |
| 1988 Q2 | 42,478 |
| 1988 Q3 | 47,242 |
| 1988 Q4 | 38,815 |
| 1989 Q1 | 40,480 |
| 1989 Q2 | 51,095 |
| 1989 Q3 | 53,775 |
| 1989 Q4 | 46,166 |
| 1990 Q1 | 43,297 |
| 1990 Q2 | 60,119 |
| 1990 Q3 | 62,927 |
| 1990 Q4 | 50,081 |
| 1991 Q1 | 51,621 |
| 1991 Q2 | 56,753 |
| 1991 Q3 | 54,876 |
| 1991 Q4 | 69,526 |
| 1992 Q1 | 56,579 |
| 1992 Q2 | 63,300 |
| 1992 Q3 | 70,126 |
| 1992 Q4 | 64,851 |
| 1993 Q1 | 62,298 |
| 1993 Q2 | 69,615 |
| 1993 Q3 | 71,534 |
| 1993 Q4 | 53,307 |
| 1994 Q1 | 50,665 |
| 1994 Q2 | 59,854 |
| 1994 Q3 | 66,559 |
| 1994 Q4 | 47,317 |
| 1995 Q1 | 50,904 |
| 1995 Q2 | 55,958 |
| 1995 Q3 | 58,259 |
| 1995 Q4 | 47,754 |
| 1996 Q1 | 51,288 |
| 1996 Q2 | 60,177 |
| 1996 Q3 | 62,750 |
| 1996 Q4 | 51,846 |
| 1997 Q1 | 52,844 |
| 1997 Q2 | 57,417 |
| 1997 Q3 | 60,845 |
| 1997 Q4 | 44,928 |
| 1998 Q1 | 42,813 |
| 1998 Q2 | 45,873 |
| 1998 Q3 | 47,317 |
| 1998 Q4 | 38,181 |
| 1999 Q1 | 40,153 |
| 1999 Q2 | 47,543 |
| 1999 Q3 | 53,841 |
| 1999 Q4 | 48,434 |
| 2000 Q1 | 45,564 |
| 2000 Q2 | 57,871 |
| 2000 Q3 | 66,518 |
| 2000 Q4 | 57,476 |
| 2001 Q1 | 58,485 |
| 2001 Q2 | 70,048 |
| 2001 Q3 | 69,951 |
| 2001 Q4 | 52,154 |
| 2002 Q1 | 61,589 |
| 2002 Q2 | 72,711 |
| 2002 Q3 | 52,919 |
| 2002 Q4 | 41,830 |
| 2003 Q1 | 45,558 |
| 2003 Q2 | 58,863 |
| 2003 Q3 | 63,340 |
| 2003 Q4 | 53,588 |
| 2004 Q1 | 54,914 |
| 2004 Q2 | 67,241 |
| 2004 Q3 | 65,579 |
| 2004 Q4 | 48,090 |
| 2005 Q1 | 56,438 |
| 2005 Q2 | 74,471 |
| 2005 Q3 | 75,945 |
| 2005 Q4 | 55,386 |
| 2006 Q1 | 55,134 |
| 2006 Q2 | 67,909 |
| 2006 Q3 | 70,356 |
| 2006 Q4 | 58,245 |
| 2007 Q1 | 47,875 |
| 2007 Q2 | 61,649 |
| 2007 Q3 | 71,657 |
| 2007 Q4 | 55,573 |
| 2008 Q1 | 53,145 |
| 2008 Q2 | 69,247 |
| 2008 Q3 | 71,312 |
| 2008 Q4 | 53,543 |
| 2009 Q1 | 50,783 |
| 2009 Q2 | 69,651 |
| 2009 Q3 | 75,390 |
| 2009 Q4 | 56,353 |
| 2010 Q1 | 58,041 |
| 2010 Q2 | 80,797 |
| 2010 Q3 | 84,292 |
| 2010 Q4 | 57,552 |
| 2011 Q1 | 49,568 |
| 2011 Q2 | 67,694 |
| 2011 Q3 | 71,876 |
| 2011 Q4 | 59,608 |
| 2012 Q1 | 55,587 |
| 2012 Q2 | 73,044 |
| 2012 Q3 | 66,927 |
| 2012 Q4 | 62,334 |
| 2013 Q1 | 58,256 |
| 2013 Q2 | 75,639 |
| 2013 Q3 | 65,338 |
| 2013 Q4 | 59,789 |
| 2014 Q1 | 64,472 |
| 2014 Q2 | 78,307 |
| 2014 Q3 | 65,588 |
| 2014 Q4 | 52,044 |
| 2015 Q1 | 51,124 |
| 2015 Q2 | 72,088 |
| 2015 Q3 | 78,895 |
| 2015 Q4 | 69,730 |
| 2016 Q1 | 86,201 |
| 2016 Q2 | 86,106 |
| 2016 Q3 | 68,241 |
Wildfire in northern Alberta
Over the summer, the wildfire in Alberta's Fort McMurray area not only affected many people and businesses in the region, but also had an impact on the Canadian economy as a whole. Among the many industries affected, the non-conventional oil extraction industry declined markedly in May, leading to a contraction in the overall economy.
A total of 7.6 million work hours were lost in Fort McMurray, while 2.2 million hours were lost in the rest of Alberta as a result of the wildfire and subsequent evacuation.

Description of Chart 2
| Gross domestic product in billions of chained (2007) dollars | |
|---|---|
| Note: The non-conventional oil extraction industry comprises establishments primarily engaged in producing crude oil from surface shales or tar sands, or from reservoirs containing semi-solid hydrocarbons. Source: Statistics Canada, CANSIM table 379-0031. |
|
| May 2011 | 25.799 |
| June 2011 | 27.707 |
| July 2011 | 28.712 |
| August 2011 | 29.300 |
| September 2011 | 29.564 |
| October 2011 | 28.801 |
| November 2011 | 28.851 |
| December 2011 | 29.116 |
| January 2012 | 30.411 |
| February 2012 | 29.739 |
| March 2012 | 27.715 |
| April 2012 | 29.488 |
| May 2012 | 30.820 |
| June 2012 | 30.224 |
| July 2012 | 30.583 |
| August 2012 | 30.489 |
| September 2012 | 30.223 |
| October 2012 | 30.695 |
| November 2012 | 29.592 |
| December 2012 | 31.101 |
| January 2013 | 30.935 |
| February 2013 | 30.795 |
| March 2013 | 31.655 |
| April 2013 | 30.767 |
| May 2013 | 29.389 |
| June 2013 | 30.358 |
| July 2013 | 30.995 |
| August 2013 | 32.826 |
| September 2013 | 32.098 |
| October 2013 | 32.953 |
| November 2013 | 33.979 |
| December 2013 | 33.806 |
| January 2014 | 33.459 |
| February 2014 | 33.412 |
| March 2014 | 34.137 |
| April 2014 | 34.638 |
| May 2014 | 34.829 |
| June 2014 | 35.409 |
| July 2014 | 34.267 |
| August 2014 | 33.907 |
| September 2014 | 35.785 |
| October 2014 | 37.082 |
| November 2014 | 35.457 |
| December 2014 | 35.074 |
| January 2015 | 37.080 |
| February 2015 | 38.907 |
| March 2015 | 37.370 |
| April 2015 | 35.268 |
| May 2015 | 35.478 |
| June 2015 | 36.757 |
| July 2015 | 40.352 |
| August 2015 | 40.530 |
| September 2015 | 36.169 |
| October 2015 | 37.785 |
| November 2015 | 38.737 |
| December 2015 | 38.705 |
| January 2016 | 39.534 |
| February 2016 | 38.886 |
| March 2016 | 38.448 |
| April 2016 | 35.332 |
| May 2016 | 27.686 |
First increase in crime in 12 years
In 2016, Statistics Canada announced that crime was up for the first time in 12 years. According to police-reported data, both crime severity and the crime rate increased in 2015. Almost 1.9 million Criminal Code incidents (excluding traffic violations) were reported, up by about 70,000 compared with 2014.
Despite the increases, the crime rate was down 29% from 2005, while crime severity was 31% lower.
New measures to track inflation
In November 2016, Statistics Canada presented three additional measures to track inflation. These new measures—Consumer Price Index (CPI)-trim (trimmed mean), CPI-median (weighted median) and CPI-common (common component)—replaced the core index and will be used by the Bank of Canada to obtain a more comprehensive view of inflation in Canada.
The new measures will
- track long-term movements in inflation more closely
- capture persistent trends in inflation
- reflect underlying inflation factors.
Retail e-sales growing in strength
In response to increasing demand for data on e-commerce, Statistics Canada released new data on retail e-sales in November 2016. These data represent Internet sales made by Canada-based store retailers, as well as non-store retailers in the electronic shopping and mail-order houses industry.
Retail e-sales totalled $958 million (not seasonally adjusted) in September, representing 2.1% of all retail sales in Canada. Store retailers accounted for 57% of these sales, and non-store retailers for 43%.
Pilot survey on children's physical and mental health
In October 2016, Statistics Canada conducted the pilot version of its new Canadian Health Survey on Children and Youth. The agency worked with Health Canada and the Public Health Agency of Canada to develop this survey, which collects data on the physical and mental health of children under the age of 12.
Among topics covered are children's physical and sedentary activities, the use of electronic devices, nutrition, time spent in school and extracurricular activities.
Survey results will be used to provide information for program development and assessment, and to support research on children. Statistics Canada plans to release the national results in the fall of 2017.
Reinstatement of the University and College Academic Staff System
In September 2016, Statistics Canada relaunched its University and College Academic Staff System (UCASS). This survey provides data on full-time academic staff, including their gender, age, principal subject taught, academic rank, salary and administrative stipends, and province or country of degrees earned.
This survey, which was conducted annually from 1937 to 2011, was discontinued in 2012. However, because of continued demand for UCASS data, the survey was reinstated. Collection for 2016 data began in September 2016 and the first results are expected in April 2017. Statistics Canada is also in the process of obtaining information for the period from 2012 to 2015.
More analysis
Statistics Canada increased its analytical heft in 2016, releasing a number of analytical articles on the socioeconomic conditions of Indigenous people and immigrants in Canada, as well as on youth employment.
In 2016, the agency released a number of analytical articles and reports on Indigenous people, covering topics such as health and mental health, living arrangements, victimization and literacy. The agency also released analytical articles and reports on immigration in Canada, with subjects ranging from employment and earnings to immigrants' sense of belonging and social integration.
Statistics Canada also took a look at youth employment, releasing the article Perspectives on the Youth Labour Market in Canada in December 2016. Looking beyond the employment rate, the article discussed the characteristics of youth employment over a 40-year span, giving a more complete picture of the labour market for young people.
Finding new ways to interact with data
Statistics Canada jumped right into the innovation pool this year, expanding its use of data visualization tools. In the interest of providing more regional trade data, we developed three interactive tools to help users analyze our new regional trade database, which measured trade across 30 greater economic regions from 2004 to 2012.
The tools help users visualize regional interconnectedness and trade flows, with each tool presenting a different aspect of trade. Users can now obtain trade data for regions such as the Greater Toronto and Hamilton area, the Edmonton region, and interior British Columbia.
Statistics Canada's aspirations did not stop with the development of exciting new visual tools. In October 2016 the agency launched a pilot project to examine the feasibility of collecting information through crowdsourcing. The agency adopted the crowdsourcing platform OpenStreetMap to map buildings across Canada using aerial view maps.
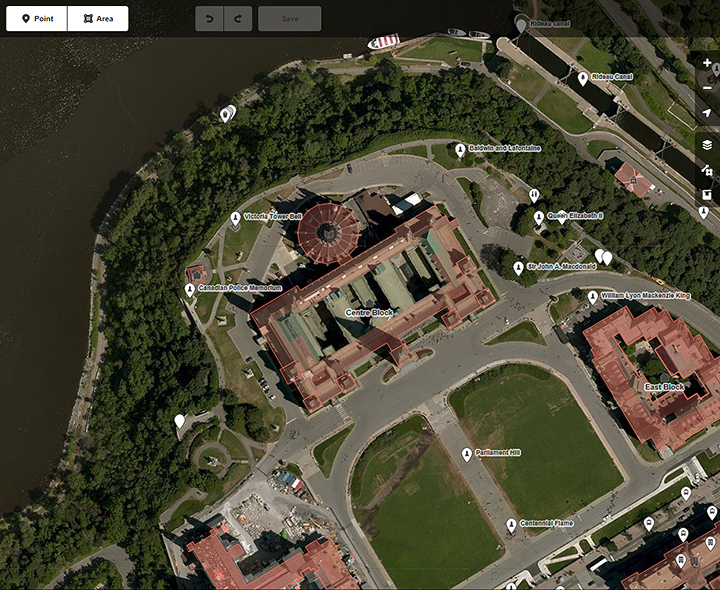
Source: OpenStreetMap.
Canada currently has no national statistics on buildings or their characteristics. Obtaining this information will help communities and governments make sound and informed decisions about infrastructure in Canada.
The project is still in its pilot phase and is limited to Ottawa–Gatineau for now. People living in Canada can sign onto the mapping platform and help identify buildings, streets and areas in their neighbourhood. Participating is easy. Users can access the OpenStreetMap application from our website.
Looking to 2017 and beyond
With ongoing, incremental changes to its programs and technology, Statistics Canada continues its evolution as a national organization that can respond to the demands of a socially complex, digitally connected age. The agency is constantly testing new ideas and learning from the world.
The most highly anticipated activity of 2017 is the release of 2016 Census data. Canadians will get to see the results of the most precise headcount in the country, along with vast amounts of data on who we are, what we do, where we live and how we live.
Login/register to post comments.
Recent posts
-
 1904 people recommended this
 -
 2551 people recommended this
 -
 2925 people recommended this