
Results from Survey of Canadians' Views on Statistics Canada (2018)

Public Opinion Research 2018
- Background Information
- Respondent Profile
- High-Level Overview of Results
- First Impressions and Perceptions
- Trust and Value of Official Statistics
- Access and Use of Information
- More Information
Background Information
Survey Objectives
To gather Canadians' opinions on four themes:
- General knowledge and perception of Statistics Canada
- Access and use of Statistics Canada's information
- Trust in Statistics Canada and the data it produces
- Value of official statistics
Overview
- 12 questions
- 2,050 respondents from a representative panel
- Timeline:
- April 18, 2018: Management approval of POR proposal
- May 25, 2018: POR contract awarded to EKOS
- June 18 – July 9, 2018: Online survey collection
- July 13, 2018: Methodology report and data delivered
- July – August 2018: Analysis by CDB
Respondent Profile
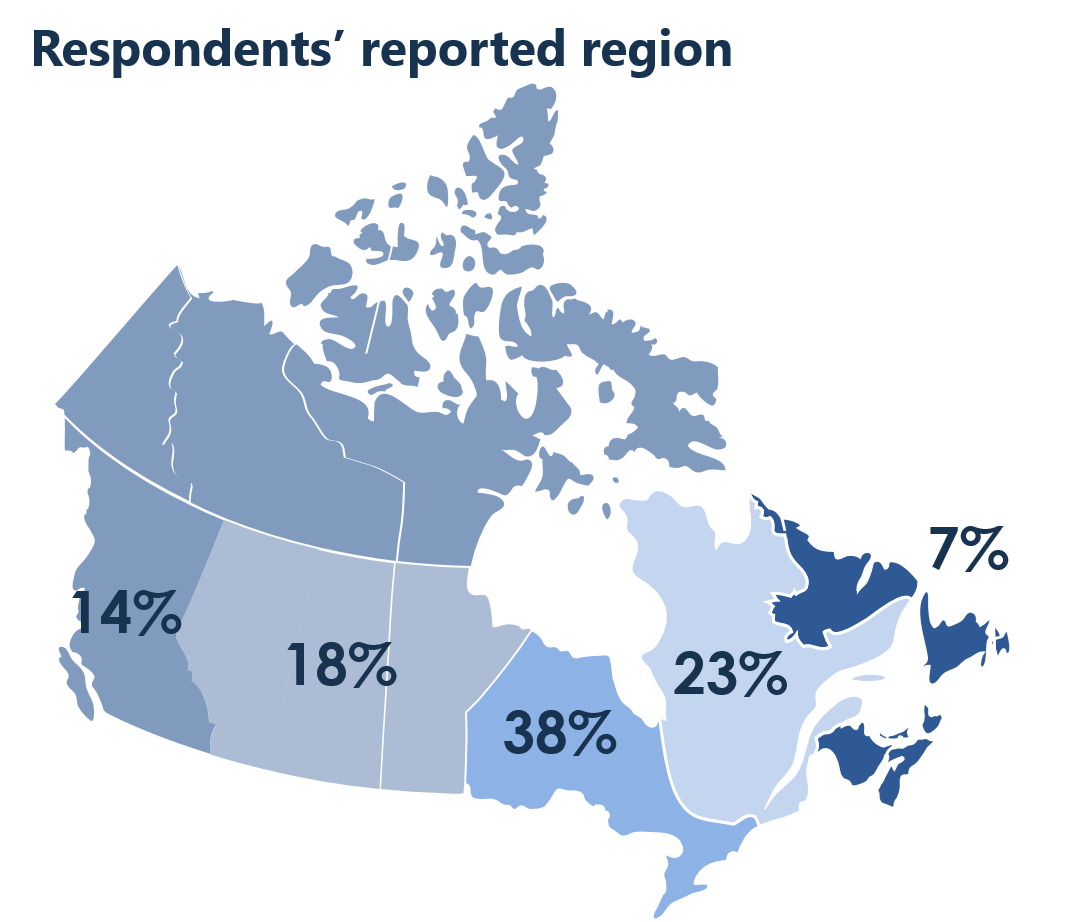
Description for Map 1
| Geography | Respondent % |
|---|---|
| British Columbia and Territories | 14% |
| Prairies | 18% |
| Ontario | 38% |
| Quebec | 23% |
| Atlantic | 7% |
Description for Chart 1
| Gender | Respondent % |
|---|---|
| Male | 48% |
| Female | 50% |
| Other | 2% |
| Age group | Respondent % |
|---|---|
| 18 - 34 | 27% |
| 35 - 44 | 16% |
| 45 - 54 | 17% |
| 55 - 64 | 17% |
| 65 and up | 20% |
| No response | 3% |
Description for Chart 2
| Education | Respondant % |
|---|---|
| University | 46% |
| College | 36% |
| High school or below | 16% |
| Don't know/not stated | 1% |
| Income | Respondant % |
|---|---|
| Less than $40,000 | 15% |
| $40,000-$59,999 | 11% |
| $60,000-$99,999 | 25% |
| $100,000-$149,999 | 20% |
| $150,000 or more | 14% |
| Don't know/not stated | 15% |
High-Level Overview of Results
First thing that comes to mind when people think of "Statistics Canada":
- Statistics on Canadians
- Quality data used for decision-making
- Census
- Important business statistics
- Federal government
- Census complaints
- Conducts surveys
Familiarity: 55% know about Statistics Canada
Use: 58% frequently or occasionally use or reference information produced by Statistics Canada
Perception: 65% of Canadians view Statistics Canada positively
Contribution: 68% believe Statistics Canada contributes to the quality of life of Canadians
Trust:
- Overall: 88% trust Statistics Canada
- Quality: 80% trust the quality of the data that Statistics Canada produces
- Confidentiality: 74% agree that the personal information they provide to Statistics Canada will be kept confidential
Top purpose for using Statistics Canada information: General Interest
Preferred communication channel: Statistics Canada Website
Preferred way to use Statistics Canada information: Visuals (e.g., maps, infographics or interactive charts)
Top method used to obtain Statistics Canada information: Statistics Canada Website
First Impressions and Perceptions
First Thing that Comes to Mind
Regardless of demographics, when asked about the first thing that comes to mind when they think of "Statistics Canada," respondents' top answer was Statistics on Canadians (gather, research, analyze and publish).
Description for Chart 3
| First thing that comes to mind | Respondent % |
|---|---|
| Don't know / No response | 7% |
| Other | 1% |
| Census complaints | 1% |
| Federal government, Tax / CRA | 1% |
| Waste of money, skewed numbers, propaganda, bureaucracy, biased, out-of-date statistics | 3% |
| Conducts surveys and asks Canadians their opinions | 3% |
| Important business statistics | 7% |
| Quality data used for decision-making | 13% |
| Census | 20% |
| Statistics on Canadians | 42% |
General Perception of StatCan
| Positive | Neutral | Negative |
|---|---|---|
| 65% | 26% | 5% |
Why?
|
Why?
|
Why?
|
- Positive perception of Statistics Canada is highest with university graduates.
- Canadians with an income below $100k are less likely to report a positive perception (65%) than those making over $100k (72%).
- The Prairies are less likely to report a positive perception (55%), while respondents in Ontario, Quebec, British Columbia have the most positive perception (just under 70%) of Statistics Canada.
Description for Chart 4
| 2018 | 2007 | 2005 | |
|---|---|---|---|
| Positive | 65% | 79% | 77% |
| Neither | 26% | 6% | 7% |
| Negative | 5% | 10% | 11% |
| Don't know | 3% | 5% | 5% |
| Note: Due to methodological differences, please use caution when comparing data from different years. |
Familiarity with Statistics Canada
Description for Chart 5
| Familiarity | % |
|---|---|
| Familiar | 55% |
| Neither | 19% |
| Unfamiliar | 25% |
| Age Groups | Geography | Education | Income | |
|---|---|---|---|---|
| Most Familiar | 18 – 34 (62%) | Ontario* (64%) | University (63%) | $150K + (70%) |
| Least Familiar | 65 + (50%) | Quebec (35%) | High school and below (46%) | $40K – $60K (44%) |
| * Alberta (61%), Atlantic (60%), British Columbia (59%) and Saskatchewan/Manitoba (58%) | ||||
Trust and Value of Official Statistics
Description for Chart 6
| Statistics Canada | Government institutions | Banks and financial institutions | Private market research or polling companies | The media | |
|---|---|---|---|---|---|
| Trust | 88% | 70% | 58% | 57% | 51% |
| Distrust | 6% | 27% | 39% | 38% | 45% |
| Don't know | 6% | 2% | 3% | 5% | 5% |
Trust in StatCan data quality by Income
Canadians with an income below $60k have the lowest levels of trust at 78%, while 86% of those making over $100k trust the quality of the data.
Trust in quality and confidentiality by Age
Trust in data quality and confidentiality of personal information is highest in those Canadians under the age of 35.
Overall trust in StatCan by Education
Overall trust in Statistics Canada, data quality and confidentiality of personal information is highest in respondents with a university education.
Contribution to Canadians' Quality of Life

Description for Chart 7
| Contribution to Canadians' quality of life | Respondent % |
|---|---|
| Major | 36% |
| Moderate | 32% |
| Little | 17% |
| None | 4% |
| Don't know | 10% |
- Two thirds of Canadians believe the agency makes a major or moderate contribution to the life of Canadians, while 17% believe the agency's contributed a little and 4% believe there was no contribution.
- University educated Canadians are the most likely to believe that activities of Statistics Canada make a major contribution to the quality of life of Canadians (47%).
- Canadians in Quebec are the most likely to believe that the agency makes a major contribution to quality of life of Canadians (42%), whereas the Prairies are the least likely (28%).
- 73% of Canadians that frequently use or reference Statistics Canada information believe its activities contribute to the quality of life of Canadians, compared with 45% of those that occasionally use or reference Statistics Canada information.
Description for Chart 8
| Contribution to Canadians' Quality of Life | 2018 | 2007 | 2005 |
|---|---|---|---|
| Major | 36% | 31% | 27% |
| Moderate | 32% | 45% | 45% |
| Little | 17% | 17% | 19% |
| None | 4% | 3% | 4% |
| Don't know | 10% | 4% | 4% |
Access and Use of Information
Frequency of Use of StatCan Data

Description for Chart 9
| Frequency of use of StatCan data | Respondent % |
|---|---|
| Frequent | 8% |
| Occasional | 50% |
| Never | 36% |
| Don't know | 6% |
| Age Groups | Geography | Education | Income | |
|---|---|---|---|---|
| Top Users (frequent and occasional) |
18 – 34 (70%) | British Columbia* (61%) | University (72%) | $150K + (72%) |
| Non-Users | 65 + (48%) | The Prairies** (41%) | High school and below (54%) | Less than $40K (44%) |
| * Ontario (60%) and Quebec (59%) ** Atlantic (39%) |
||||
Preferred way to use StatCan Data

Description for Chart 10
| Preferred way to use StatCan data | Respondant % |
|---|---|
| Visual (e.g., maps, infographics or interactive charts) | 41% |
| Text (e.g., articles, publications or blogs) | 25% |
| Numeric (e.g., single indicators or data tables) | 23% |
| Auditory (e.g., radio channels or voice assistants) | 6% |
| Don't know | 4% |
| Frequent Users | Occasional Users | Non-Users |
|---|---|---|
| Numeric (38%) | Visual (43%) | Visual (40%) |
Methods used to obtain information

Description for Chart 11
| Methods used to obtain information | Respondent % |
|---|---|
| Statistics Canada website | 68% |
| Internet search | 48% |
| Indirectly through news media | 46% |
| Website other than Statistics Canada | 19% |
| Social media | 12% |
Use of StatCan website to obtain info by Familiarity
…decreases with familiarity, from 73% for users familiar with Statistics Canada to 53% for unfamiliar users.
Use of StatCan website to obtain info by Age
…decreases with age, from 85% for Canadians aged 18 to 34 to 46% for Canadians aged 65+.
Use of StatCan website to obtain info by Education
…increases with education, from 55% for Canadians with a high school education to 75% for Canadians with university education.
Purpose for Using StatCan Information

Description for Chart 12
| Purpose for using StatCan information | Respondent % |
|---|---|
| General interest | 65% |
| Research or analysis | 45% |
| Academic purposes | 37% |
| Policy or program development, decision-making or evaluation | 21% |
| Planning and reporting | 18% |
| Business development or decision-making | 16% |
| Modelling or forecasting | 13% |
| Marketing, including market segmentation or profiles | 10% |
| Funding requests | 8% |
| Legislative requirements | 4% |
| Age Groups | Geography | Education | Income | |
|---|---|---|---|---|
| General Interest | 55 – 64 (73%) | Atlantic (71%) | High school and below (80%) | $60K – $100K (72%) |
| Research or Analysis | 18 – 34 (54%) | Atlantic (49%) | University (51%) | $150K + (56%) |
Communication Channels
Overall, Canadians believe Statistics Canada should primarily use its website to provide information.

Description for Chart 13
| Communication channels | Respondent % |
|---|---|
| Statistics Canada website | 58% |
| Indirectly through news media | 18% |
| Social media | 11% |
| Client services agent, by email | 5% |
| Client services agent, over the telephone | 3% |
| Podcasts, videos or similar tools | 3% |
| Don't know | 3% |
- The number of Canadians wanting information communicated through the Statistics Canada website increases with education.
- Canadians in Quebec are the least likely to want information communicated through the Statistics Canada website.
- The number of Canadians wanting information communicated through the Statistics Canada website increases with income.
- Canadians over 65 years of age are the least likely to want information communicated through the Statistics Canada website and most likely to want the information through the news media.
More Information
All information is from Library and Archives Canada.
- Date modified: