
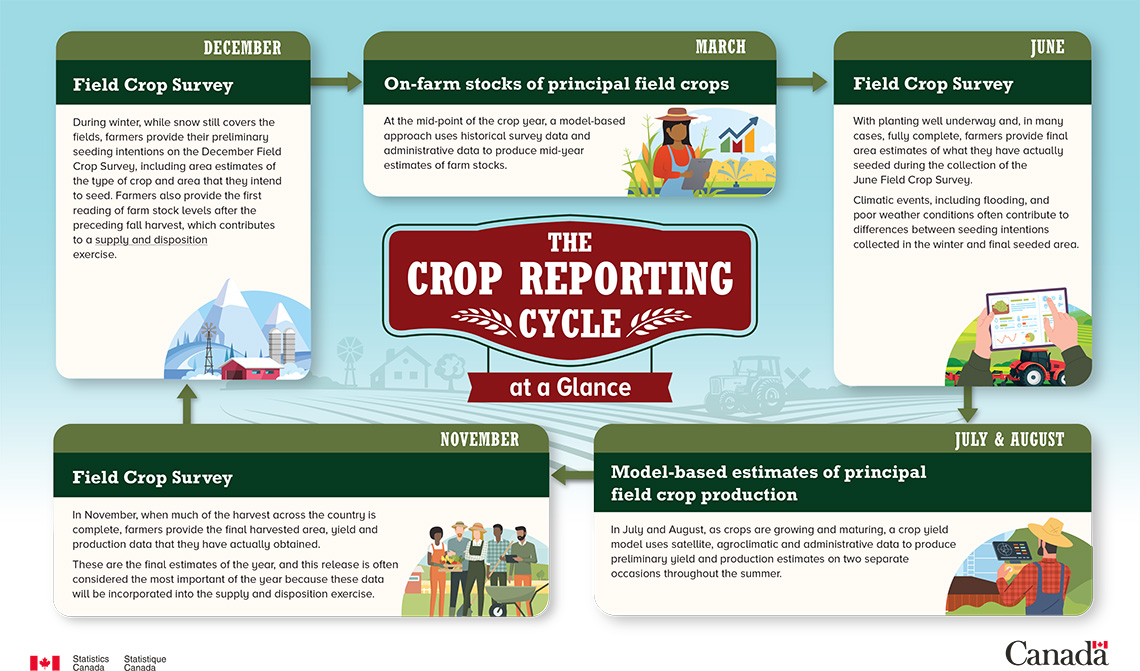
Description: Crop Report Survey at a Glance
The graphic has five sections: December, March, June, July and August, and November.
During winter, while snow still covers the fields, farmers provide their preliminary seeding intentions on the December Field Crop Survey, including area estimates of the type of crop and area that they intend to seed. Farmers also provide the first reading of farm stock levels after the preceding fall harvest, which contributes to a supply and disposition exercise. (In the December section of the graphic, there is an image of a farm with mountains in the background with snow. An arrow leads to the March section of the graphic.)
At the mid-point of the crop year, a model-based approach uses historical survey data and administrative data to produce mid-year estimates of farm stocks. (In the March section of the graphic, there is an image of a farmer holding a clip board and crops visible in the background. An arrow leads to the June section of the graphic.)
With planting well underway and, in many cases, fully complete, farmers provide final area estimates of what they have actually seeded during the collection of the June Field Crop Survey. Climatic events, including flooding, and poor weather conditions often contribute to differences between seeding intentions collected in the winter and final seeded area. (In the June section of the graphic, there is an image of a person recording information on a tablet with tractor cultivating a field in the background. An arrow leads to the July and August section of the graphic.)
In July and August, as crops are growing and maturing, a crop yield model uses satellite, agroclimatic and administrative data to produce preliminary yield and production estimates on two separate occasions throughout the summer. (In the July and August section of the graphic, there is an image of a farmer holding a digital device. An arrow leads to the November section of the graphic.)
In November, when much of the harvest across the country is complete, farmers provide the final harvested area, yield and production data that they have actually obtained.
These are the final estimates of the year, and this release is often considered the most important. These data will be incorporated into the supply and disposition exercise. (In the November section of the graphic, there is an image of a group of farmers holding harvested crops and handheld tools. An arrow leads to the December section of the graphic.)