
Data table for the graph
| Payroll employees working in heath care and social assistance | Payroll employees in health care and social assistance working in hospitals | |
|---|---|---|
|
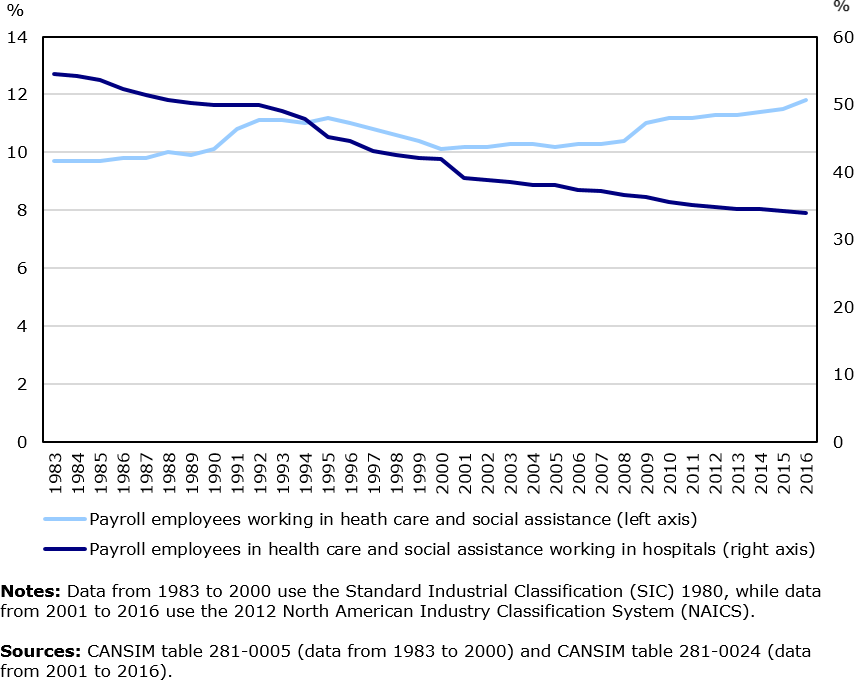
Notes: Data from 1983 to 2000 use the Standard Industrial Classification (SIC) 1980, while data from 2001 to 2016 use the 2012 North American Industry Classification System (NAICS). Sources: CANSIM table 281-0005 (data from 1983 to 2000) and CANSIM table 281-0024 (data from 2001 to 2016). |
||
| 1983 | 9.7 | 54.4 |
| 1984 | 9.7 | 54.2 |
| 1985 | 9.7 | 53.5 |
| 1986 | 9.8 | 52.3 |
| 1987 | 9.8 | 51.4 |
| 1988 | 10.0 | 50.6 |
| 1989 | 9.9 | 50.1 |
| 1990 | 10.1 | 49.8 |
| 1991 | 10.8 | 49.9 |
| 1992 | 11.1 | 49.8 |
| 1993 | 11.1 | 49.0 |
| 1994 | 11.0 | 47.8 |
| 1995 | 11.2 | 45.1 |
| 1996 | 11.0 | 44.6 |
| 1997 | 10.8 | 43.0 |
| 1998 | 10.6 | 42.4 |
| 1999 | 10.4 | 42.0 |
| 2000 | 10.1 | 41.8 |
| 2001 | 10.2 | 39.1 |
| 2002 | 10.2 | 38.7 |
| 2003 | 10.3 | 38.4 |
| 2004 | 10.3 | 38.0 |
| 2005 | 10.2 | 38.0 |
| 2006 | 10.3 | 37.3 |
| 2007 | 10.3 | 37.1 |
| 2008 | 10.4 | 36.6 |
| 2009 | 11.0 | 36.2 |
| 2010 | 11.2 | 35.5 |
| 2011 | 11.2 | 35.0 |
| 2012 | 11.3 | 34.7 |
| 2013 | 11.3 | 34.5 |
| 2014 | 11.4 | 34.4 |
| 2015 | 11.5 | 34.1 |
| 2016 | 11.8 | 33.9 |