
Data table for the graph
| Number | Percentage | |
|---|---|---|
| Observed | ||
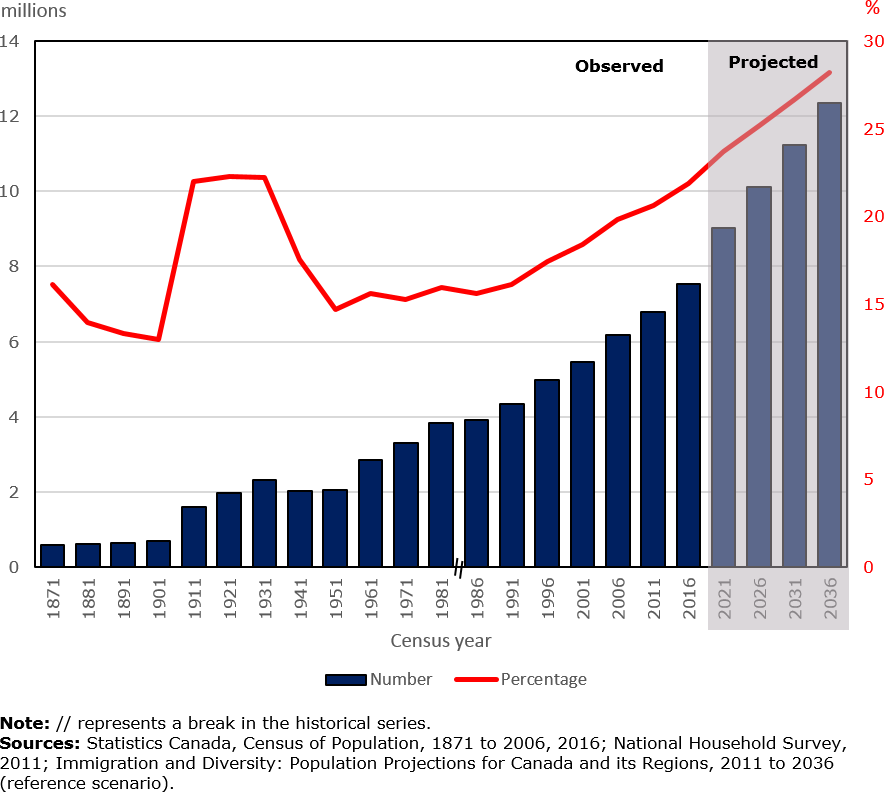
| 1871 | 594,207 | 16.1 |
| 1881 | 602,984 | 13.9 |
| 1891 | 643,871 | 13.3 |
| 1901 | 699,500 | 13.0 |
| 1911 | 1,586,961 | 22.0 |
| 1921 | 1,955,736 | 22.3 |
| 1931 | 2,307,525 | 22.2 |
| 1941 | 2,018,847 | 17.5 |
| 1951 | 2,059,911 | 14.7 |
| 1961 | 2,844,263 | 15.6 |
| 1971 | 3,295,530 | 15.3 |
| 1981 | 3,843,335 | 16.0 |
| 1986 | 3,908,150 | 15.6 |
| 1991 | 4,342,890 | 16.1 |
| 1996 | 4,971,070 | 17.4 |
| 2001 | 5,448,480 | 18.4 |
| 2006 | 6,186,950 | 19.8 |
| 2011 | 6,775,770 | 20.6 |
| 2016 | 7,540,830 | 21.9 |
| Projected | ||
| 2021 | 9,036,000 | 23.7 |
| 2026 | 10,120,000 | 25.2 |
| 2031 | 11,234,000 | 26.7 |
| 2036 | 12,363,000 | 28.2 |
| Sources: Statistics Canada, Census of Population, 1871 to 2006, 2016; National Household Survey, 2011; Immigration and Diversity: Population Projections for Canada and its Regions, 2011 to 2036 (reference scenario). | ||