
Data table for the graph
| 1981 | 1986 | 1991 | 1996 | 2001 | 2006 | 2011 | 2016 | |
|---|---|---|---|---|---|---|---|---|
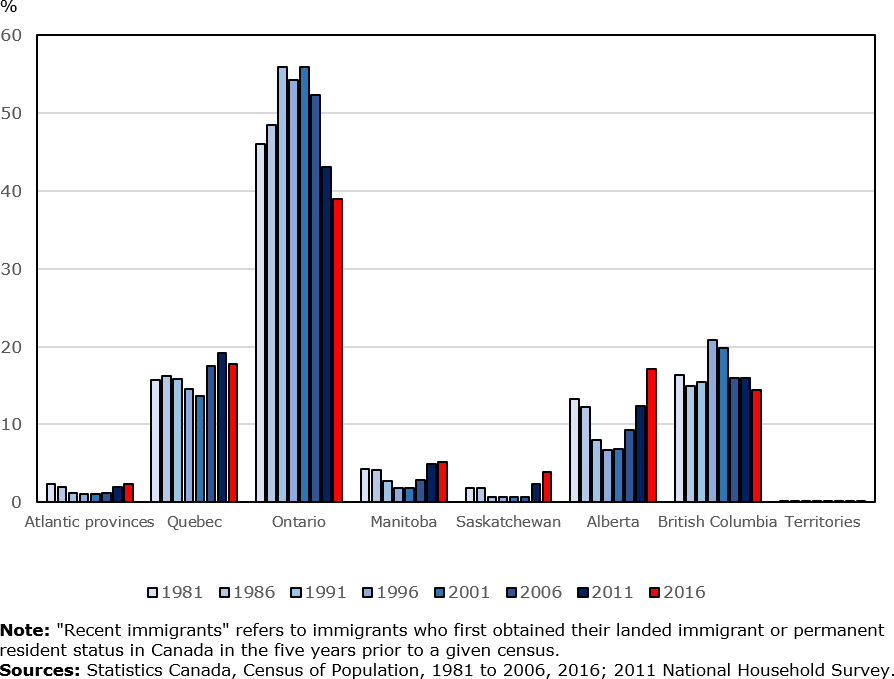
| Atlantic provinces | 2.3 | 2.0 | 1.2 | 1.1 | 1.0 | 1.2 | 2.0 | 2.3 |
| Quebec | 15.7 | 16.2 | 15.8 | 14.5 | 13.7 | 17.5 | 19.2 | 17.8 |
| Ontario | 46.0 | 48.5 | 55.9 | 54.2 | 55.9 | 52.3 | 43.1 | 39.0 |
| Manitoba | 4.3 | 4.2 | 2.7 | 1.8 | 1.8 | 2.8 | 5.0 | 5.2 |
| Saskatchewan | 1.9 | 1.8 | 0.7 | 0.7 | 0.7 | 0.7 | 2.3 | 4.0 |
| Alberta | 13.3 | 12.2 | 8.0 | 6.7 | 6.9 | 9.3 | 12.4 | 17.1 |
| British Columbia | 16.4 | 15.0 | 15.4 | 20.8 | 19.9 | 16.0 | 15.9 | 14.5 |
| Territories | 0.2 | 0.2 | 0.1 | 0.1 | 0.1 | 0.1 | 0.2 | 0.2 |
| Note: "Recent immigrants" refers to immigrants who first obtained their landed immigrant or permanent resident status in Canada in the five years prior to a given census. Sources: Statistics Canada, Census of Population, 1981 to 2006, 2016; 2011 National Household Survey. |
||||||||