
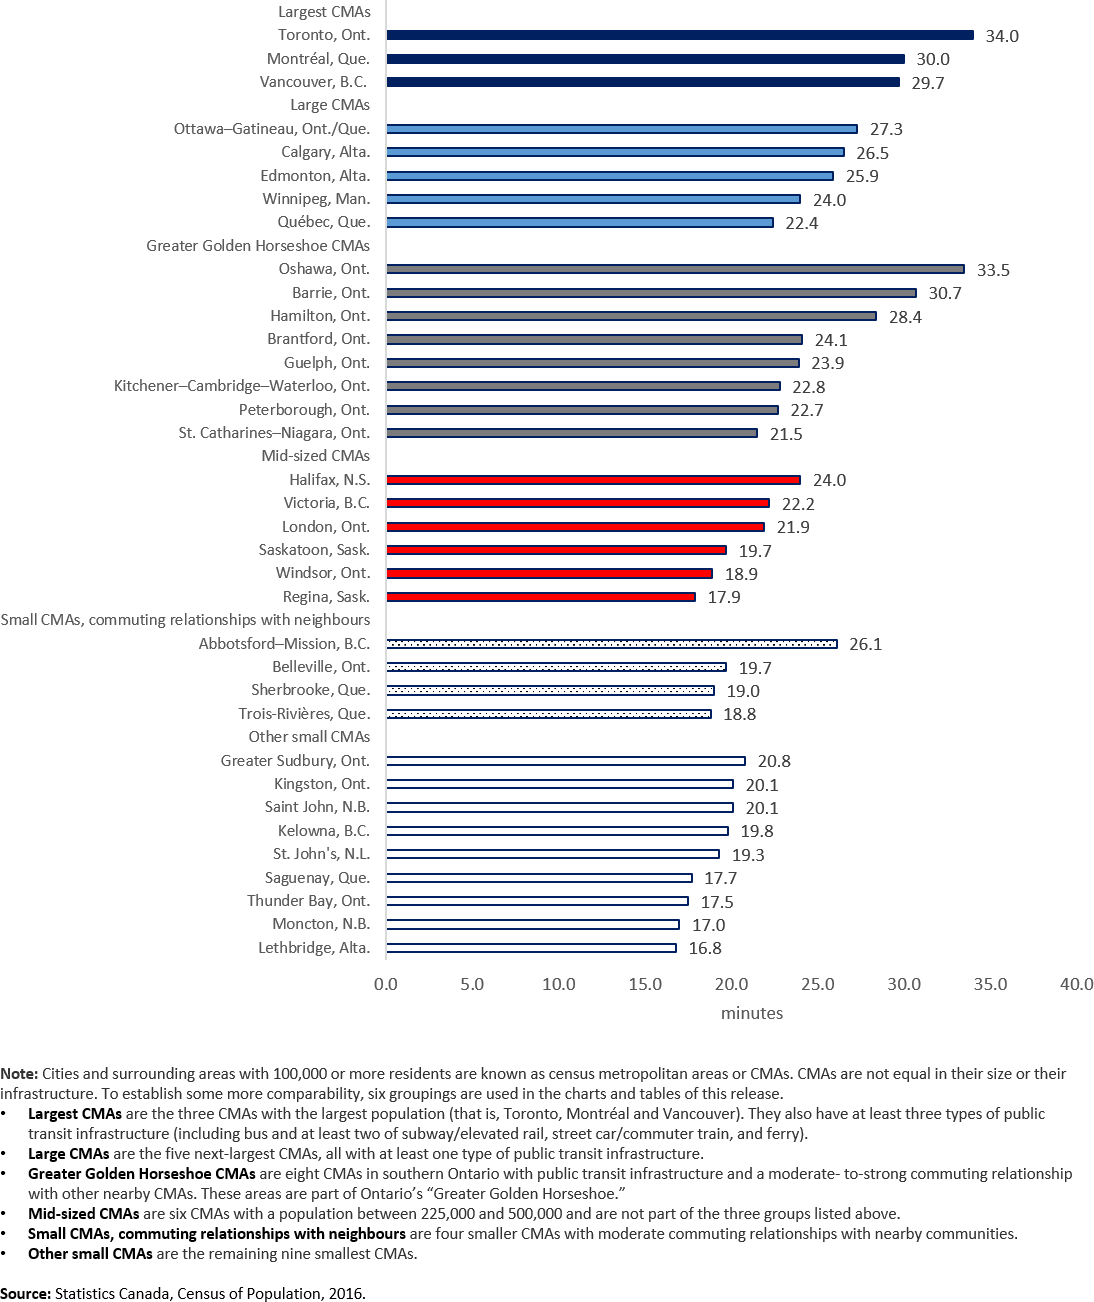
Data table for the graph
| Census metropolitan area (CMA) | Average one-way commuting duration (in minutes) |
|---|---|
| Largest CMAs | |
| Toronto, Ont. | 34.0 |
| Montréal, Que. | 30.0 |
| Vancouver, B.C. | 29.7 |
| Large CMAs | |
| Ottawa–Gatineau, Ont./Que. | 27.3 |
| Calgary, Alta. | 26.5 |
| Edmonton, Alta. | 25.9 |
| Winnipeg, Man. | 24.0 |
| Québec, Que. | 22.4 |
| Greater Golden Horseshoe CMAs | |
| Oshawa, Ont. | 33.5 |
| Barrie, Ont. | 30.7 |
| Hamilton, Ont. | 28.4 |
| Brantford, Ont. | 24.1 |
| Guelph, Ont. | 23.9 |
| Kitchener–Cambridge–Waterloo, Ont. | 22.8 |
| Peterborough, Ont. | 22.7 |
| St. Catharines–Niagara, Ont. | 21.5 |
| Mid-sized CMAs | |
| Halifax, N.S. | 24.0 |
| Victoria, B.C. | 22.2 |
| London, Ont. | 21.9 |
| Saskatoon, Sask. | 19.7 |
| Windsor, Ont. | 18.9 |
| Regina, Sask. | 17.9 |
| Small CMAs, commuting relationships with neighbours | |
| Abbotsford–Mission, B.C. | 26.1 |
| Belleville, Ont. | 19.7 |
| Sherbrooke, Que. | 19.0 |
| Trois-Rivières, Que. | 18.8 |
| Other small CMAs | |
| Greater Sudbury, Ont. | 20.8 |
| Kingston, Ont. | 20.1 |
| Saint John, N.B. | 20.1 |
| Kelowna, B.C. | 19.8 |
| St. John's, N.L. | 19.3 |
| Saguenay, Que. | 17.7 |
| Thunder Bay, Ont. | 17.5 |
| Moncton, N.B. | 17.0 |
| Lethbridge, Alta. | 16.8 |
|
Note: Cities and surrounding areas with 100,000 or more residents are known as census metropolitan areas or CMAs. CMAs are not equal in their size or their infrastructure. To establish some more comparability, six groupings are used in the charts and tables of this release.
Source: Statistics Canada, Census of Population, 2016. |
|