
Data tables that provide the revision history of 19 economic and social time series are available. Statistics Canada has always provided its users with the most recent data available, but after consulting some of its expert data users, the agency identified a need for real-time data or vintage data to make certain types of analysis easier.
The data tables contain vintages of data as of January 2015, some are expanded to provide users with a longer time series. The real-time tables are released approximately one week after the official release of the source data tables.
Background
Statistical revisions are carried out regularly in the compilation of economic and social statistics. These revisions incorporate the most complete and current information from many sources (including surveys, administrative data and public accounts) and use improved estimation methods. While the majority of revisions are done within the months or quarters of a given reference year or on an annual basis, going back two to three years to incorporate benchmark information, some revisions are carried back further to incorporate major changes to concepts or classifications.
Statistics Canada's economic and social statistics programs have well-established policies that govern revisions. Every time Statistics Canada revises data for a given time period, it replaces the existing data table information with the revised data. This ensures that users always have the most up-to-date statistics.
This up-to-date (or revised) information meets the data requirements of most users. However, some users have said that they would like Statistics Canada to provide access to the different vintages of a given time series of economic or social data within a single table or database. A table or database that contains vintages of data is referred to in the international community as a real-time database.
Real-time databases allow users to examine a given time series of economic or social data as it appeared (and was used) at a given point in time before it was revised. This is helpful to users who may want to examine a policy decision—such as a change in interest rates or tax policy—based on the information that was available to policy makers at the time of the decision. These real-time tables help economic and social statistics users to better analyze the impact and development of policy, to prepare forecasts, and to test econometric models.
The revisions in the real-time data tables are not corrections to errors. They represent a normal step in the statistical process, in which statistical agencies produce new vintages of higher quality data as new information becomes available.
Publishing real-time data tables reflects Statistics Canada's values of transparency, accessibility, interpretability, and increased data relevance for users.
Real-time data tables
Statistics Canada releases real-time data for 19 economic and social time series (Table 1). The real-time data tables do not replace the current data tables for these time series; they are a new product for data users.
Structure of the real-time tables
The real-time data tables show all revisions of a specific data point over time. Typically, Statistics Canada releases initial estimates for a given period (month or quarter), revises them in subsequent periods based on new information, then revises them again in an annual or historical revision process. Statistics Canada has determined that the most transparent way to present the vintages is to record the date that the data were released in The Daily, the agency's official release vehicle. The real-time data tables are as easy to use as source data tables, but with one important exception: they contain a vintage dimension that records the date of official release.
For example, let us suppose that on November 30, 2023, gross domestic product data for the third quarter of 2023 were released for the first time. The vintage (release) dimension would record the date as November 30, 2023. Suppose that on May 31, 2024, gross domestic product data for the first quarter of 2024 were released for the first time, along with a revised estimate for the third and the last quarter of 2023. A second entry would be made in the table for the third and the fourth quarter of 2023, and the vintage (release) dimension would have the value of May 31, 2024. As new vintages are added, the real-time tables will display the revised data for selected reference periods in columns.
Likewise, the initial estimates for each reference period appear as the last (non-missing) figure in each column. The comparison between the initial and the most recent estimate therefore represents the difference between the first and last rows in the table for a given reference period. For the most recent reference period, the initial estimate and the most recent estimate are the same.
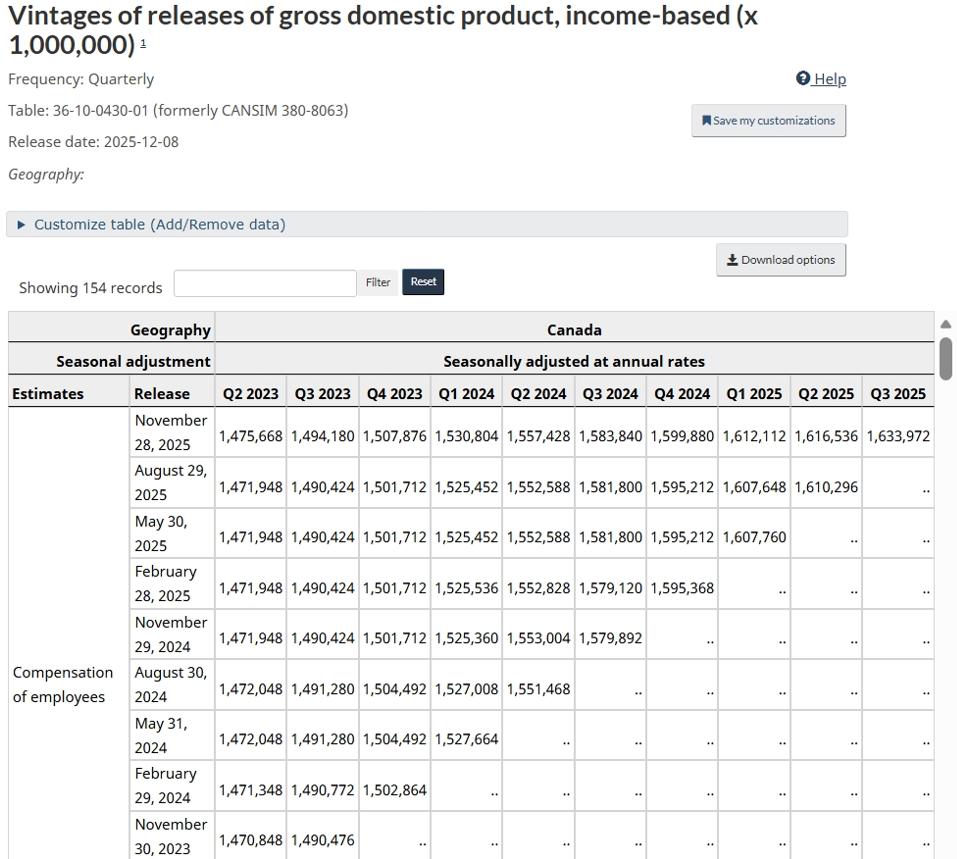
Description - Figure 1 - Gross Domestic Product, Real-time data
This is a real-time data table which shows all revisions of a specific data point over time. On the horizontal axis, the columns indicate calendar years. Each year is subdivided into quarters. The rows of the vertical axis indicate the date data was released.
For each column, the last data point contains the initial data released for that year and quarter. Each subsequent cell above contains revised data for that year and quarter, with the revision date indicated in the corresponding vertical axis.
The first row contains the most recent estimate for each reference period in an economic or social time series. This estimate is consistent with the information in the standard data table for that time series.
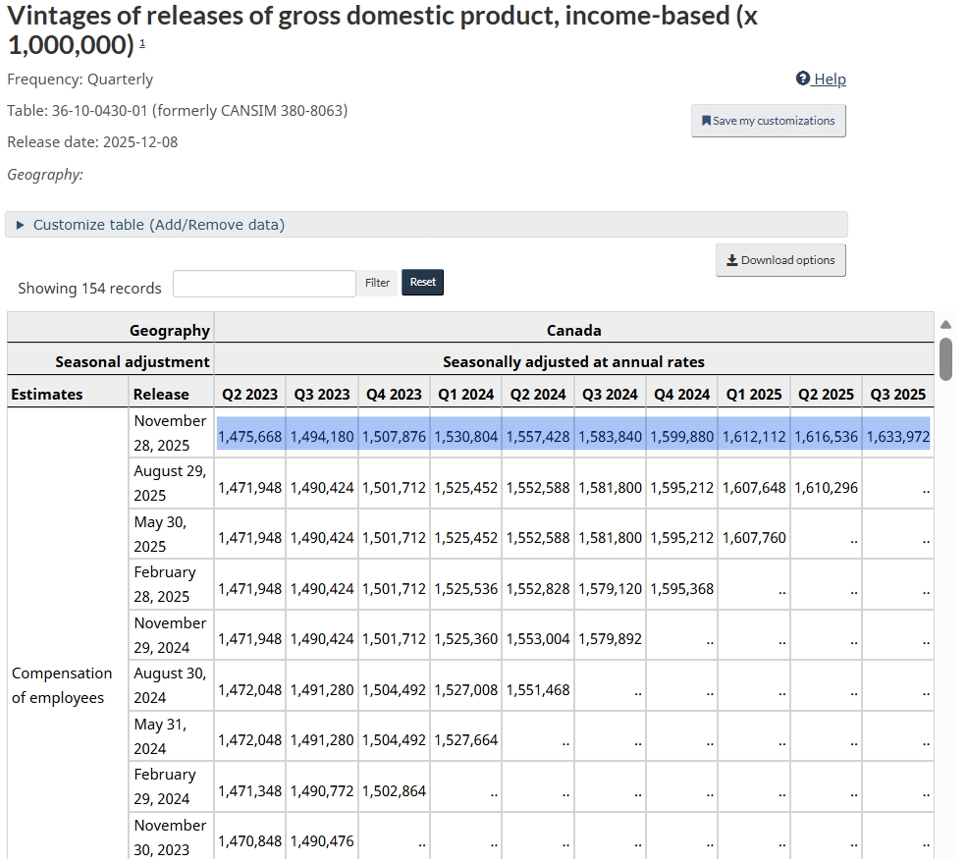
Description - Figure 2 - Gross Domestic Product, Real-time data, November 28, 2025
This is a real-time data table which shows all revisions of a specific data point over time. On the horizontal axis, the columns indicate calendar years. Each year is subdivided into quarters. The rows of the vertical axis indicate the date data was released.
For each column, the last data point contains the initial data released for that year and quarter. Each subsequent cell above contains revised data for that year and quarter, with the revision date indicated in the corresponding vertical axis.
The data in the top row is circled to show all the data released on that date. The data point at the end of the row is the initial release for the quarter indicated, all preceding data points are the most recent revisions to data previously released for past quarters.
The various revisions for a given reference period are shown in the column for that reference period. The release dates associated with each new reference period are on the left-hand side of the table in the vintage dimension.
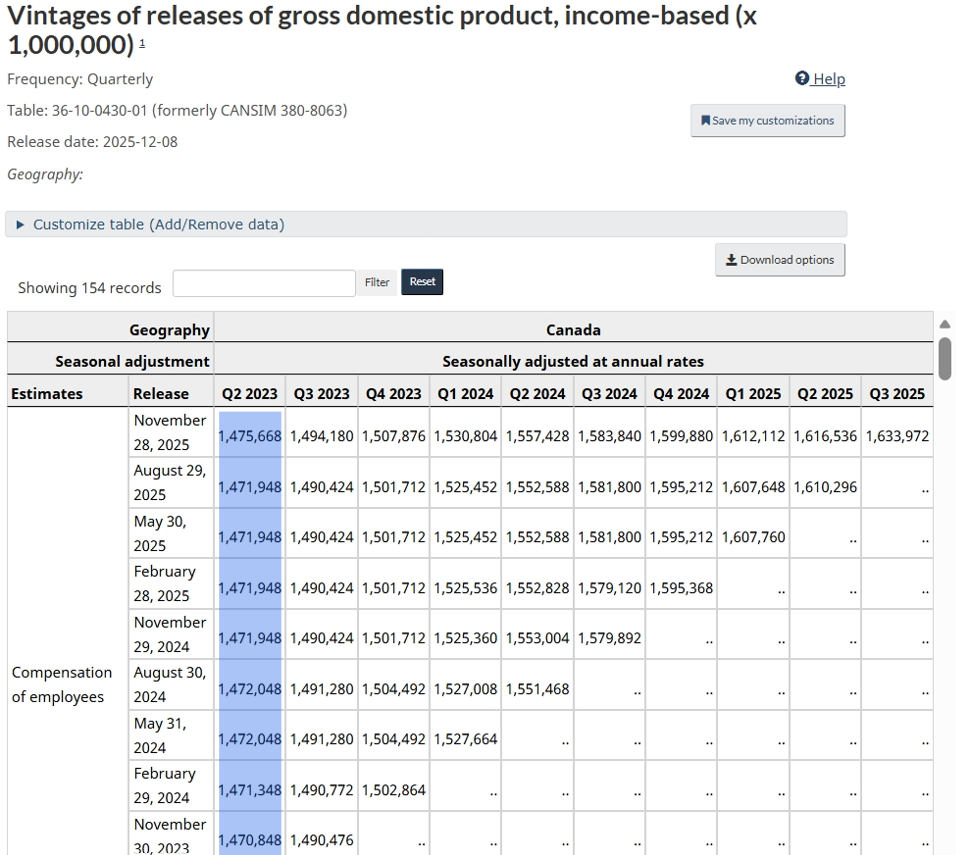
Description - Figure 3 - Gross Domestic Product, Real-time data, Q2, 2023
This is a real-time data table which shows all revisions of a specific data point over time. On the horizontal axis, the columns indicate calendar years. Each year is subdivided into quarters. The rows of the vertical axis indicate the date data was released.
For each column, the last data point contains the initial data released for that year and quarter. Each subsequent cell above contains revised data for that year and quarter, with the revision date indicated in the corresponding vertical axis.
The data in the first column is circled to show all revisions for a specific quarter since its initial release, at the bottom of the column.
The initial estimate for each reference period is the last figure in each column.
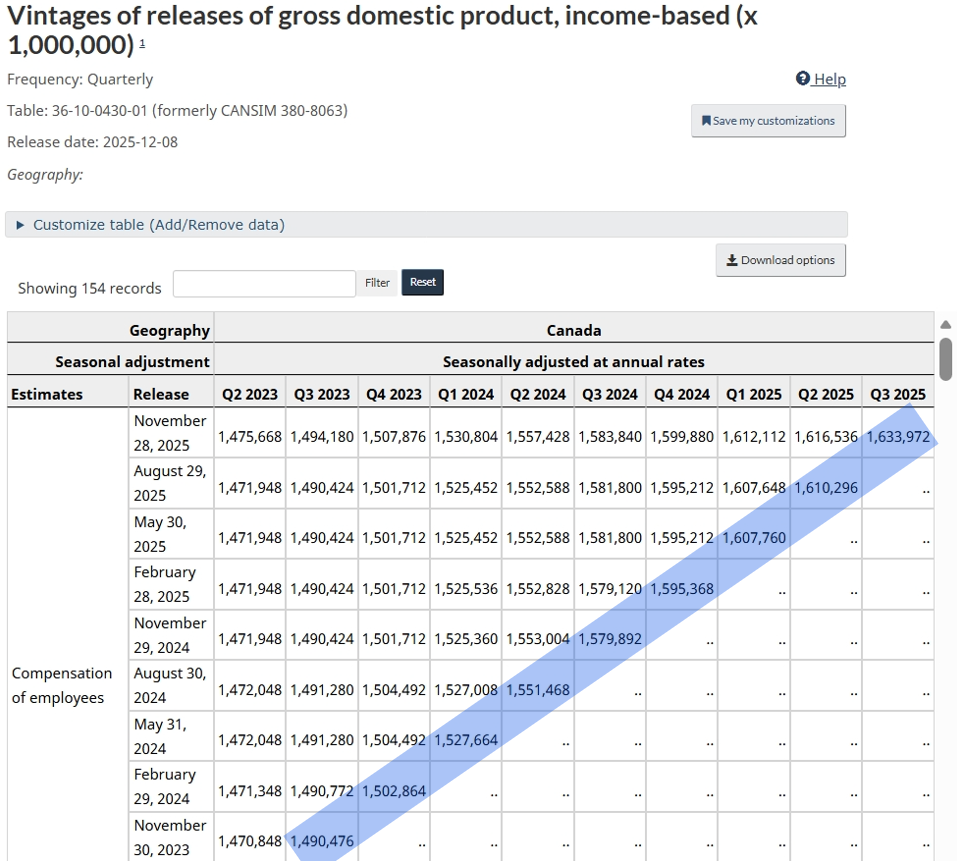
Description - Figure 4 - Gross Domestic Product, Real-time data, November 30, 2023 to 2025
This is a real-time data table which shows all revisions of a specific data point over time. On the horizontal axis, the columns indicate calendar years. Each year is subdivided into quarters. The rows of the vertical axis indicate the date data was released.
For each column, the last data point contains the initial data released for that year and quarter. Each subsequent cell above contains revised data for that year and quarter, with the revision date indicated in the corresponding vertical axis.
Finally, if users want to examine the time series as it appeared at a specific point in time, they must select the row associated with that date.
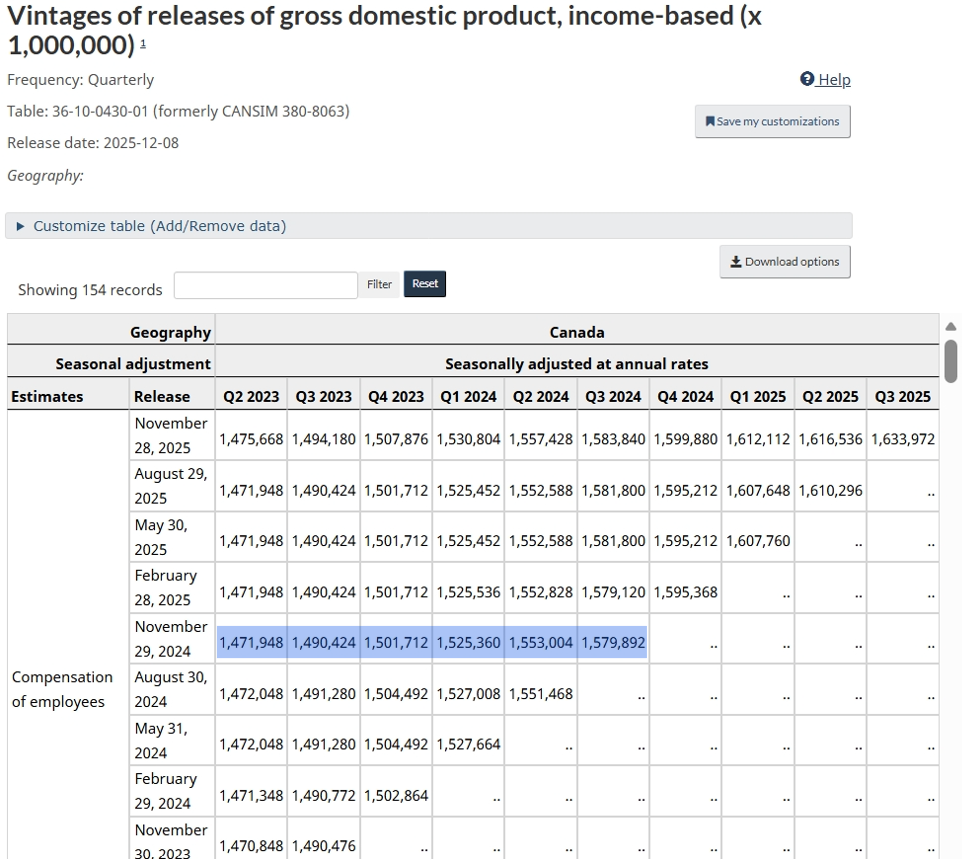
Description - Figure 5 - Gross Domestic Product, Real-time data, November 29, 2024
This is a real-time data table which shows all revisions of a specific data point over time. On the horizontal axis, the columns indicate calendar years. Each year is subdivided into quarters. The rows of the vertical axis indicate the date data was released.
For each column, the last data point contains the initial data released for that year and quarter. Each subsequent cell above contains revised data for that year and quarter, with the revision date indicated in the corresponding vertical axis.
In the middle of the table, a row is circled to illustrate how a time series appeared at a specific point in time.
The importance of footnotes and context
Nineteen real-time tables have been released to the public, and represent the majority of the key economic and social indicators produced by Statistics Canada. In most cases, revisions occur because the first vintages of estimates are based on incomplete information. As more up to date information becomes available, the data are revised. In some cases, revisions occur due to changes in concepts or methods. These types of revisions need to be analyzed differently than revisions made using updated information.
To help users in their analysis, the real-time tables will include detailed footnotes to provide context for the revisions. These footnotes should be used along with the data to understand how to interpret the various vintages. Specifically, users should exercise caution, since not taking the footnotes and other related metadata into consideration when using real-time data could lead to erroneous conclusions.