
Media
Media
Video Thumbnail


Strong data and evidence are crucial to good decision making. All parts of society—governments, businesses and individuals—count on high-quality, timely and detailed statistics to make decisions. Among its many applications, statistical information is used to draw electoral boundaries, determine international tariffs, inform trade negotiations, analyze economic performance, select sites for schools and public transportation, and support immigration policies and programs.
Statistics Canada produces data that help Canadians better understand their country—its population, resources, economy, society and culture. In Canada, providing statistics is a federal responsibility. As Canada's central statistical office, Statistics Canada is legislated to serve this function for the whole of Canada and each of the provinces and territories. The agency also conducts a census of the population and a census of agriculture every five years, providing a detailed picture of Canadian society. Statistics Canada operates under the authority of the Statistics Act and is committed to protecting the confidentiality of the information with which it is entrusted.
The agency promotes the quality and coherence of Canada's statistics through collaboration with international organizations, federal departments and agencies, and the provinces and territories. As a member of the United Nations Statistical Commission, the agency endorses the Fundamental Principles of Official Statistics, which help define what constitutes a good system of official statistics and what role that system should play in national governments.
The purpose of this survey is to collect information for producing national and provincial level estimates of potato production and value.
These estimates will be used to assess the economic health of the industry. Agricultural producers and industry analysts will work with this information to make production and marketing decisions, and government analysts will use it to develop agricultural policies in Canada.
Your information may also be used by Statistics Canada for other statistical and research purposes.
Your participation in this survey is required under the authority of the Statistics Act.
Authorization to collect this information
Data are collected under the authority of the Statistics Act, Revised Statutes of Canada, 1985, Chapter S-19.
Confidentiality
By law, Statistics Canada is prohibited from releasing any information it collects that could identify any person, business, or organization, unless consent has been given by the respondent, or as permitted by the Statistics Act. Statistics Canada will use the information from this survey for statistical purposes only.
Record linkages
To enhance the data from this survey and to reduce the reporting burden, Statistics Canada may combine the acquired data with information from other surveys or from administrative sources.
Data-sharing agreements
To reduce respondent burden, Statistics Canada has entered into data-sharing agreements with provincial and territorial statistical agencies and other government organizations, which have agreed to keep the data confidential and use them only for statistical purposes. Statistics Canada will only share data from this survey with those organizations that have demonstrated a requirement to use the data.
Section 11 of the Statistics Act provides for the sharing of information with provincial and territorial statistical agencies that meet certain conditions. These agencies must have the legislative authority to collect the same information, on a mandatory basis, and the legislation must provide substantially the same provisions for confidentiality and penalties for disclosure of confidential information as the Statistics Act. Because these agencies have the legal authority to compel businesses to provide the same information, consent is not requested and businesses may not object to the sharing of the data.
For this survey, there are Section 11 agreements with the provincial statistical agencies of Newfoundland and Labrador, Nova Scotia, New Brunswick, Quebec, Ontario, Manitoba, Saskatchewan, Alberta and British Columbia. The shared data will be limited to information pertaining to business establishments located within the jurisdiction of the respective province.
Section 12 of the Statistics Act provides for the sharing of information with federal, provincial or territorial government organizations.
Under Section 12, you may refuse to share your information with any of these organizations by writing a letter of objection to the Chief Statistician, specifying the organizations with which you do not want Statistics Canada to share your data and mailing it to the following address:
Chief Statistician of Canada
Statistics Canada
Attention of Director, Enterprise Statistics Division
150 Tunney's Pasture Driveway
Ottawa, Ontario
K1A 0T6
You may also contact us by email at statcan.esd-helpdesk-dse-bureaudedepannage.statcan@canada.ca or by fax at 613-951-6583.
For this survey, there is a Section 12 agreement with the Prince Edward Island Statistical agency.
For agreements with provincial and territorial government organizations, the shared data will be limited to information pertaining to business establishments located within the jurisdiction of the respective province or territory.
1. Verify or provide the business or organization's legal and operating name and correct where needed.
Note: Legal name modifications should only be done to correct a spelling error or typo.
Note: Press the help button (?) for additional information.
Legal Name
The legal name is one recognized by law, thus it is the name liable for pursuit or for debts incurred by the business or organization. In the case of a corporation, it is the legal name as fixed by its charter or the statute by which the corporation was created.
Modifications to the legal name should only be done to correct a spelling error or typo.
To indicate a legal name of another legal entity you should instead indicate it in question 3 by selecting 'Not currently operational' and then choosing the applicable reason and providing the legal name of this other entity along with any other requested information.
Operating Name
The operating name is a name the business or organization is commonly known as if different from its legal name. The operating name is synonymous with trade name.
Legal name
Operating name (if applicable)
2. Verify or provide the contact information of the designated business or organization contact person for this questionnaire and correct where needed.
Note: The designated contact person is the person who should receive this questionnaire. The designated contact person may not always be the one who actually completes the questionnaire.
First name
Last name
Title
Preferred language of communication
Mailing address (number and street)
City
Province, territory or state
Postal code or ZIP code
Country
Email address
Telephone number (including area code)
Example: 123-123-1212
Extension number (if applicable)
Fax number (including area code)
Example: 123-123-1212
3. Verify or provide the current operational status of the business or organization identified by the legal and operating name above.
4. Verify or provide the current main activity of the business or organization identified by the legal and operating name above.
Note: The described activity was assigned using the North American Industry Classification System (NAICS).
Note: Press the help button (?) for additional information, including a detailed description of this activity complete with example activities and any applicable exclusions.
This question verifies the business or organization's current main activity as classified by the North American Industry Classification System (NAICS). The North American Industry Classification System (NAICS) is an industry classification system developed by the statistical agencies of Canada, Mexico and the United States. Created against the background of the North American Free Trade Agreement, it is designed to provide common definitions of the industrial structure of the three countries and a common statistical framework to facilitate the analysis of the three economies. NAICS is based on supply-side or production-oriented principles, to ensure that industrial data, classified to NAICS, are suitable for the analysis of production-related issues such as industrial performance.
The target entity for which NAICS is designed are businesses and other organizations engaged in the production of goods and services. They include farms, incorporated and unincorporated businesses and government business enterprises. They also include government institutions and agencies engaged in the production of marketed and non-marketed services, as well as organizations such as professional associations and unions and charitable or non-profit organizations and the employees of households.
The associated NAICS should reflect those activities conducted by the business or organizational units targeted by this questionnaire only, as identified in the 'Answering this questionnaire' section and which can be identified by the specified legal and operating name. The main activity is the activity which most defines the targeted business or organization's main purpose or reason for existence. For a business or organization that is for-profit, it is normally the activity that generates the majority of the revenue for the entity.
The NAICS classification contains a limited number of activity classifications; the associated classification might be applicable for this business or organization even if it is not exactly how you would describe this business or organization's main activity.
Please note that any modifications to the main activity through your response to this question might not necessarily be reflected prior to the transmitting of subsequent questionnaires and as a result they may not contain this updated information.
The following is the detailed description including any applicable examples or exclusions for the classification currently associated with this business or organization.
Description and examples
Provide a brief but precise description of this business or organization's main activity
e.g., breakfast cereal manufacturing, shoe store, software development
5. You indicated that is not the current main activity.
Was this business or organization's main activity ever classified as: ?
6. Search and select the industry classification code that best corresponds to this business or organization's main activity.
How to search:
Select this business or organization's activity sector (optional)
Enter keywords or a brief description, then press the Search button
7. You have indicated that the current main activity of this business or organization is:
Main activity
Are there any other activities that contribute significantly (at least 10%) to this business or organization's revenue?
Provide a brief but precise description of this business or organization's secondary activity
e.g., breakfast cereal manufacturing, shoe store, software development
8. Approximately what percentage of this business or organization's revenue is generated by each of the following activities?
When precise figures are not available, provide your best estimates.
| Percentage of revenue | |
|---|---|
| Main activity | |
| Secondary activity | |
| All other activities | |
| Total percentage |
1. What was the total area of potatoes planted in (current year)
Report for the entire operation.
Report the area of potatoes planted on land owned or rented by all partners in the operation.
Planted area refers to an area of land that potatoes were planted on during the spring of the reference year.
Total area planted
Unit of measure
2. What was the total area of potatoes harvested in (current year)
Report for the entire operation.
Report the area of potatoes harvested on land owned or rented by all partners in the operation.
Total area harvested
Unit of measure
3. For the potatoes harvested in (current year) would you prefer to report the average yield or total production?
Yield is the measure of a crop produced from single unit of land area.
To calculate: yield = production / harvested area of land
For example, if you produced 2,500 cwt of potatoes on 10 acres of land, yield is 250 cwt per acre.
Production is the amount of crop produced from all harvested land area.
To calculate: production = yield * harvested area of land
For example, if you produced 250 cwt per acre of potatoes and harvested 10 acres, production would be 2,500 cwt.
4. What was the average field run yield of harvested potatoes?
Report yield based on the harvested area only.
Include all harvested potatoes, not just the marketable yield.
Average yield
Unit of measure per
5. What was the total field run production of harvested potatoes?
Report the total production for the operation.
Include all harvested potatoes, not just the marketable production.
Total production
Unit of measure
6. What percentage of your harvested crop do you expect to make grade?
Report the percentage that you expect to make grade for table, seed or processing as defined by the grading standard of the Canadian Food
Inspection Agency, your provincial grading standards or your processor.
Of the potatoes that were stored, the percentage that will be marketable are considered to 'make grade'.
For example: 100 pounds of potatoes were stored, however, only 90% of the potatoes will be marketable/make grade.
Report: 90%
Percentage
7. Which of the following agricultural products are currently being produced on this operation?
Select all that apply.
8. What area of this operation is used for the following crops?
Report the areas only once, even if used for more than one crop type.
Exclude land used by others.
| Area | Unit of measure | |
|---|---|---|
| Field crops | ||
| Hay | ||
| Summerfallow | ||
| Potatoes | ||
| Fruit, berries and nuts | ||
| Vegetables | ||
| Sod | ||
| Nursery products | ||
List of unit measures
|
||
9. What is the total area under glass, plastic or other protection used for growing plants?
Total area
Unit of measure
10. How many of the following animals are on this operation?
Report all animals on this operation, regardless of ownership, including those that are boarded, custom-fed or fed under contract.
Include all animals kept by this operation, regardless of ownership, that are pastured on a community pasture, grazing co-op or public land.
Exclude animals owned but kept on a farm, ranch or feedlot operated by someone else.
| Number | |
|---|---|
| Cattle and calves | |
| Pigs | |
| Sheep and lambs | |
| Mink | |
| Fox |
11. How many of the following birds are on this operation?
Report all poultry on this operation, regardless of ownership, including those grown under contract.
Include poultry for sale and poultry for personal use.
Exclude poultry owned but kept on an operation operated by someone else.
| Number | |
|---|---|
| Hens and chickens | |
| Turkeys |
12. What was the total number of taps made on maple trees last spring?
Total number of taps
13. How many live colonies of honey bees (used for honey production or pollination) are owned by this operation?
Include bees owned, regardless of location.
Number of colonies
14. What is the total mushroom growing area (standing footage) on this operation?
Include mushrooms grown using beds, trays, tunnels or logs.
Total area
Unit of measure
1. Indicate any changes or events that affected the reported values for this business or organization, compared with the last reporting period.
Select all that apply.
1. Statistics Canada may need to contact the person who completed this questionnaire for further information.
Is Provided Given Names, Provided Family Name the best person to contact?
Who is the best person to contact about this questionnaire?
First name:
Last name:
Title:
Email address:
Telephone number (including area code):
Extension number (if applicable):
Fax number (including area code):
1. How long did it take to complete this questionnaire?
Include the time spent gathering the necessary information.
Hours:
Minutes:
2. Do you have any comments about this questionnaire?
| Geography | Month |
|---|---|
| 202108 | |
| % | |
| Canada | 0.6 |
| Newfoundland and Labrador | 1.3 |
| Prince Edward Island | 1.0 |
| Nova Scotia | 1.8 |
| New Brunswick | 2.1 |
| Quebec | 1.2 |
| Ontario | 1.2 |
| Manitoba | 1.1 |
| Saskatchewan | 2.4 |
| Alberta | 1.0 |
| British Columbia | 1.3 |
| Yukon Territory | 2.1 |
| Northwest Territories | 0.8 |
| Nunavut | 1.3 |
Date: September 2021
Program manager:
Personal information collected through the Pilot Study on Everyday Well-being using the Experience Sampling Method is described in Statistics Canada's "Special Surveys" Personal Information Bank. The Personal Information Bank refers to information collected through Statistics Canada's ad hoc surveys, which do not form part of the regular survey taking activity of the Agency. They cover a variety of socio-economic topics including health, housing, labour market, education and literacy, as well as demographic data.
The "Special Surveys" Personal Information Bank (Bank number: StatCan PPU 026) is published on the Statistics Canada website under the latest Information about Programs and Information Holdings chapter.
In partnership with Canadian Heritage and the Canada Council for the Arts, Statistics CanadaFootnote 1 is conducting, under the authority of the Statistics Act , a voluntary pilot study on well-being using a short-term longitudinal collection method entitled "Experience Sampling Method" (ESM). ESM is a data collection technique where respondents are prompted to respond to a questionnaire multiple times throughout the day, and typically for multiple days. This allows for the collection of in-the-moment data on the activities of participants. It is used to measure what people do, feel and think during their daily lives. The use of the ESM for the Pilot Study on Everyday Well-being will allow respondents to provide their subjective assessment of their own well-being in real-time rather than retrospectively, and will facilitate the measurement of the effect on well-being of participation in various activities, particularly culture activities, which is the main focus of this pilot.
While ESM was developed in the 1990s, and was included in the Organisation for Economic Co-operation and Development's (OECD) 2013 Guidelines for Measuring Subjective Well-Being as a gold standard for measuring affective components of personal well-being, costs and logistical challenges have prevented its widespread use. To address this impediment, Statistics Canada has developed a mobile application (called Vitali-T-Stat) that will prompt respondents and direct them to Statistics Canada's secure collection infrastructure and the Pilot Study on Everyday Well-being questionnaire. The mobile application will not be collecting any personal information itself. It will only provide respondents with information on the study and will allow them to customize the prompting settings, such as the number of daily-prompts they wish to receive and the time of day when these prompts are sent. They can also choose to opt-out of the study at any time. The risks associated with the mobile application have been assessed in a specific Privacy Impact Assessment (PIA).
This pilot study is comprised of two phases. The first phase is a test of the questionnaire and application with 100 employees of Statistics Canada, Canadian Heritage and the Canada Council for the Arts. Employees will voluntarily provide their e-mail accounts associated with their personal devices and will then receive an official invitation from Statistics Canada to test the questionnaire and application for seven days. At the end they will be asked to answer a short set of feedback questions. Answers to these feedback questions will inform final improvements to the questionnaire and application before the second phase.
The second phase is a pilot collection, where voluntary participation will be sought in three ways. First, Statistics Canada will send an invitation letter, including a secure access code (see Appendix A) to respondents from a probabilistic sample. This letter will contain instructions for downloading the application and will include a brochure about the study and the mobile application (see Appendix B). Second, a two-pronged crowdsourcing campaign will start two weeks after the probabilistic sample receives their invitations. Electronic outreach materials and messages prepared by Statistics Canada will be forwarded by Canadian Heritage and the Canada Council for the Arts via e-mail to a range of organizations from the culture sector; these will include a common code indicating the invitation was sent from the culture sector (see Appendix C). The general public will also be invited to participate via a Statistics Canada outreach and social media campaign, without any codes. Respondents will be informed that entering a code is optional and that it will serve to assess response rates for the different types of invitations. The code will not identify specific individuals, only the collection group. This will allow Statistics Canada to better understand which invitation method to participate in this type of survey is more efficient.
If they choose to participate in the survey, respondents will be instructed to download the app from Google Play or the Apple Store, select "Start" then read the Terms and Conditions of the survey. If they accept the Terms and Conditions, participants will be directed to the survey questionnaire housed on Statistics Canada's secure anonymous collection portal. Respondents will be informed that they can stop participating in the survey or remove the app from their mobile devices at any time, and they will be provided with instructions on how to do so. This information will be included in the invitation letter and accompanying brochure and will be available on Statistics Canada's website.
Once they have left the application and entered Statistics Canada's secure anonymous collection portal, respondents will be asked to complete a short one-time preliminary questionnaire that will collect demographic information that will help Statistics Canada assess what factors could impact well-being. These questions are mostly drawn from standard questions used regularly by Statistics Canada. Some were developed specifically for this survey but were tested by Statistics Canada to ensure that they comply with the high standards of the Agency in regards to clarity, necessity and proportionality.
The one-time preliminary questionnaire includes:
Respondents will then receive random notifications between two and five times per day according to their settings preference, during a 30-day period, inviting them to respond to a short questionnaire comprised of 8 questions (respondents can also choose not to receive notifications and can respond at times of their choosing):
Throughout the data collection period, respondents will be able to view a personal dashboard in the mobile app displaying regularly updated graphs of their own cumulative responses to the survey. In addition to improving response rates, the practice of providing respondents with dashboards of their responses in the context of other surveys has shown to be generally appreciated. The graphs only include cumulative averages of the individual's responses to the five questions on how they were feeling, and on their feelings related to what they were doing, where they were and who they were with. They do not contain any individual responses to the survey, or any responses from other individuals. The dashboard graphs are generated on Statistics Canada servers each time a respondent submits answers to the eight short questions. Then an image of the graph is securely transmitted to the app on that respondent's mobile device (see Appendix D) where it can be viewed. The graphs remain stored on Statistics Canada secure servers.
The dashboard graphs are not accessible on screen readers. A note is included in the dashboard description that advises respondents who use these technologies to contact Statistics Canada in order to set up a unique secure Electronic File Transfer (EFT) account for them to receive their dashboard. These respondents will receive an email from Statistics Canada providing them with an account name and a one-time password that they must change at first log on. Once these credentials are established with the respondent, their survey responses as presented in the dashboard can be securely exchanged between Statistics Canada and the respondent.
While Statistics Canada's Generic Privacy Impact Assessment (PIA) addresses most of the privacy and security risks related to statistical activities conducted by Statistics Canada, this supplement describes additional measures (see Mitigation factors) being implemented to manage respondent burden associated with the use of the Experience Sampling Method (ESM) by way of the mobile application, and to limit intrusiveness. It also demonstrates the necessity and proportionality related to the collection of this personal information. As is the case with all PIAs, Statistics Canada's privacy framework ensures that elements of privacy protection and privacy controls are documented and applied.
The collection and use of personal information for the Experience Sampling Method (ESM) and the Pilot Study on Everyday Well-being can be justified against Statistics Canada's Necessity and Proportionality Framework:
The Pilot Study on Everyday Well-Being seeks to fill a gap in quality national and regional estimates of subjective well-being in-the-moment, and complements existing data holdings on subjective well-being. Data on how individuals feel while partaking in particular activities offers the possibility to assess potential impacts of various activities on individuals' well-being, and in the context of this pilot, particularly on the impacts of participating in culture programs. The results can inform governments' decisions regarding publicly-funded cultural and other programs that contribute to Canadians' well-being.
TThis pilot will also assess the viability of using a mobile application as an alternative to diary-based collection. Diary-based collection consists in asking respondents to record detailed information about their everyday lives in a log, diary or journal regarding the activity or experience being studied, for example on their use of time or household spending. When carried out using telephone or web-based collection modes, it creates significant burden for respondents, which can be alleviated through the use of a mobile application that redirects them to Statistics Canada's secure anonymous collection portal.
The Pilot Study on Everyday Well-being allows for the collection of in-the-moment affect data. This eliminates the need for respondents to remember and report on activities after they have occurred, and the risk of respondents not remembering correctly, thus improving data quality. While data collection occurs over a 30-day period, the short questionnaire length and repeated content will result in a lower cognitive load and burden.
The probabilistic sample to which an invitation letter will be sent is comprised of 50,000 households, representative of existing households in Canada. This sample size was determined based on various demonstrated methodological considerations such as the absence of follow-up for non-respondents, and the coverage limitations of the mobile app, given that not every household has a mobile device that will function with the mobile application. Most importantly, this sample size is necessary to ensure a sufficient number of respondents will provide responses regarding participation in culture activities, which is a key focus of this pilot. The survey design eliminates the need to send follow-up verifications to ensure the correct respondent is participating. In addition, the survey design ensures households easily understand which member is being asked to participate. This approach reduces the number and type of questions that need to be asked, while still enabling Statistics Canada to carry out proper methodological validation and analysis of the pilot results.
Proportionality has also been considered based on data sensitivity and ethics:
Collecting in-the-moment data is a data collection methodology that has been in existence for some time but has limitations if done without the use of a mobile application. Alternative ways of contacting respondents and collecting in-the-moment data include either sending them randomly pre-established schedules and asking them to log into Statistics Canada's secure collection infrastructure to complete the survey at those specific times, or calling them at random times to collect the data by phone. These alternatives are inconvenient and more intrusive. Another alternative is to use a diary-based collection method where respondents are asked to think back and report on how they were feeling at certain times throughout the day, in combination with what they were doing, where they were and who they were with at that time. This methodology is burdensome as respondents need to carry the diary with them, and it introduces the risk of them not accurately recalling where they were and how they felt. The information regarding where respondents are could also be collected through sensors on participants' phones such as location, but this is deemed to be disproportionately intrusive. The method being used in this pilot aims to give respondents full control over their participation, to minimize burden, and obtain the most accurate sense of their well-being.
While privacy risks are deemed manageable with existing Statistics Canada safeguards associated with its secure collection environment and mobile application, the following additional mitigation measures were implemented to manage respondent burden associated with the use of the Experience Sampling Method (ESM) by way of the mobile application, and to limit intrusiveness:
The questions pertaining to the impact of COVID-19 on mental health and on the ability to meet financial obligations or essential needs could be considered sensitive and could lead some respondents to experience various levels of distress. The overall risk of harm to the survey respondents has been deemed manageable with existing Statistics Canada safeguards as well as with the following measures:
This assessment concludes that, with the existing Statistics Canada safeguards and additional mitigation factors listed above, any remaining risks are such that Statistics Canada is prepared to accept and manage the risk.
This Supplementary Privacy Impact Assessment has been reviewed and recommended for approval by Statistics Canada's Chief Privacy Officer, Director General for Modern Statistical Methods and Data Science, and Assistant Chief Statistician for Social, Health and Labour Statistics.
The Chief Statistician of Canada has the authority for section 10 of the Privacy Act for Statistics Canada, and is responsible for the Agency's operations, including the program area mentioned in this Supplementary Privacy Impact Assessment.
This Privacy Impact Assessment has been approved by the Chief Statistician of Canada.
This is provided as an example; the version sent to respondents might be slightly different.
Dear household member:
Your household has been selected to participate in the Pilot Study on Everyday Well-being, an innovative pilot study that uses Statistics Canada's Vitali-T-Stat app to ask questions about your emotions throughout the day.
This pilot study asks Canadians in-the-moment questions about their activities and feelings. Our goal is to gain a better understanding of the factors that influence well-being, particularly arts and culture activities, which are the main focus of this pilot. This initiative is in collaboration with Canada Council for the Arts and Canadian Heritage. The data will provide insight on the connections between activities and well-being, and could be used to develop programs that enhance people's lives.
Although voluntary, your participation is appreciated and will help ensure we gather accurate information about the well-being of Canadians.
After you set up the app, for the next 30 days you'll receive two notifications daily to answer a few questions about what you are doing and how you are feeling in that moment. If you like, you can increase the notifications up to five per day.
This survey is conducted under the authority of the Statistics Act, which ensures that the information you provide will be kept confidential, and used only for statistical and research purposes.
Visit Pilot Study on Everyday Well-Being, or contact us Monday to Friday (except holidays), from 8:00 a.m. to 7:00 p.m. (Eastern Time):
*If you use an operator-assisted relay service, you can call us during regular business hours. You do not need to authorize the operator to contact us.
Thank you,
This is provided as an example; the version sent to respondents may be slightly different.
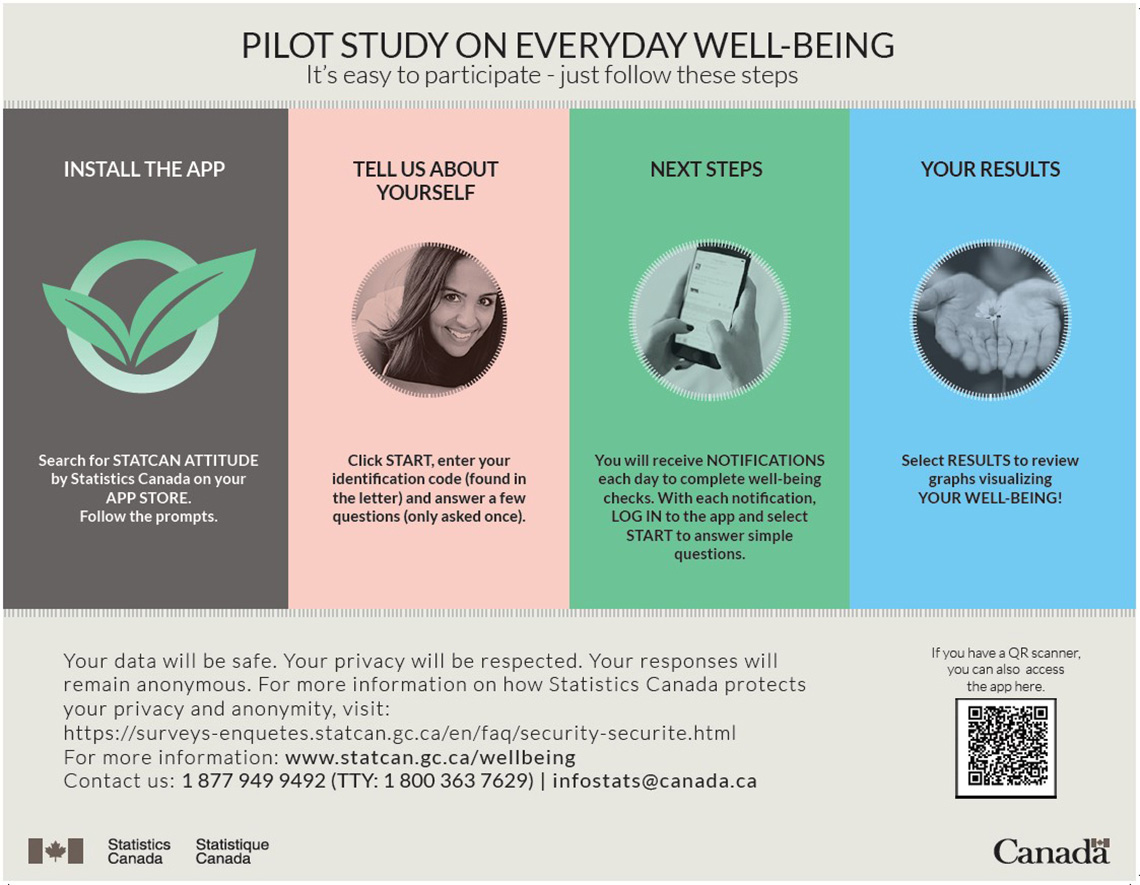
PILOT STUDY ON EVERYDAY WELL-BEING
It's easy to participate – just follow these steps
INSTALL THE APP
Search for STATCAN ATTITUDE by Statistics Canada on your APP STORE. Follow the prompts.
TELL US ABOUT YOURSELF
Click START, enter your identification code (found in the letter) and answer a few questions (only asked once).
NEXT STEPS
You will receive NOTIFICATIONS each day to complete well-being checks. With each notification, LOG IN to the app and select START to answer simple questions.
YOUR RESULTS
Select RESULTS to review graphs visualizing YOUR WELL_BEING!
Your data will be safe. Your privacy will be respected. Your responses will remain anonymous. For more information on how Statistics Canada protects your privacy and anonymity, visit:
Security
For more information: Pilot Study on Everyday Well-Being
Contact us: 1 877 949 9492 (TTY: 1 800 363 7629) / infostats@canada.ca
This is provided as an example; the version sent to respondents may be slightly different.
SUBJECT/OBJET: Invitation to participate in Statistic Canada's app-based project: Pilot Study on Everyday Well-being / (Le français suit.)
Dear xxx:
Your household is being invited to participate in the Pilot Study on Everyday Well-being,an innovative pilot study that uses Statistics Canada's Vitali-T-Statapp to ask questions about your emotions throughout the day.
This pilot study asks Canadians in-the-moment questions about their activities and feelings. Our goal is to gain a better understanding of the factors that influence well-being, particularly arts and culture activities, which are the main focus of this pilot. This initiative is in collaboration with Canada Council for the Arts and Canadian Heritage. The data will provide insight on the connections between activities and well-being, and could be used to develop programs that enhance people's lives.
Although voluntary, your participation is appreciated and will help ensure we gather accurate information about the well-being of Canadians.
After you set up the app, for the next 30 days you'll receive two notifications daily to answer a few questions about what you are doing and how you are feeling in that moment. If you like, you can increase the notifications up to five per day.
This survey is conducted under the authority of the Statistics Act, which ensures that the information you provide will be kept confidential, and used only for statistical and research purposes.
Visit Pilot Study on Everyday Well-Being, or contact us Monday to Friday (except holidays), from 8:00 a.m. to 7:00 p.m. (Eastern Time):
*If you use an operator-assisted relay service, you can call us during regular business hours. You do not need to authorize the operator to contact us.
Thank you,
Signature
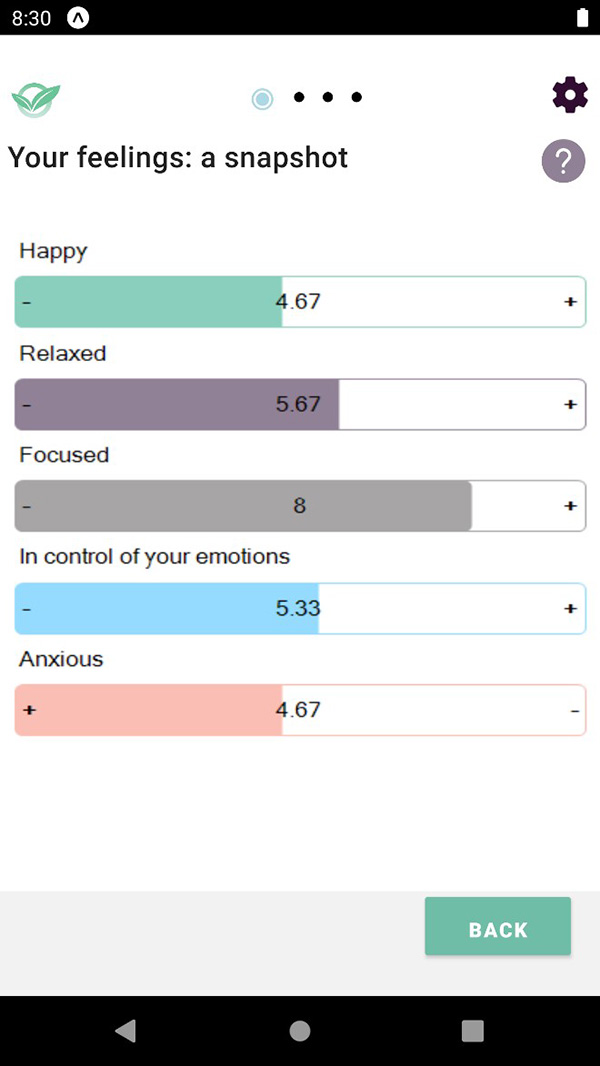
Graph showing average on scale of 1 to 10
Happy
Relaxed
Focused
In control of your emotions
Anxious
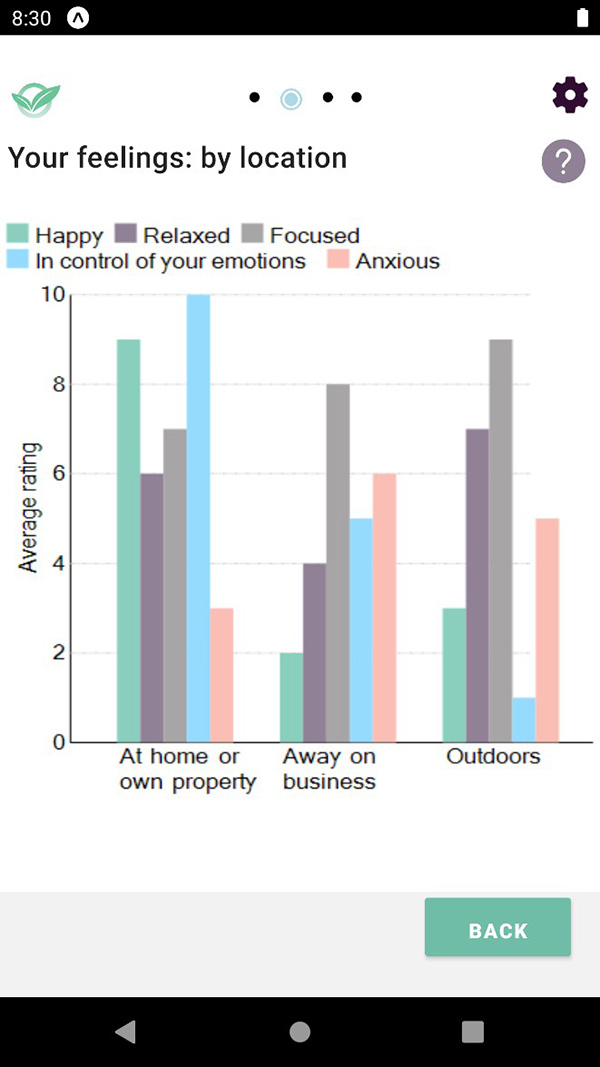
Graph showing average rating on scale of 1 to 10 of
How Happy, Relaxed, Focused, In control of your emotions, Anxious
When At home or own property, Away on business, Outdoors
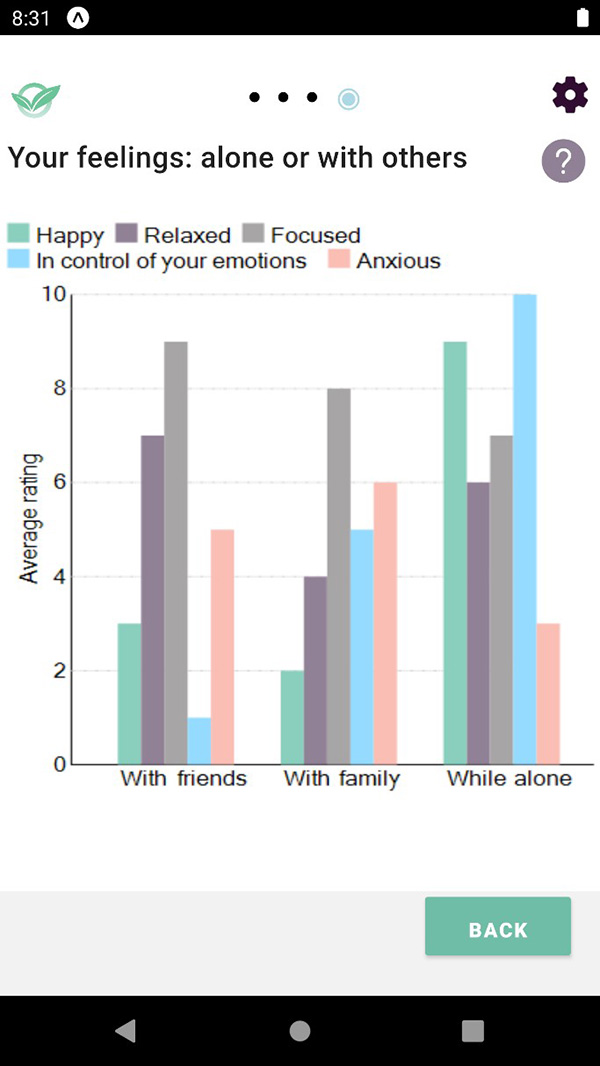
Graph showing average rating on scale of 1 to 10 of
How Happy, Relaxed, Focused, In control of your emotions, Anxious
When With friends, With family, While alone
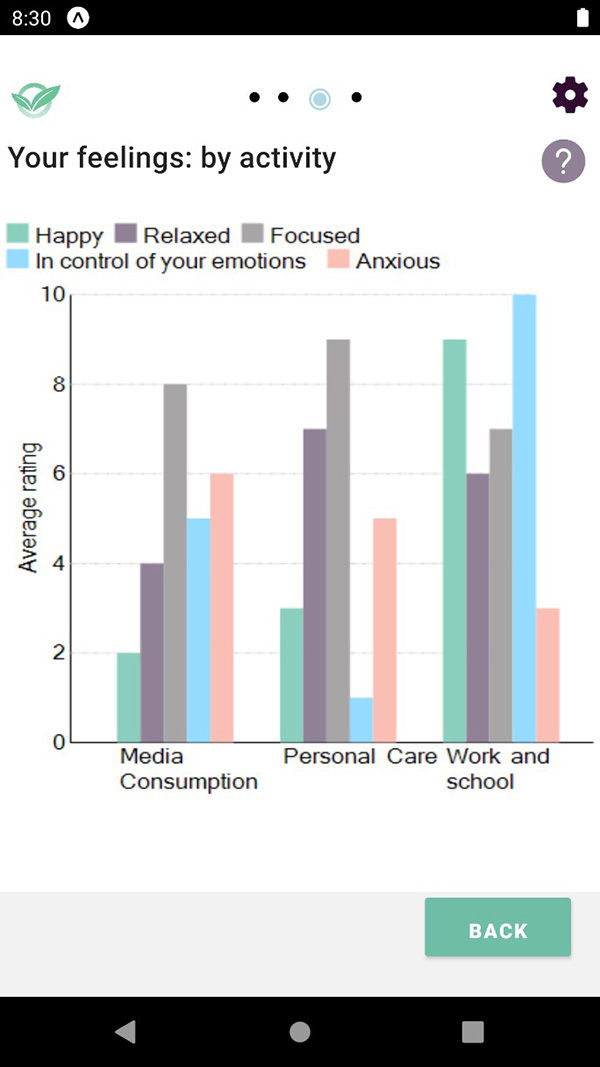
Graph showing average rating on scale of 1 to 10 of
How Happy, Relaxed, Focused, In control of your emotions, Anxious
When doing Media Consumption, Personal Care, Work and school
The Canadian Vital Statistics Death (CVSD) database is the authoritative source for cause of death data in Canada. Statistics Canada collaborates with partners at the federal, provincial and territorial levels to provide Canadians with timely data insights on deaths and mortality in Canada. To respond to emergent data needs in the wake of the COVID-19 pandemic, Statistics Canada has begun providing new, provisional estimates on excess deaths and mortality.
To learn more about our data sources, methods and other important information, please explore the answers to some frequently asked questions below.
Canada's national vital statistics system is a complex and decentralized system, based on collaboration between provincial/territorial vital statistics registrars and Statistics Canada.
The Vital Statistics Registry in each province and territory registers all deaths occurring in their province and transmits the information to Statistics Canada. The form for the registration of a death consists of personal information, supplied to the funeral director by an informant (next of kin), and the medical certificate of cause of death, completed by the medical practitioner last in attendance, or by a coroner/ medical examiner.
Provincial and territorial vital statistics agencies share the information they collected through their death registration processes with Statistics Canada, where it is compiled in the Canadian Vital Statistics Deaths (CVSD) database.
The Canadian Vital Statistics system operates under an agreement between the Government of Canada and governments of the provinces and territories. The Vital Statistics Council for Canada is an advisory committee composed of representatives from the provincial and territorial vital statistics offices and Statistics Canada, that oversees the policy and operational matters associated with the collection of vital statistics information.
More information on the data sources for the Canadian Vital Statistics – Death Database is available on the Statistics Canada website.
Statistics Canada's ability to provide timely information depends on receiving information from the provinces and territories.
The Provincial or Territorial Vital Statistics office submits data to Statistics Canada in 2 steps: the fact of death and the images of the death certificate, which are used to code the causes of death. Typically, the death event (fact of death) will be registered in the system first. For several jurisdictions, this death information is typically sent within 30 days of the death event, while for others it is sent 30 to 60 days, or more, following the death event. There may be a further delay in Statistics Canada's receipt of cause of death information – particularly with unnatural deaths that warrant medical investigation or autopsy.
Provisional death counts and causes of death do not include all deaths occurring in the reference period due to reporting delays. Provisional death estimates are adjusted to account for the incomplete nature of the counts, where possible. These adjustments add to the counts to incorporate deaths not yet reported to Statistics Canada, based on past and current provincial and territorial reporting patterns. The provisional estimates are revised in future releases as more information is reported.
More information on the data sources and methodology for the Canadian Vital Statistics – Death Database is available on the Statistics Canada website.
The provisional deaths database contains the following information for each death occurring in Canada:
There are two interactive tools and four data tables that present the most recently-release provisional data from the Canadian Vital Statistics – Death Database.
In order to better understand the impacts of the pandemic on Canadian families and communities, Statistics Canada has adopted, and continues to adopt, new ways to meet the need for more timely information. As a result, the provisional Canadian Vital Statistics Deaths database is released on a monthly basis for reporting provinces and territories.
Please consult Statistics Canada's The Daily release schedule for scheduled dates of release.
The quality of the weekly adjusted counts is largely contingent on the level of completeness of the data, that is, the extent to which all deaths have been reported to Statistics Canada. Missing estimates are more likely for the weeks most recent to the release date, as there is sometimes a lag in reporting. As the information is submitted to Statistics Canada, the data become more complete for subsequent releases.
Only estimates for weeks where the level of completeness reaches 75% or more are shown. This threshold offers a compromise between the robustness and the timeliness of estimates. The level of completeness reaches 90% or more for almost all weeks, with a few exceptions. Although useful to signal potential new recent trends in regard to excess mortality, estimates based on weekly data with a lower level of completeness should be used with caution as they carry more uncertainty and are more sensitive to model assumptions (such as the choice of the reference period). Consequently, these estimates are subject to change noticeably in subsequent releases as the number of reported deaths increase for these weeks.
Statistics Canada receives information from the provinces and territories on a continuous basis. The provisional data and estimates are updated on a monthly basis with the addition of new weeks of data and revisions to those weeks for which data have previously been released.
In order to provide more up-to-date information on deaths during the pandemic, recent improvements in methodology and timeliness have been made to our data collection process. As a result, the provisional death counts for the 2020 and 2021 reference years have been adjusted to account for reporting delays, where possible, that would otherwise result in under-coverage within the data. These adjustments add to the counts to incorporate deaths not yet reported to Statistics Canada, based on past provincial and territorial reporting patterns.
During the production of each month's death statistics, data from previous months/years may be revised to reflect any updates or changes that have been received from the provincial and territorial vital statistics offices.
Data from the 2017, 2018, and 2019 reference years are also preliminary, as updates from the vital statistics offices are also recorded.
More information on the data sources and methodology for the Canadian Vital Statistics – Death Database is available on the Statistics Canada website.
Statistics Canada's capacity to provide useful and timely information is dependent on its ability to receive the information from the provinces and territories. For several jurisdictions this information is typically sent within 30 days of the death event, while for others it is sent 30 to 60 or more days following the death event. For this reason, data for certain provinces and territories for certain weeks are suppressed.
The data that are released each month by Statistics Canada are based on the data that are reported by the provincial and territorial vital statistics registries, which are the official source for death statistics in Canada. Statistics Canada adjusts the counts to account for reporting delays. Cause of death information within the Canadian Vital Statistics Deaths (CVSD) database is obtained from the medical certificate of cause of death, which is completed by medical professionals, coroners, or medical examiners.
Data produced by other sources may be collected for surveillance purposes from other organizations, such as the provincial and territorial health authorities or media outlets. These data may be based on confirmed cases of the virus causing COVID-19 only, which means that the data may not always include cases where someone died of COVID-19 before getting tested. In addition, surveillance figures may be based on the date that the death was reported, rather than the date that the death occurred. Lastly, these figures may use cause of death definitions that differ from those applied by the Vital Statistics agencies and registrars using guidelines from the International Classification of Diseases.
From January to August 2020, the official death counts from COVID-19 across Canada were about 5% higher than the surveillance figures for the same period.
The more recent reference periods contain a higher number of provisional causes of death that are unknown or pending investigation. Some deaths, such as possible suicides, or accidental deaths require lengthy investigations. What this means is that Statistics Canada has yet to receive definitive cause of death information from the provincial and territorial vital statistics agencies, due to outstanding medical investigations into the decedents' cause of death.
When the number of unknowns is high in these data, the provisional cause of death data should not be used to report on the leading causes of death until the data become more complete.
Depending upon the analyses conducted, the cause of death information may contain small counts, which makes it necessary to protect confidentiality through a standard rounding process for the cause of death variable. Only the cause of death information is rounded; rounding is conducted to the base 5. This means that all cause of death information is presented in units of 5 or 10 (e.g., 0, 5, 10, 15, etc.).
Due to the provisional nature of the data, the frequency of provincial and territorial updates of the data, as well as the cause of death rounding practice, more variability may be observed among the cause of death variable – compared to the rest of variables in the database – between monthly releases.
COVID-19 continues to affect communities and families in Canada and across the world. Beyond deaths attributed to the disease itself, the pandemic could also have indirect consequences that increase or decrease the number of deaths as a result of various factors, including delayed medical procedures or increased substance use.
To understand both the direct and indirect consequences of the pandemic, it is important to measure excess mortality.
Excess mortality occurs when there are more deaths during a period of time than what would be expected for that period. It should be noted that, even without a pandemic, there is always some year-to-year variation in the number of people who die in a given week. This means that the number of expected deaths should fall within a certain range of values. There is evidence of excess mortality when weekly deaths are consistently higher than the number expected, but especially when they exceed the range of what would be expected over consecutive weeks.
Measuring excess mortality requires some way to determine the number of deaths that would be expected if there wasn't a pandemic. There are a number of ways to estimate expected deaths, including comparisons with previous yearly counts or using historical averages—for example, over the previous four years. In the Canadian context, with an aging and growing population, the number of deaths has been steadily increasing over recent years, and so a higher number of deaths would be expected in 2020 (or 2021) regardless of COVID-19. For these reasons, Statistics Canada is using an approach that has also been adopted by other countries to estimate expected deaths, using a statistical model to project forward recent trends in mortality.
More information on estimating excess mortality during the COVID-19 pandemic in Canada is available in the article Excess mortality in Canada during the COVID-19 pandemic.
Under the authority of the Statistics ActFootnote 1, Statistics Canada is developing and implementing a mobile application as a new method to invite respondents to access the agency’s secure survey collection infrastructure and complete a survey. The application itself does not collect any personal information; it simply prompts respondents and points them to the secure collection environment housed at Statistics Canada where they complete the survey questionnaire. It will first be used in the context of the longitudinal Pilot Study on Everyday Well-being which will collect data on the well-being of Canadians, and for which a separate supplement to Statistics Canada’s Generic PIA supplement was developed.
A privacy impact assessment (PIA) for the Vitali-T-Stat Mobile Application was conducted to determine if there were any privacy, confidentiality or security issues with this initiative and, if so, to make recommendations for their resolution or mitigation.
The application will be hosted on the Google Play and Apple App stores, and this first iteration will be named Vitali-T-Stat.
Canadians will be invited to participate in the voluntary longitudinal study and given instructions on how to download the application. The mobile application is a hybrid application which means that it includes a native component that is stored and operates on a mobile device, and links to web-based components that are stored on a web portal and accessed through a web browser.
The native component of the application enables a person to download the application from an app store and store it on their device, secure it with a password and a security question, and receive notifications to participate in the study. It also contains Getting Started information specific to the Pilot Study on Everyday Well-being, Terms and Conditions for using the application, contact information for Statistics Canada, Frequently Asked Questions for using the application, and a settings menu. Within the settings menu, the respondent can customize their notification settings.
The application links to two web-based components that require the respondent to be connected to data or Wi-Fi while in use:
When the respondent selects either of these components, an Application Programming Interface (API) will be activated. An API is a software intermediary which allows two applications to talk to each other through a secure channel. The API will authorize access to Statistic’s Canada secure collection web portal through the API connection, and will present the respondent with the questionnaire if they select START, or their personalized data dashboard if they select Results. The questionnaire and the dashboard are presented within the application, but they both remain stored on Statistics Canada secure web portals where the information will reside.
The PIA identifies the level of potential risk (level 1 is the lowest level of potential risk and level 4 is the highest) associated with the following risk areas:
Program or activity that does not involve a decision about an identifiable individual.
Risk scale: 1
Not-applicable. The Vitali-T-Stat mobile application does not collect or handle any personal information. The survey itself is collected on Statistics Canada’s secure collection infrastructure which is assessed in Statistics Canada’s Generic Privacy Impact Assessment.
Risk scale: N/A
Private sector organizations, international organizations or foreign governments.
Risk scale: 4
Short-term program or activity.
Risk scale: 2
Not-applicable. The Vitali-T-Stat mobile application does not collect or handle any personal information. The survey itself is collected on Statistics Canada’s secure collection infrastructure for statistical purposes, under the authority of the Statistics Act.
Risk scale: N/A
Not-applicable. The Vitali-T-Stat mobile application does not collect or transmit any personal information. The survey itself is collected on Statistics Canada’s secure collection infrastructure for statistical purposes, under the authority of the Statistics Act.
Risk scale: N/A
This application has been developed as a new way for respondents to access the agency’s existing secure survey collection infrastructure. After respondents select the START menu item in the application, they will be redirected with an Application Programming Interface (API - a software intermediary which allows two applications to talk to each other through a secure channel) to Statistics Canada’s secure anonymous collection portal, where the respondent will complete and submit their questionnaire(s). This secure portal is entirely autonomous from the application.
The mobile hybrid application does not create, collect or handle any personal information.
A unique identifier will be generated by the application when the respondent installs it. This unique identifier will be sent to Statistics Canada’s server when the respondent submits their questionnaire data. This will enable Statistics Canada to complete record linkages both to populate the respondent’s results dashboard, as well as for analytical purposes. To populate the results dashboard, the unique identifier will be sent with the questionnaire responses to Statistics Canada’s secure server. The server will then create a secure access code (SAC) and assign it to the unique identifier. The questionnaire data will then be released to a secure Statistics Canada web portal. When the respondent selects the results dashboard in the application, the unique identifier in the respondent’s application will be validated against the SAC on the secure web portal. If the validation is successful, a static image of aggregate results specific to the respondent will be presented. If the validation is not successful, the dashboard will remain blank.
Statistics Canada’s Collection Management Portal was modified to enable the generation of the SAC, process the respondent’s data, generate a static image presenting the respondent’s aggregate individual dashboard, and complete the validation to release the image back to the respondent.
In addition, minor modifications were made to present the electronic questionnaire, accessible from Statistics Canada’s secure collection web portal, in a mobile application-friendly look and feel. These modifications were cosmetic and did not impact functionality.
There is a very low risk of personal information being disclosed without proper authorization. The impact on the individual would be low as the Vitali-T-Stat mobile application itself does not collect or handle any personal information.
There is a very low risk of personal information being disclosed without proper authorization. The impact on the institution would be low as the Vitali-T-Stat mobile application itself does not collect or handle any personal information.
This assessment concludes that the Vitali-T-Stat mobile application does not add risk to Statistics Canada’s data collection practices and did not identify any privacy risks that cannot be managed using existing safeguards.