A Digital Object Identifier (DOI) is a unique alphanumeric string assigned to datasets and scientific journals. It provides a permanent access to our datasets and facilitates identification and citation within a digital environment.
How do I find the data I am used to getting from the previous website?
New products links redirect users from bookmarked content to the equivalent new content. Old catalogue product numbers and CANSIM table numbers are searchable and link to the latest content. As well, all site content, new and old, is available through the site search. A concordance table between old CANSIM table numbers and new table numbers is available online. A video is available for users to help them navigate the website and find the information they need: How to use the data tables.
How do I add/remove data from my data table?
Once in your table, select 'Add/Remove data' button.
Here you can add or remove items from selected tabs (for example, Geography), then selecting or deselecting the items you want added or removed.
If you want to add or remove reference periods then select the 'Reference period' tab and select your time range.
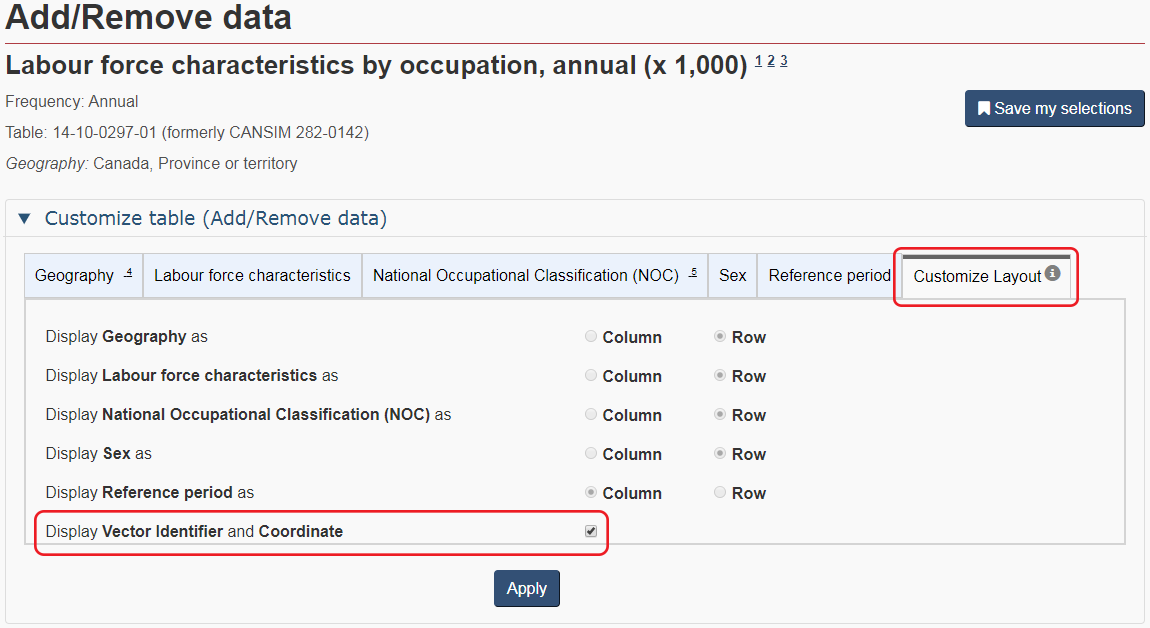
If you want to customize your layout then select the 'Customize Layout' tab and you will see you can change the layout of your table by selecting column or row for each one.
When you are done with your changes, then select the 'Apply' button and your results will appear in the table below.
How do I display vectors and coordinates onscreen in data tables?
From the Add/Remove data feature, select the Customize Layout tab and then choose Display Vector Identifier and Coordinate. Please note that with this selection, the other customize layout options are disabled and all dimensions, except the reference period, are displayed as rows.
When you are done with your changes, then select the 'Apply' button and your results will appear in the table below.
How are data organized and presented on the site?
Statistics Canada data can be accessed under the subjects, data, geography, census program and surveys and statistical programs sections. They have been organized by sub-category, including tables and profiles. Data tables now offer a consistent presentation across all subjects.
The data table does not display the latest data – how do I refresh the data table to reflect the latest modifications or additions?
In the event that we experience difficulties with our web site and the presentation of our data tables, we suggest that you may have to click CNTL + F5 to refresh your display to update the data inside the table.
Where are the CANSIM tables?
CANSIM tables have been replaced by data tables with the same or similar content that have a consistent presentation and that will be dynamically updated as new results are released.
You can find a former CANSIM table by using the "Filter results by keyword(s)" option to type the number of the corresponding data table (e.g. 282-0023 and not CANSIM 282-0023). Redirects have also been implemented from former content to the equivalent new content. A concordance table between old CANSIM table numbers and new table numbers is available online.
Where are the Summary Tables?
Summary tables have been replaced by data tables with the same or similar content that have a consistent presentation and that will be dynamically updated upon the release of new results. For our most commonly used tables, redirects have been implemented from former content to the equivalent new content.
How have the table titles changed?
Simpler titles provide greater clarity about the primary focus and components of the table. Users can find additional information in the table descriptions.
Will the tables and other information products be assigned new identification numbers?
We now have new product identification numbers. The first 2 digits represent the main subject (for example, 12 for International Trade 12-XX-XXXX-XX). The next 2 digits represent the type of product. For example, all data tables are assigned a 10. Publications are assigned either a 20, 26, or 28. A public use micro-data file is assigned a 25.
For data tables and publications the subsequent 4 digits are used for internal purposes. They are assigned sequentially and in some specific cases, different views were created for the same data series. The final 2 digits at the end reflects this situation.
Main subject codes
Subject
Code
Agriculture and food
32
Business and consumer services and culture
21
Business performance and ownership
33
Children and youth
42
Construction
34
Crime and justice
35
Digital economy and society
22
Economic accounts
36
Education, training and learning
37
Energy
25
Environment
38
Families and households
39
Government
10
Health
13
Housing
46
Immigration and ethnocultural diversity
43
Income, pensions, spending and wealth
11
Indigenous peoples
41
International trade
12
Labour
14
Languages
15
Manufacturing
16
Population and demography
17
Prices and price indexes
18
Retail and wholesale
20
Science and technology
27
Seniors and aging
44
Society and community
45
Statistical methods
19
Transportation
23
Travel and tourism
24
How has the data presentation changed from CANSIM?
Each table is initially presented with drop-down filters that allow users to quickly navigate to the data points of interest. Further customization is possible using the Add/remove data button. Users also have the option to pivot table rows and columns, using the customize layout button.
Where did the footnotes at the bottom of the CANSIM tables go?
Users are able to click on a note in a table to see the note content displayed as an overlay. When customizing a table, notes are now renumbered automatically. If the download as displayed function is used, all the notes will appear at the bottom of the table. When users download the entire dataset, all notes are provided in a separate metadata file which downloads along with the data file.
Which data download options are available?
Users are able to download data in different output formats. On the website, users have the option to download data as displayed on the screen, download an entire table or receive information through web data services. In terms of output formats to download an entire table, Statistics Canada is moving away from proprietary output formats (like Beyond 20/20 IVT format) to support non-proprietary, open, output formats such as CSV or SDMX.
Additional fields have been added to the output files. In addition, when users download the entire dataset, all notes are provided in a separate metadata file, which downloads along with the data file. The sort order within the data files has been modified from previous CSV outputs. Data will now be sorted by ref_date in ascending order. Should you require further details about upcoming changes to the output files, please e-mail statcan.od-services-bds-services.statcan@statcan.gc.ca.
Users can also retrieve data in English or French formats. CSV and Semicolon-Separated Values (SCSV) files are produced differently depending on the language. In French, the comma is used to indicate decimals; a different separator (a semicolon) must therefore be used. SCSV files retrieved in French will parse correctly only if the Regional Settings are set to French.
How do I download my data table?
Once you have retrieved your table, you can download data multiple ways.
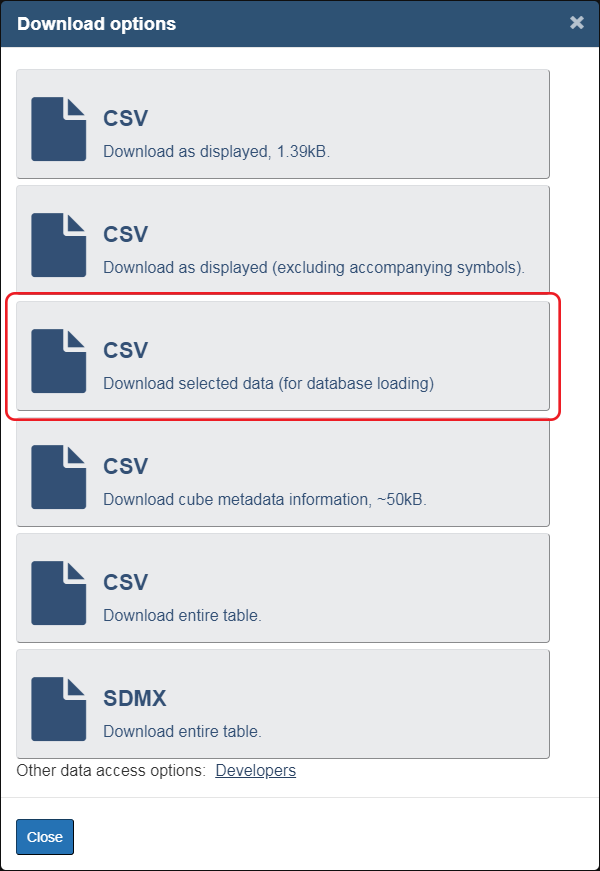
If you want to download data when you have initially first retrieved your table, then select the 'Download options' button. You can Download as displayed (in .CSV format), Download as displayed (excluding accompanying symbols) (in .CSV format), Download entire table (in .CSV format), or Download entire table (in SDMX format).
If you want to download data after you have used Add/Remove data, then select the 'Download options' button after you have selected the 'Apply' button and you will get the same download options to choose from.
It is also possible to save a customized selection of a particular data table in the same format that is used for the "full table download" files.
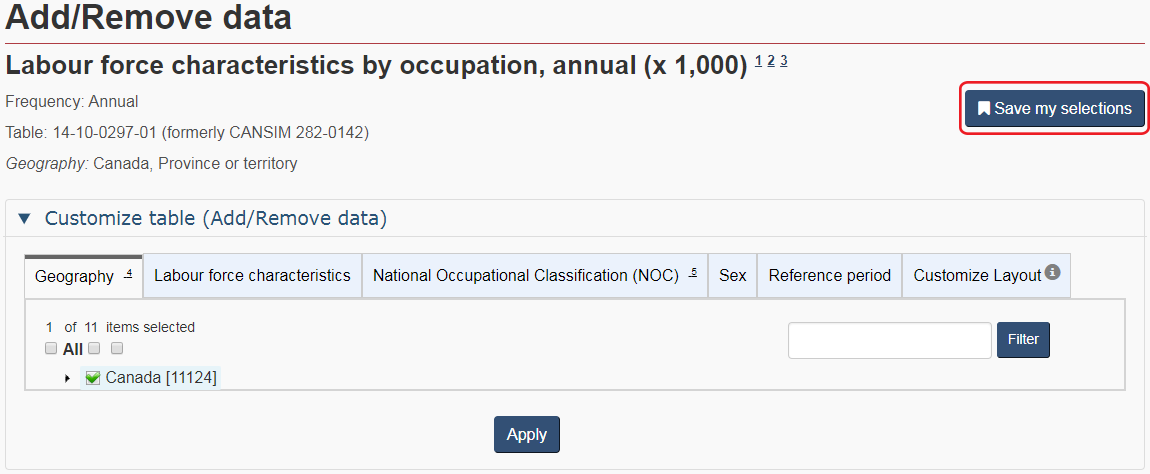
How do I save my selections after I have customized my data tables?
We have also added a feature which allows users to save or share their customized view of a data table. After using the drop down menus, or the more advance features found under 'add/remove data', users are now able to use this 'Save my selections' feature.
Are less data available to the public?
All the content previously residing on the official Statistics Canada website has been integrated into the new product line.
Where did the CANSIM manipulate feature go?
Given the very limited use of this functionality, the feature itself was discontinued but we will continue to support the most commonly used calculations, including the percentage change between years.
Is there a plan to offer dynamic charts and thematic maps?
Yes. More dynamic charts and thematic maps are planned for the future.
Are the data available through Open Government affected by changes to the Statistics Canada website?
Statistics Canada's new way of publishing data on its website automatically populates the federal Open Data portal, Open Government, with records from Statistics Canada's data products. Therefore, information like titles, descriptions and keywords are quickly transferred to Open Government and are found on the Open Data portal as soon as the data are published.
Are any new services being offered?
Web data services/API (Application Programming Interface) are now available for our complete data holdings. These services are available to sophisticated data users wanting to program a direct automated harvesting of data.
Are there any improvements to search?
New ways to search content include a "Filter results by keyword(s)" option and other filters to narrow down results.
Can I still find data using vectors?
It is still possible to search tables using former CANSIM vectors by typing the specific vector number(s) using the Search by vector feature located within the Data way in.
How can I search by vector?
Select the Search by vector button
Select the amount of reference periods you want from the 'Select latest reference period(s) drop down (1, 2, 3, 4, 5, 12, 25, 50, 100, 150, or 200).
Enter in your vector number(s) including the letter 'v' which precedes the actual vector number. You can separate vector numbers by a comma (,).
Select the search button.
Your search results will appear below in a table format with the Vector, Frequency, Title, Description, Reference Period, Unit of Measure, Value and Source (Product ID).
NOTE: The available download options are as displayed and no symbols, both available in .CSV format.
How do I find data for a particular region or area?
The Geography page lets users access data for particular regions or areas. A new mapping tool provides results from all data sources, where available, and covers all surveys and statistical programs including the census and the National Household Survey.
Where can I find related information about a product?
Publications such as data tables and catalogue pages have a section at the bottom called "Related information" where users will find what the product may replace, information about the source, related products and subject/keywords, etc.
What if I have questions or comments?
Please visit the Contact us page for any questions or comments.
This survey is conducted by Statistics Canada in order to collect the necessary information to support the Integrated Business Statistics Program (IBSP). This program combines various survey and administrative data to develop comprehensive measures of the Canadian economy.
The statistical information from the IBSP serves many purposes, including:
Calculating each province and territory's fair share of federal-provincial transfer payments for health, education and social programs
Establishing government programs to assist businesses
Assisting the business community in negotiating contracts and collective agreements
Supporting the government in making informed decisions about fiscal, monetary and foreign exchange policies
Indexing social benefit programs and determining tax brackets
Enabling academics and economists to analyze the economic performance of Canadian industries and to better understand rapidly evolving business environments.
Your information may also be used by Statistics Canada for other statistical and research purposes.
Your participation in this survey is required under the authority of the Statistics Act.
Other important information
Authorization to collect this information
Data are collected under the authority of the Statistics Act, Revised Statutes of Canada, 1985, Chapter S-19.
Confidentiality
By law, Statistics Canada is prohibited from releasing any information it collects that could identify any person, business, or organization, unless consent has been given by the respondent, or as permitted by the Statistics Act. Statistics Canada will use the information from this survey for statistical purposes only.
Record linkages
To enhance the data from this survey and to reduce respondent burden, Statistics Canada may combine it with information from other surveys or from administrative sources.
Data-sharing agreements
To reduce respondent burden, Statistics Canada has entered into data-sharing agreements with provincial and territorial statistical agencies and other government organizations, which have agreed to keep the data confidential and use them only for statistical purposes. Statistics Canada will only share data from this survey with those organizations that have demonstrated a requirement to use the data.
Section 11 of the Statistics Act provides for the sharing of information with provincial and territorial statistical agencies that meet certain conditions. These agencies must have the legislative authority to collect the same information, on a mandatory basis, and the legislation must provide substantially the same provisions for confidentiality and penalties for disclosure of confidential information as the Statistics Act. Because these agencies have the legal authority to compel businesses to provide the same information, consent is not requested and businesses may not object to the sharing of the data.
For this survey, there are Section 11 agreements with the provincial and territorial statistical agencies of Newfoundland and Labrador, Nova Scotia, New Brunswick, Québec, Ontario, Manitoba, Saskatchewan, Alberta, British Columbia and the Yukon. The shared data will be limited to information pertaining to business establishments located within the jurisdiction of the respective province or territory.
Section 12 of the Statistics Act provides for the sharing of information with federal, provincial or territorial government organizations. Under Section 12, you may refuse to share your information with any of these organizations by writing a letter of objection to the Chief Statistician, specifying the organizations with which you do not want Statistics Canada to share your data and mailing it to the following address:
Chief Statistician of Canada
Statistics Canada
Attention of Director, Enterprise Statistics Division
150 Tunney's Pasture Driveway
Ottawa, Ontario
K1A 0T6
For this survey, there are Section 12 agreements with the statistical agencies of Prince Edward Island, the Northwest Territories and Nunavut.
For agreements with provincial and territorial government organizations, the shared data will be limited to information pertaining to business establishments located within the jurisdiction of the respective province or territory.
Business or organization and contact information
1. Please verify or provide the business or organization's legal and operating name and correct where needed.
Note: Legal name modifications should only be done to correct a spelling error or typo.
Legal Name
The legal name is one recognized by law, thus it is the name liable for pursuit or for debts incurred by the business or organization. In the case of a corporation, it is the legal name as fixed by its charter or the statute by which the corporation was created.
Modifications to the legal name should only be done to correct a spelling error or typo.
To indicate a legal name of another legal entity you should instead indicate it in question 3 by selecting 'Not currently operational' and then choosing the applicable reason and providing the legal name of this other entity along with any other requested information.
Operating Name (if applicable)
The operating name is a name the business or organization is commonly known as if different from its legal name. The operating name is synonymous with trade name.
Legal Name
Operating Name (if applicable)
2. Please verify or provide the contact information of the designated business or organization contact person for this questionnaire and correct where needed.
Note: The designated contact person is the person who should receive this questionnaire. The designated contact person may not always be the one who actually completes the questionnaire.
First name
Last name
Title
Preferred language of communication
English
French
Mailing address (number and street)
City
Province, territory or state
Postal code or ZIP code
Country
Canada
United States
Email address
Telephone number (including area code)
Extension number (if applicable)
The maximum number of characters is 5.
Fax number (including area code)
3. Please verify or provide the current operational status of the business or organization identified by the legal and operating name above.
Operational
Not currently operational
Why is this business or organization not currently operational?
Seasonal operations
When did this business or organization close for the season?
Date
When does this business or organization expect to resume operations?
Date
Ceased operations
When did this business or organization cease operations?
Date
Why did this business or organization cease operations?
Bankruptcy
Liquidation
Dissolution
Other - Specify the other reasons for ceased operations
Sold operations
When was this business or organization sold?
Date
What is the legal name of the buyer?
Amalgamated with other businesses or organizations
When did this business or organization amalgamate?
Date
What is the legal name of the resulting or continuing business or organization?
What are the legal names of the other amalgamated businesses or organizations?
Temporarily inactive but will re-open
When did this business or organization become temporarily inactive?
Date
When does this business or organization expect to resume operations?
Date
Why is this business or organization temporarily inactive?
No longer operating due to other reasons
When did this business or organization cease operations?
Date
Why did this business or organization cease operations?
4. Please verify or provide the current main activity of the business or organization identified by the legal and operating name above.
Note: The described activity was assigned using the North American Industry Classification System (NAICS).
This question verifies the business or organization's current main activity as classified by the North American Industry Classification System (NAICS). The North American Industry Classification System (NAICS) is an industry classification system developed by the statistical agencies of Canada, Mexico and the United States. Created against the background of the North American Free Trade Agreement, it is designed to provide common definitions of the industrial structure of the three countries and a common statistical framework to facilitate the analysis of the three economies. NAICS is based on supply-side or production-oriented principles, to ensure that industrial data, classified to NAICS, are suitable for the analysis of production-related issues such as industrial performance.
The target entity for which NAICS is designed are businesses and other organizations engaged in the production of goods and services. They include farms, incorporated and unincorporated businesses and government business enterprises. They also include government institutions and agencies engaged in the production of marketed and non-marketed services, as well as organizations such as professional associations and unions and charitable or non-profit organizations and the employees of households.
The associated NAICS should reflect those activities conducted by the business or organizational units targeted by this questionnaire only, as identified in the 'Answering this questionnaire' section and which can be identified by the specified legal and operating name. The main activity is the activity which most defines the targeted business or organization's main purpose or reason for existence. For a business or organization that is for-profit, it is normally the activity that generates the majority of the revenue for the entity.
The NAICS classification contains a limited number of activity classifications; the associated classification might be applicable for this business or organization even if it is not exactly how you would describe this business or organization's main activity.
Please note that any modifications to the main activity through your response to this question might not necessarily be reflected prior to the transmitting of subsequent questionnaires and as a result they may not contain this updated information.
The following is the detailed description including any applicable examples or exclusions for the classification currently associated with this business or organization.
Description and examples
This is the current main activity.
This is not the current main activity.
Please provide a brief but precise description of this business or organization's main activity.
e.g., breakfast cereal manufacturing, shoe store, software development
Main activity
5. You indicated that is not the current main activity. Was this business or organization's main activity ever classified as: ?
Yes
When did the main activity change?
Date
No
6. Please search and select the industry classification code that best corresponds to this business or organization's main activity.
Select this business or organization's activity sector (optional)
Farming or logging operation
Construction company or general contractor
Manufacturer
Wholesaler
Retailer
Provider of passenger or freight transportation
Provider of investment, savings or insurance products
Real estate agency, real estate brokerage or leasing company
Provider of professional, scientific or technical services
Provider of health care or social services
Restaurant, bar, hotel, motel or other lodging establishment
Other sector
7. You have indicated that the current main activity of this business or organization is: Main activity
Are there any other activities that contribute significantly (at least 10%) to this business or organization's revenue?
Yes, there are other activities.
No, that is the only significant activity.
Please provide a brief but precise description of this business or organization's secondary activity.
e.g., breakfast cereal manufacturing, shoe store, software development
8. Approximately what percentage of this business or organization's revenue is generated by each of the following activities?
When precise figures are not available, please provide your best estimates.
CAPTION
Percentage of revenue
Main activity
Secondary activity
All other activities
Total percentage
Reporting period information
1. What are the start and end dates of this business's or organization's most recently completed fiscal year?
Note: For the survey, the end date should fall between April 1, YYYY and March 31, YYYY+1 .
Here are twelve common fiscal periods that fall within the targeted dates:
May 1, YYYY-1 to April 30, YYYY
June 1, YYYY-1 to May 31, YYYY
July 1, YYYY-1 to June 30, YYYY
August 1, YYYY-1 to July 31, YYYY
September 1, YYYY-1 to August 31, YYYY
October 1, YYYY-1 to September 30, YYYY
November 1, YYYY-1 to October 31, YYYY
December 1, YYYY-1 to November 30, YYYY
January 1, YYYY to December 31, YYYY
February 1, YYYY to January 31, YYYY+1
March 1, YYYY to February 28, YYYY+1
April 1, YYYY to March 31, YYYY+1 .
Here are other examples of fiscal periods that fall within the required dates:
September 18, YYYY-1 to September 15, YYYY (e.g., floating year-end)
June 1, YYYY to December 31, YYYY (e.g., a newly opened business)
Fiscal Year Start date
Fiscal Year-End date
2. What is the reason the reporting period does not cover a full year?
Select all that apply.
Seasonal operations
New business
Change of ownership
Temporarily inactive
Change of fiscal year
Ceased operations
Other
Specify reason the reporting period does not cover a full year
Revenue
1. For the reporting period of YYYY-MM-DD to YYYY-MM-DD , what was this business's revenue from each of the following sources?
Notes:
a detailed breakdown may be requested in other sections
these questions are asked of many different industries. Some questions may not apply to this business
Please report all amounts in thousands of Canadian dollars.
Revenue
Sales of goods and services (e.g., fees, admissions, services revenue)
Sales of goods and services are defined as amounts derived from the sale of products and services (cash or credit), falling within a business's ordinary activities. Sales should be reported net of trade discount, value added tax and other taxes based on sales.
Include:
sales from Canadian locations (domestic and export sales)
transfers to other business units or the head office of this firm.
Exclude:
transfers into inventory and consignment sales
federal, provincial and territorial sales taxes and excise duties and taxes
intercompany sales in consolidated financial statements.
Rental and leasing
Include rental or leasing of apartments, commercial buildings, land, office space, residential housing, investments in co-tenancies and co-ownerships, hotel or motel rooms, long and short term vehicle leasing, machinery or equipment, storage lockers, etc.
Commissions
Include commissions earned on the sale of products or services by businesses such as advertising agencies, brokers, insurance agents, lottery ticket sales, sales representatives, and travel agencies - compensation could also be reported under this item (e.g., compensation for collecting sales tax).
Subsidies (including grants, donations and fundraising)
Include:
non-repayable grants, contributions and subsidies from all levels of government
revenue from private sector (corporate and individual) sponsorships, donations and fundraising.
Royalties, rights, licensing and franchise fees
A royalty is defined as a payment received by the holder of a copyright, trademark or patent.
Include revenue received from the sale or use of all intellectual property rights of copyrighted materials such as musical, literary, artistic or dramatic works, sound recordings or the broadcasting of communication signals.
Dividends
Include:
dividend income
dividends from Canadian sources
dividends from foreign sources
patronage dividends.
Exclude equity income from investments in subsidiaries or affiliates.
Interest
Include:
investment revenue
interest from foreign sources
interest from Canadian bonds and debentures
interest from Canadian mortgage loans
interest from other Canadian sources.
Exclude equity income from investments in subsidiaries or affiliates.
Other revenue - specify
Include amounts not included in questions a. to g.
Total revenue
The sum of questions a. to h.
CAPTION
CAN$ '000
Sales of goods and services
Rental and leasing
Commissions
Subsidies
Royalties, rights, licensing and franchise fees
Dividends
Interest
Other
Total revenue
1. In order to reduce future follow-up, please select one of the following options.
The reported value for total revenue $ ###### is significantly different than the $ ###### reported last reporting period.
I confirm that all values are correct.
I am unable to confirm that all values are correct.
The reported sales of goods and services entered $ ###### is significantly different than the $ ###### reported last reporting period.
I confirm that all values are correct.
I am unable to confirm that all values are correct.
Expenses
1. For the reporting period of YYYY-MM-DD to YYYY-MM-DD , what were this business's expenses for the following items?
Notes:
a detailed breakdown may be requested in other sections
these questions are asked of many different industries. Some questions may not apply to this business
Please report all amounts in thousands of Canadian dollars.
Expenses
Cost of goods sold
Many business units distinguish their costs of materials from their other business expenses (selling, general and administrative). This item is included to allow you to easily record your costs/expenses according to your normal accounting practices.
Include:
cost of raw materials and/or goods purchased for re-sale - net of discounts earned on purchases
freight in and duty.
Exclude all costs associated with salaries, wages, benefits, commissions and subcontracts (report at Employment costs and expenses, and Subcontracts).
Employment costs and expenses
Salaries, wages and commissions
Please report all salaries and wages (including taxable allowances and employment commissions as defined on the T4 - Statement of Remuneration Paid) before deductions for this reporting period.
Include:
vacation pay
bonuses (including profit sharing)
employee commissions
taxable allowances (e.g., room and board, vehicle allowances, gifts such as airline tickets for holidays)
severance pay.
Exclude all payments and expenses associated with casual labour and outside contract workers (report at Subcontracts).
Employee benefits
Include contributions to:
health plans
insurance plans
employment insurance
pension plans
workers' compensation
association dues
contributions to any other employee benefits such as child care and supplementary unemployment benefit (SUB) plans
contributions to provincial and territorial health and education payroll taxes.
Subcontracts
Subcontract expense refers to the purchasing of services from outside of the company rather than providing them in-house.
Include:
hired casual labour and outside contract workers
custom work and contract work
subcontract and outside labour
hired labour.
Research and development fees
Expenses from activities conducted with the intention of making a discovery that could either lead to the development of new products or procedures, or to the improvement of existing products or procedures.
Professional and business fees
Include:
legal services
accounting and auditing fees
consulting fees
education and training fees
appraisal fees
management and administration fees
property management fees
information technology (IT) consulting and service fees (purchased)
architectural fees
engineering fees
scientific and technical service fees
other consulting fees (management, technical and scientific)
veterinary fees
fees for human health services
payroll preparation fees
all other professional and business service fees.
Exclude service fees paid to Head Office (report at All other costs and expenses).
Utilities
Utility expenses related to operating your business unit such as water, electricity, gas, heating and hydro.
Include:
diesel, fuel wood, natural gas, oil and propane
sewage.
Exclude:
energy expenses covered in your rental and leasing contracts
telephone, Internet and other telecommunications (report at question h.)
vehicle fuel (report at All other costs and expenses).
Office and computer related expenses
Include:
office stationery and supplies, paper and other supplies for photocopiers, printers and fax machines
postage and courier (used in day to day office business activity)
diskettes and computer and peripherals upgrade expenses
data processing.
Exclude telephone, Internet and other telecommunication expenses (report at Telephone, Internet and other telecommunication).
Telephone, Internet and other telecommunication
Include:
Internet
telephone and telecommunications
cellular telephone
fax machine
pager.
Business taxes, licenses and permits
Include:
property taxes paid directly and property transfer taxes
vehicle license fees
beverage taxes and business taxes
trade license fees
membership fees and professional license fees
provincial capital tax.
Royalties, franchise fees and memberships
Include:
amounts paid to holders of patents, copyrights, performing rights and trademarks
gross overriding royalty expenses and direct royalty costs
resident and non-resident royalty expenses
franchise fees.
Exclude Crown royalties.
Crown charges
Federal or Provincial royalty, tax, lease or rental payments made in relation to the acquisition, development or ownership of Canadian resource properties.
Include:
Crown royalties
Crown leases and rentals
oil sand leases
stumpage fees.
Rental and leasing
Include:
lease rental expenses, real estate rental expenses, condominium fees and equipment rental expenses
motor vehicle rental and leasing expenses
studio lighting and scaffolding
machinery and equipment rental expenses
storage expense
road and construction equipment rental
fuel and other utility costs covered in your rental and leasing contracts.
Repair and maintenance
Include:
buildings and structures
machinery and equipment
security equipment
vehicles
costs related to materials, parts and external labour associated with these expenses
janitorial and cleaning services and garbage removal.
Amortization and depreciation
Include:
direct cost depreciation of tangible assets and amortization of leasehold improvements
amortization of intangible assets (e.g., amortization of goodwill, patents, franchises, copyrights, trademarks, deferred charges, organizational costs).
Insurance
Insurance recovery income should be deducted from insurance expenses.
Include:
professional and other liability insurance
motor vehicle and property insurance
executive life insurance
bonding, business interruption insurance and fire insurance.
Advertising, marketing, promotion, meals and entertainment
Include:
newspaper advertising and media expenses
catalogues, presentations and displays
tickets for theatre, concerts and sporting events for business promotion
fundraising expenses
meals, entertainment and hospitality purchases for clients.
exploration and development (including prospect/geological, well abandonment & dry holes, exploration expenses, development expenses)
amounts not included in sub-questions a. to t. above.
Total expenses
The sum of sub-questions a. to u.
CAPTION
CAN$ '000
Cost of goods sold
Opening inventories
Purchases
Closing inventories
Cost of goods sold
Employment costs and expenses
Salaries, wages and commissions
Employee benefits
Subcontracts
Research and development fees
Professional and business fees
Utilities
Office and computer related expenses
Telephone, Internet and other telecommunication
Business taxes, licenses and permits
Royalties, franchise fees and memberships
Crown charges
Rental and leasing
Repair and maintenance
Amortization and depreciation
Insurance
Advertising, marketing, promotion, meals and entertainment
Travel, meetings and conventions
Financial services
Interest expense
Other non-production-related costs and expenses
Other
Total expenses
1. In order to reduce future follow-up, please select one of the following options.
You could also make corrections to the current cycle by pressing the Previous button.
The value for total expenses $ ###### is significantly different than the $ ###### reported last reporting period.
I confirm that all values are correct.
I am unable to confirm that all values are correct.
The value for employee benefits $ ###### is significantly different than the $ ###### reported last reporting period.
I confirm that all values are correct.
I am unable to confirm that all values are correct.
Industry Characteristics
Sales
The following describes the types of periodicals for which you are requested to provide your sales revenue.
Consumer periodicals: periodicals covering topics of general or special interest aimed at a general consumer audience. Include arts, culture, leisure and entertainment, home and lifestyle, women's general interest, general business, religious and news.
Business-to-business, trade, and professional periodicals: periodicals dealing with industries, occupations and professions and scholarly publications aimed at professional audiences interested in keeping up-to-date with news, research and developments in a profession or a trade. Include business, farming and professional.
1. What were this business's print and digital sales for each of the following goods and services?
Include both print and digital revenue sources.
For questions 1a. to 1f, report revenue for your publishing business.
Please report all amounts in thousands of Canadian dollars.
Consumer periodicals: Periodicals covering topics of general or special interest aimed at a consumer audience. Examples include arts, culture, leisure and entertainment, home and lifestyles, women's general interest, general business and news.
Business-to-business, trade, and professional periodicals: Periodicals dealing with industries, occupations and professions and scholarly publications aimed at professional audiences interested in keeping up-to-date with news, research and developments in a profession or a trade. Include business, farming, and professional.
Custom publishing revenue: Periodicals created by publishers, media companies or agencies exclusively for third parties that are not primarily in the periodical publishing industry. Examples may include in-flight or other periodicals designed to foster a direct relationship between a company or brand, and its customers.
CAPTION
CAN$ '000
Advertising revenue
Consumer periodicals
Business-to-business, trade, and professional periodicals
Total advertising revenue
Circulation revenue
Consumer periodicals
Business-to-business, trade, and professional periodicals
Total circulation revenue
Custom publishing revenue
Consumer periodicals
Business-to-business, trade, and professional periodicals
Total custom publishing revenue
Custom printing revenue
Events, conferences and trade-show revenue
Other
Total sales of goods and services
In order to reduce future follow-up, please select one of the following options.
Your advertising revenue $ ###### is significantly different than the $ ###### reported last reporting period.
I confirm that all values are correct.
I am unable to confirm that all values are correct.
Your circulation revenue $ ###### is significantly different than the $ ###### reported last reporting period.
I confirm that all values are correct.
I am unable to confirm that all values are correct.
Your custom publishing revenue $ ###### is significantly different than the $ ###### reported last reporting period.
I confirm that all values are correct.
I am unable to confirm that all values are correct.
Industry Characteristics
2. Of the $ ###### reported as advertising revenue, what percentage was attributed to online or digital-only sources?
Percentage
3. Of the $ ###### reported as circulation revenue, what percentage was attributed to digital products such as digital-only editions and online access?
Percentage
4. Of the $ ###### reported as custom publishing revenue, what percentage was attributed to digital products such as digital-only editions and online access?
Percentage
5. What were this business's revenues from the following sources?
Please report all amounts in thousands of Canadian dollars.
CAPTION
CAN$ '000
Federal, provincial/territorial, municipal grants and subsidies
Other support
Selected expenses
6. What were this business's expenses for sub-contract printing?
Please report all amounts in thousands of Canadian dollars.
Expenses (CAN$ '000)
Selected expenses
7. What were this business's expenses for producing editorial content?
e.g., text, photographs, graphics and illustrations
Expenses (CAN$ '000)
8. What percentage of these expenses were Canadian editorial expenses?
i.e., a result of work performed by a Canadian citizen or permanent resident of Canada
Percentage
Selected expenses
9. What were this business's expenses for developing and maintaining its digital infrastructure?
Include employees who are directly involved with developing or maintaining your digital infrastructure, not in content creation.
e.g., hosting, infographics, software, hardware, other miscellaneous IT costs, employees
Expenses (CAN$ '000)
Titles published
10. How many titles did this business publish in each of the following categories?
Exclude newsletters.
Note: Do not provide the number of copies or copies circulated.
Titles published in print only: limited to no editorial content published digitally.
Titles published digitally only: limited to no editorial content published in print.
Titles published in both mediums: editorial content published in print and digitally.
CAPTION
Print-only
Digital-only
Print and digital (both mediums)
Consumer periodicals
Business-to-business, trade, and professional periodicals
Total titles by medium
Circulation
11. What was this business's annual print circulation net of return?
Include print circulation only.
Exclude newsletters.
Provide the total number of copies sold through the various channels of distribution listed.
Subscription: Copies of a periodical sold to a customer for a fixed period of time, generally one year or more.
If you sell subscriptions to 10 different publications that include both a print version and a digital version, and both versions are part of a package deal, then you should not classify the digital version as free. Therefore, please enter 20 as the answer to question 11a. Paid subscription, for an overall total of 20.
Newsstand or single copy: Copies of a periodical sold at newsstands or other retail outlets.
Other copies sold: Copies sold, other than through subscription or newsstand, e.g., back issues or one-off special interest publications.
Controlled or request circulation:
Controlled circulation: Free copies that are individually addressed to recipients who have directly requested the periodical from a publishing firm.
Requested circulation: Copies distributed free of charge on a regular basis to consumers selected by the publisher.
Other free, complimentary or promotional copies: Other copies distributed free of charge, e.g., to advertisers or agencies who have purchased advertising in the periodical or for promotional or marketing purposes.
CAPTION
Consumer periodicals
Business to business, trade, and professional periodicals
Total number
Paid subscriptions
Newsstand or single copy
Other copies sold
Controlled or request circulation
Other free, complimentary or promotional copies
Total
Digital
12. Which of the following mediums do you use to deliver editorial content?
Editorial periodical content: Content that is not advertisement based, examples may include text, photographs, graphics and illustrations. Content-based advertisements, e.g., advertorials or sponsored content, are not considered editorial content.
Website: A web page that has been developed to share editorial content with consumers. Please only include access to web pages that have been specifically created for your own periodicals.
Periodical content sent by email: Editorial periodical content sent to a consumer via e-mail address. The content should be included or embedded in the email itself. Please exclude newsletters and advertisements for periodical subscriptions.
Mobile applications (own or third-party): Refers to content accessed through a mobile application via phone or a tablet. This includes content accessed though both proprietary applications and third-party applications used to deliver editorial periodical content.
Social media: Websites and applications that deliver periodical content. Examples include websites and applications such as video-sharing platforms, online news and social networking services, media sharing platforms, and messaging apps. Please note that a link on a social media platform does not count as delivering content. A link posted on social media for example, would represent content that is ultimately delivered by the respondent's website. They would therefore select website. Periodicals that post some editorial content that continues onto a website, e.g., a partial article, can select both.
CAPTION
Yes
No
Website
Periodical content sent by email
Mobile application (own or third-party)
Social media
Digital
13. On average, how many users are accessing your editorial content through each of these mediums monthly?
Note: A unique user who accesses content on more than one platform should be counted once for each platform. Returning users should not be counted more than once for any platform.
Unique user: A distinct individual that accesses content over a one month period. May be counted by IP address, emails or unique subscription accounts.
Editorial periodical content: Content that is not advertisement based, examples may include text, photographs, graphics and illustrations. Content-based advertisements, e.g., advertorials or sponsored content, are not considered editorial content.
Website: A web page that has been developed to share editorial content with consumers. Please only include access to web pages that have been specifically created for your own periodicals.
Periodical content sent by email: Editorial periodical content sent to a consumer via e-mail address. The content should be included or embedded in the email itself. Please exclude newsletters and advertisements for periodical subscriptions.
Mobile applications (own or third-party): Refers to content accessed through a mobile application via phone or a tablet. This includes content accessed though both proprietary applications and third-party applications used to deliver editorial periodical content.
Social media: Websites and applications that deliver periodical content. Examples include websites and applications such as video-sharing platforms, online news and social networking services, media sharing platforms, and messaging apps. Please note that a link on a social media platform does not count as delivering content. A link posted on social media for example, would represent content that is ultimately delivered by the respondent's website. They would therefore select website. Periodicals that post some editorial content that continues onto a website, e.g., a partial article, can select both.
CAPTION
Number of unique users
Website
Periodical content sent by email
Mobile applications (own or third-party)
Social media
Digital
14. Of the number of unique users reported in the previous question, how many pay for access?
Note: A unique user who accesses content on more than one platform should be counted once for each platform. Returning users should not be counted more than once for any platform.
Unique user: A distinct individual that accesses content over a one month period. May be counted by IP address, emails or unique subscription accounts.
CAPTION
Percent paying for access
Website
Periodical content sent by email
Mobile applications (own or third-party)
Social media
Language
15. Indicate the number of titles you publish by language.
Exclude newsletters.
Note: Do not provide the number of copies circulated.
CAPTION
Number of titles (total, all formats)
English only
French only
Billingual (English and French)
Indigenous
Other languages
Total titles by language
Personnel
16. What were this business's personnel in each of the following categories?
CAPTION
Number
Percentage
Average number of paid employees during the reporting period
Percentage of paid employees who worked full time
Number of contract workers for whom you did not issue a T4
Changes or events
1. Indicate any changes or events that affected the reported values for this business or organization, compared with the last reporting period.
Select all that apply.
Strike or lock-out
Exchange rate impact
Price changes in goods or services sold
Contracting out
Organisational change
Price changes in labour or raw materials
Natural disaster
Recession
Change in product line
Sold business units
Expansion
New or lost contract
Plant closures
Acquisition of business units
Other
Specify the other changes or events
No changes or events
Contact person
1. Statistics Canada may need to contact the person who completed this questionnaire for further information. Is Provided Given Names Provided Family Name the best person to contact?
Yes
No
Who is the best person to contact about this questionnaire?
First name
Last name
Title
Email address
Telephone number (including area code)
Extension number (if applicable) - The maximum number of characters is 5.
Fax number (including area code)
Feedback
1. How long did it take to complete this questionnaire?
Include the time spent gathering the necessary information.
Hours
Minutes
2. We invite your comments about this questionnaire.
This guide is designed to provide additional information as you work through your questionnaire. If further assistance is required, please call us. A Statistics Canada employee will be happy to assist you.
What is the Annual Survey of Logging Industries and why is it important?
The Annual Survey of Logging Industries is conducted every year by Statistics Canada to obtain important information on the manufacturing sector (including logging operations) of the Canadian economy. Manufacturing establishments in Canada are required to provide information on such aspects of their operations as sales, costs/expenses, salaries and wages. Results from the Annual Survey of Logging Industries help Statistics Canada in compiling key data on the Canadian economy, such as the Gross Domestic Product (GDP). The total value of sales is used along with inventories to calculate production statistics. Total sales of individual products, and external trade data, are used to estimate the size of the Canadian market for particular goods.
The data are also published and are used by the business community, trade associations, municipal, provincial/territorial, and federal governments, international organizations and private citizens.
Businesses and governments depend on official statistics to make vital economic decisions. For example:
The Bank of Canada relies on the GDP to make decisions that influence interest and exchange rates, which in turn affect the costs of doing business;
Businesses and associations use the survey results to:
track their performance against industry averages;
evaluate expansion plans;
prepare business plans for investors;
adjust inflation-indexed contracts;
plan marketing strategies.
Why was I chosen to receive the Annual Survey of Logging Industries?
For most surveys, businesses are selected through random sampling to represent other businesses of the same type in their regions, with similar revenue or number of employees. Some businesses must be included every year as they contribute substantially to their particular industry or region. Smaller businesses must also be sampled if an industry only includes a limited number of businesses in a province or territory, to provide an accurate picture of an industry.
Whenever possible, Statistics Canada does use administrative data already filed with government, such as income tax returns or customs records. However, these sources do not contain all the information required to produce a complete industry profile. This is especially true for large businesses operating in a number of different industries, and in more than one province/territory. Tax records usually provide data for the legal entity but not for the different business units (establishments) that operate in different industries and/or provinces/territories. We need data from these specific business units to produce statistics by industry and by province/territory. Note: Although Statistics Canada can obtain records from the Canada Revenue Agency (CRA) to create statistics, CRA cannot access any individual survey records from Statistics Canada.
To protect the confidentiality of data provided by respondents, only data in aggregate form are available for use.
Your assistance in completing the enclosed survey is vital to the production of timely and accurate manufacturing statistics. If you experience difficulties in completing this survey, please do not hesitate to call us at 1-800-858-7921.
Guidelines
General remarks
This guide provides details to help you complete the survey with more exact responses in the following sections.
Introduction
Revenue
E-Commerce
Expenses
Sales of goods manufactured
Purchases of raw materials and components to be used in manufacturing process
Details on business locations
Detailed information on energy and water costs or expenses
The data requested can generally be obtained from:
The accounting records and financial statements (for profit centres) for your business unit;
Your production and cost reports (for cost centres);
Your employment and payroll records;
Other sources (e.g., your plant or production manager).
Introduction
Coverage
Please report the data for your establishment (referred to as a business unit) in this questionnaire. Each of the locations included in your business unit should be pre-printed in Details on this business's locations section. If you have acquired or disposed of a location, please indicate this change in the space provided.
Note: A business unit is the smallest operating unit in your business that can report the following items:
The value of sales;
The cost of materials and supplies purchased;
The cost of energy and water utility purchased;
The opening and closing inventories;
The number of employees and their salaries and wages.
Generally a business unit corresponds to a plant, mill or factory. However, it may comprise more than one plant or location when your accounting records do not permit separate reporting of the items listed above. A business unit may also include ancillary or support units, such as sales offices or warehouses.
If your business has more than one business unit, a separate questionnaire should be completed for each unit. Each questionnaire should cover all the activities of the relevant business unit.
If your firm has a separate administrative unit or head office located in a municipality other than the one in which the plant is located, then you should also fill out a separate questionnaire for the Head Office Survey. The activities of ancillary or support units which serve more than one of your business units should also be reported on a head office questionnaire (even if there is no separate head office as such).
If you are in doubt about the best way to report, or you are not sure what questionnaires are being completed by other units of your firm, please call 1-800-858-7921 for assistance. Please quote the reference number on the front page of the questionnaire in all communications.
Reporting instructions
When precise figures are not available please provide your best estimates. Report all monetary values in Canadian funds, rounded to the nearest thousand dollars (e.g., $55,417.40 should be reported as 55). Percentages should be rounded (e.g., report 37.3% as 37 and 75.8% as 76).
Contact person section asks for the name of contact as well as the person primarily responsible for completing this questionnaire. Sometimes this is not the same person. Please answer both questions accurately.
Business or organization and contact information
This section verifies or requests basic identifying information of the business or organization such as legal name, operating name (if applicable), contact information of the designated contact person, current operational status, and main activity(ies).
1. Legal name and Operating name
Legal Name
The legal name is one recognized by law, thus it is the name liable for pursuit or for debts incurred by the business or organization. In the case of a corporation, it is the legal name as fixed by its charter or the statute by which the corporation was created.
Modifications to the legal name should only be done to correct a spelling error or typo.
To indicate a legal name of another legal entity you should instead indicate it in question 3 by selecting 'Not currently operational' and then choosing the applicable reason and providing the legal name of this other entity along with any other requested information.
Operating Name
The operating name is a name the business or organization is commonly known as if different from its legal name. The operating name is synonymous with trade name.
2. Designated contact person
Verify or provide the requested contact information of the designated business or organization contact person. The designated contact person is the person who should receive this questionnaire. The designated contact person may not always be the one who actually completes the questionnaire. If different than the designated contact person, the contact information of the person completing the questionnaire can be indicated later in the questionnaire.
3. Current operational status
Verify or provide the current operational status of the business or organization identified by the legal and operating name in question 1. If indicating the operational status of the business or organization is 'Not currently operational' then indicate an applicable reason and provide the requested information.
4. Main activity
This question verifies the business or organization's current main activity as classified by the North American Industry Classification System (NAICS). The North American Industry Classification System (NAICS) is an industry classification system developed by the statistical agencies of Canada, Mexico and the United States. Created against the background of the North American Free Trade Agreement, it is designed to provide common definitions of the industrial structure of the three countries and a common statistical framework to facilitate the analysis of the three economies. NAICS is based on supply-side or production-oriented principles, to ensure that industrial data, classified to NAICS, are suitable for the analysis of production-related issues such as industrial performance.
The target entity for which NAICS is designed are businesses and other organizations engaged in the production of goods and services. They include farms, incorporated and unincorporated businesses and government business enterprises. They also include government institutions and agencies engaged in the production of marketed and non-marketed services, as well as organizations such as professional associations and unions and charitable or non-profit organizations and the employees of households.
The associated NAICS should reflect those activities conducted by the business or organizational unit(s) targeted by this questionnaire only, as identified in the 'Answering this questionnaire' section and which can be identified by the specified legal and operating name. The main activity is the activity which most defines the targeted business or organization's main purpose or reason for existence. For a business or organization that is for-profit, it is normally the activity that generates the majority of the revenue for the entity.
The NAICS classification contains a limited number of activity classifications; the associated classification might be applicable for this business or organization even if it is not exactly how you would describe this business or organization's main activity.
Please note that any modifications to the main activity through your response to this question might not necessarily be reflected prior to the transmitting of subsequent questionnaires and as a result they may not contain this updated information.
If the current NAICS associated with this business or organizations is not correct, please provide a brief description of the main activity and provide any additional information as requested.
Reporting period information
May 1, 2016 to April 30, 2017
June 1, 2016 to May 31, 2017
July 1, 2016 to June 30, 2017
August 1, 2016 to July 31, 2017
September 1, 2016 to August 31, 2017
October 1, 2016 to September 30, 2017
November 1, 2016 to October 31, 2017
December 1, 2016 to November 30, 2017
January 1, 2017 to December 31, 2017
February 1, 2017 to January 31, 2018
March 1, 2017 to February 28, 2018
April 1, 2017 to March 31, 2018
Here are other examples of fiscal periods that fall within the required dates:
September 18, 2016 to September 15, 2017 (e.g., floating year-end)
June 1, 2017 to December 31, 2017 (e.g., a newly opened business)
Revenue
1. Sales of goods and services
Sales of goods and services are defined as amounts derived from the sale of goods and services (cash or credit), falling within a business's ordinary activities.
For Logging Industries and Manufacturing
Report all sales (domestic and exports) of goods and services from Canadian locations at final selling price. Sales should be reported 'Free On Board' (FOB) factory gate: net of excise and provincial or territorial sales taxes, HST/GST, trade discounts, returns and allowances, and charges for outward transportation by common or contract carriers. (Note: FOB factory gate means truck gate if manufacturer is using own truck and driver).
Sales denominated in foreign currency should be converted into Canadian dollars at the exchange rate on the day of transaction.
Note: Goods reported as sold should not be included in inventory and goods held on consignment should be reported as inventory until actually sold.
Include:
Sales of logs and wood residue, regardless of the source of these materials (for logging operations only);
Revenue from stumpage sales;
Revenue from logging service fees or manufacturing and/or custom work (labour costs only as materials and products are owned by client);
Sales of goods manufactured from own materials whether at this business unit or at any other subcontracted manufacturing plants located within Canada;
Sales out of warehouses at locations other than your business unit if storage warehouses are owned or rented by your business unit;
Sales of goods purchased for resale, as is (purchased from another company or another business unit of your firm not covered by this questionnaire);
Amounts received from progress billings;
Revenue from repair work (labour costs only as materials and products are owned by client);
Charges for installation of manufactured goods where installation is part of sales;
Book value of goods sold for rental;
Transfers to other business units or a head office of your firm. Note that these should be reported at the value shown on your books of account (i.e. book transfer value).
Exclude:
Transfers into inventory and consignment sales;
Federal, provincial and territorial sales taxes, and excise duties and taxes;
Shipping charges by common carrier or contract carriers;
Discounts and returns.
2. Rental and leasing
Rental and leasing revenue from assets owned by your business unit should be reported here. This revenue should be reported before deduction of expenses such as property taxes and repairs and maintenance excluding the goods and services tax (GST). Rental expenses should not be subtracted from rental revenues.
Include:
Revenue from rental or leasing of manufactured products made by your business unit;
Revenue from long and short term rental or leasing of vehicles, machinery and equipment owned by your business unit (including operating leases);
Revenue from rental or leasing of apartments, commercial buildings, land, office space, residential housing, investments in co-tenancies and co-ownerships.
Exclude:
Finance charges from financing and sales leases;
Revenue from intellectual property (e.g., patents, trademarks, copyrights).
3. Commissions
Include:
Commissions earned on the sale of products or services by businesses such as advertising agencies, brokers, insurance agents, lottery ticket sales, sales representatives, and travel agencies – compensation could also be reported under this item (e.g., compensation for collecting sales tax).
4. Subsidies (including grants, donations and fundraising)
Include:
Non-repayable grants, contributions and subsidies from all levels of government;
Revenue from private sector (corporate and individual) sponsorships, donations and fundraising.
5. Royalties, rights, licensing and franchise fees
A royalty is defined as a payment received by the holder of a copyright, trademark or patent. Royalties paid by your business unit should not be subtracted from royalty revenues.
Include:
Revenue received from the sale or use of all intellectual property rights of copyrighted materials such as musical, literary, artistic or dramatic works, sound recordings or the broadcasting of communication signals. Examples are: motion pictures, computer programs, etc;
Revenues from franchise fees;
Revenues from licensing agreements.
6. Dividends
Dividend expenses should not be subtracted from dividend revenues.
Include:
Dividend income;
Dividends from Canadian sources;
Dividends from foreign sources;
Patronage dividends.
Exclude:
Dividend from capital investment from affiliates
7. Interest
Interest expenses should not be subtracted from interest revenues.
Include:
Investment revenue;
Interest from foreign sources;
Interest from Canadian bonds and debentures;
Interest from Canadian mortgage loans;
Interest from other Canadian sources.
Exclude:
Equity income from investments in subsidiaries or affiliates.
8. Other revenue (please specify)
Include all amounts not included in questions 1 to 7 above such as:
Revenue from warranties;
Placement fees for displaying items on websites, store windows, catalogues;
Revenue from shipping and handling charges that are not included in the price of the merchandise;
Deposit service income, credit service income and card service income;
Lodging and boarding revenue in the logging industry;
Revenue from secondary activities (e.g. cafeterias and lunch counters;
Revenue from outside installation or construction work not related to your own products.
9. Total Revenue
(sum of lines 1 to 8)
E-commerce
Mobile app
Include:
Sales through any app, or application, that is downloaded and designed to run on a handheld device such as a smartphone or tablet (for example, places where a user may download these apps include Apple's App Store, Google Play or Blackberry App World).
Company website
Include:
Sales through a browser-based website where your organization maintains control of the content.
Third-party website
Include:
Sales through a browser-based website where a third-party maintains the structure of the website and control of the look and feel while your company only provides the product to be sold (for example, Amazon, Expedia, Etsy).
A standard format for exchanging business data. EDI is based on the use of message standards, ensuring that all participants use a common language.
Expenses
1. Purchases
For Manufacturing and Logging Industries
Please report the laid-down cost FOB, plant gate, but excluding GST, for purchases / cost of materials.
Include:
Purchases of raw materials and components for manufacturing;
Purchases of non-returnable containers and other shipping and packaging materials (boxes, cartons, barrels, kegs, bottles, pallets);
Purchases of goods purchased for resale in the same condition as purchased (without further manufacturing or processing);
Shipping charges by common carrier or contract carriers;
Freight in and duty;
Fuel purchased to be used as an input into the manufacturing process as a feedstock or processing material (e.g., crude oil processed into gasoline).
Exclude:
Federal, provincial and territorial sales taxes, and excise duties and taxes;
Change in inventories
2. Employment costs and expenses
a. Salaries, wages and commissions
Please report all salaries and wages (including taxable allowances and employment commissions as defined on the T4 – Statement of Remuneration Paid) for this reporting period. Amounts reported should be gross, before any deductions at source.
Include:
Indirect labour costs (e.g., food service staff, repair staff);
Overtime payments;
Vacation pay;
Payments to casual labour;
Directors' pay;
Bonuses (including profit sharing);
Commissions paid to regular employees such as your manufacturer's agents;
Taxable allowances (e.g., room and board, gifts such as air tickets for holidays);
Retroactive wage payments;
Stock options awarded to employees (the amount for which you have entered a "code 38" on the employees' T4 and which is included in box 14 – value according to CRA rules);
Any other allowance forming part of the employee's earnings;
Payments to individuals working on their own premises using equipment and materials provided by your business unit since such persons should be treated as employees;
Severance pay.
Exclude:
Deferred stock options awarded to employees that meet relevant CRA rules (the amount for which you have entered a "code 53" on the employee's T4 and which is excluded from box 14);
Amounts paid out to other business units for employment costs only;
Monies withdrawn by working owners and partners of unincorporated business units;
Director's fees or distribution of profits to shareholders of incorporated business units;
Cost/expenses for outside subcontracted employees (report the amount at question 3-Subcontracts)
Cost/expenses for temporary workers paid through an agency, as well as charges for personnel search services (report these amounts at question 21 – All other costs and expenses).
b. Employee benefits
Report expenses related to the employer portion of employee benefits.
Include:
Payments for employee life and extended health care insurance plans (e.g., medical, dental, drug and vision care plans);
Employer portion of Canada Pension Plan/Quebec Pension Plan (CPP/QPP) contributions;
Employer pension contributions;
Contributions to provincial and territorial health and education payroll taxes (applicable to your business unit);
Workers' compensation (provincial or territorial) applicable to your business unit;
Employer portion of employment insurance premiums (EI);
Association dues paid by the employer;
All other employee benefits such as childcare and supplementary unemployment benefit (SUB) plans.
Exclude:
Employee portions of employee benefits (i.e., deductions from pay).
3. Subcontracts
Subcontract expense refers to the purchasing of services from outside of the company rather than providing them in-house. In such cases, business units provide materials to other business units or individuals for the production of outputs on a so-called "custom basis". Subcontract expense only refers to work hired out for production towards the company's outputs.
Include:
Commissions paid to non-employees;
Any amount you pay to any other business units, firms, or individuals for work done on materials you own;
Custom work and contract work;
Subcontract and outside labour;
Hired labour.
Exclude:
Research and development subcontracts (report these amounts at question 4 – Research and development fees);
Salaries and wages paid to employees;
Payments to individuals working on their own premises using machinery, equipment and materials provided by your firm (such persons should be treated as employees);
Cost of materials;
Cost/expenses for temporary workers paid through an agency, as well as charges for personnel search services (report these amounts at question 21 – All other costs and expenses);
Repairs and maintenance services (report these amounts at question 13 - Repair and maintenance).
4. Research and development fees
Paid activities (purchased or subcontracted) conducted with the intention of making a discovery that could either lead to the development of new products or procedures, or to the improvement of existing products or procedures.
Exclude:
Own labour costs (included at line 2. a. - Salaries, wages and commissions)
5. Professional and business fees
Please report only the total cost of purchased professional or business service fees here (a detailed breakdown may be required in a subsequent section).
Include:
Legal services;
Accounting and auditing fees;
Education and training fees;
Appraisal fees;
Management and administration fees;
Property management fees;
Information technology (IT) consulting and service fees (purchased);
Data processing services fees;
Architectural fees;
Engineering fees;
Scientific and technical service fees;
Other consulting fees (management, technical and scientific);
Veterinary fees;
Fees for human health services;
Payroll preparation fees;
All other professional and business service fees.
Exclude:
Service fees paid to Head Office and other business units not included in this questionnaire (report these at question 21- All other costs and expenses);
The cost of in-house activities undertaken by your own staff.
6. Energy and water expenses
Report the cost/expense of purchased utilities attributed to operations in the current reporting period such as water, electricity, gas and heating.
Include:
Diesel, fuel wood, natural gas, oil and propane;
Sewage.
Exclude:
Energy expenses covered in your rental and leasing contracts;
Telephone, Internet and other telecommunications;
Vehicle fuel (report these at question 21- All other costs and expenses);
Raw materials i.e. any fuel purchased as input to the manufacturing process as a feed stock or processing material (e.g. crude oil to be refined into gasoline) or for any other non-energy purpose (report these at question 1 - Purchases).
7. Office and computer related expenses
Please report all office supplies purchased and used by your business unit for both manufacturing and non-manufacturing operations.
Include:
Office stationery and supplies, paper and other supplies for photocopiers, printers and fax machines;
Postage and courier fees (used in the day-to-day office business activity);
Memory storage devices and computer upgrade expenses;
Data processing expense (equipment, software and software licenses).
Exclude:
Telephone, Internet and other telecommunication expenses (report this amount at question 8 -Telephone, Internet and other telecommunication).
8. Telephone, Internet and other telecommunication
Include:
Telephone, fax, cellular phone, or pager services for transmission of voice, data or image;
Internet access charges;
Purchased cable and satellite transmission of television, radio and music programs;
Wired telecommunication services;
Wireless telecommunication services;
Satellite telecommunication services;
Large bandwidth services to send/receive digital works;
Online access services;
Online information provision services.
9. Business taxes, licenses and permits
This item comprises the cost of various licenses and permits, and some indirect taxes (taxes levied on your business unit that are not corporate income or logging taxes, sales or excise taxes, or insurance premium taxes).
Include:
Property taxes paid directly and land transfer taxes;
Business taxes;
Vehicle license and/or registration fees;
Beverage license fees;
Trade license fees;
Professional license fees;
All other license fees;
Lot levies;
Building permits and development charges;
Other property/business licenses or permits not specified above.
Exclude:
Property taxes covered in your rental and leasing expenses;
Corporate income taxes;
Stumpage fees (report these at 11 – Crown charges).
10. Royalties (other than Crown royalties), franchise fees and memberships
Include:
Amounts paid to holders of patents, copyrights, performing rights and trademarks;
Gross overriding royalty expenses and direct royalty costs;
Resident and non-resident royalty expenses;
Membership fees;
Franchise fees.
Exclude:
Stumpage fees (report these at 11 – Crown charges).
11. Crown charges (for logging, mining and energy industries only)
Include:
Crown royalties, Crown leases and rentals, oil sand leases and stumpage fees;
Federal or provincial royalty, tax, lease or rental payments made in relation to the acquisition, development or ownership of Canadian resource properties.
12. Rental and leasing (land, buildings, equipment, vehicles, etc.)
Include:
Lease/rental expenses, real estate rental expenses, condominium fees and equipment rental expenses;
Only operating leases (as opposed to leases that can be capitalized);
Motor vehicle rental and leasing expenses (without driver);
Furniture and fixtures;
Computer, machinery and equipment rental expenses (without operator);
Storage expense;
Studio lighting and scaffolding;
Road and construction equipment rental;
Fuel and other utility costs covered in your rental and leasing contracts.
Exclude:
Rental and leasing of vehicles (with driver), machinery and equipment (with driver or operator) (report these costs at question 21 - All other costs and expenses).
13. Repair and maintenance
This item comprises repair and maintenance costs related to the replacement of parts or other restoration of plant and machinery to keep your properties in efficient working condition.
Include:
Waste removal services, hazardous and non-hazardous;
Janitorial and cleaning services;
Sweeping and snow removal services;
Costs related to materials, parts and external labour associated with the following expenses: buildings and structures, machinery and equipment, motor vehicles, security equipment and other goods (except fabricated metal products or furniture repair services).
Exclude:
Salaries already reported in question 2 - Employment costs and expenses;
Property management fees (report these at question 5 - Professional and business fees);
Repair and maintenance expenses that are included in any payment to a head office.
14. Amortization and depreciation
Report the amortization/depreciation (the systematic allocation of the cost of assets to current operations over their useful life) related only to the current reporting period.
Include:
Direct cost depreciation of tangible assets and amortization of leasehold improvements;
Amortization of rental equipment (for operating leases: by lessor; for capital leases: by lessee);
Amortization of intangible assets (e.g., amortization of goodwill, patents, franchises, copyrights, trademarks, deferred charges, deferred gains and losses on investments, organizational costs).
15. Insurance
Insurance recovery income should be deducted from insurance expenses.
Include:
Accident and health insurance services;
Life insurance and individual pension services;
Asset insurance services, including property and motor vehicle;
General liability insurance services;
Executive life insurance;
Bonding, business interruption insurance and fire insurance;
All other insurance services not elsewhere specified.
Exclude:
Payments on behalf of employees which are considered to be taxable benefits (report these at question 2(b) – Employee benefits);
Premiums paid directly to your head office (report these at question 21 – All other costs and expenses).
16. Advertising, marketing, promotion, meals and entertainment
Include:
Advertising planning and creating services;
Newspaper advertising and media expenses;
Catalogues, presentations and displays;
Trade fairs and exhibition organization services;
Tickets for theatre, concerts and sporting events for business promotion;
Fundraising expenses;
Meals, entertainment and hospitality purchases for clients;
Other advertising services.
17. Travel, meetings and conventions
Include:
Travel expenses;
Rental services of passenger cars, buses and coaches with operator;
Interest expenses (report these at question 19 – Interest expense).
19. Interest expense
Please report the cost of servicing your company's debt such as interest and bank charges, finance charges, interest payments on capital leases, amortization of bond discounts.
Include (interest on):
Short-term and long-term debt;
Bonds and debentures;
Mortgages.
Exclude:
Dividends paid to term and retractable preferred shares;
Debt issue expenses, including their amortization.
20. Bad dept, loan losses, donations, political contributions and inventory writedown
Include:
Charitable donations and political contributions;
Bad debt expense;
Loan losses;
Provisions for loan losses (minus bad debt recoveries);
Inventory adjustments.
21. All other costs and expenses (including intracompany expenses)
Pipeline operations, drilling, site restoration costs;
Gross overriding royalty;
Other producing property rental costs;
Well operating, fuel and equipment costs;
Other lease rental costs;
Other direct costs;
Equipment hire and operation costs;
Overhead expenses allocated to costs of sales;
Cash over/short (negative expense);
Reimbursement of parent company expenses;
Warranty expenses;
Recruiting expenses;
General and administrative expenses;
Interdivisional expenses;
Interfund transfers (minus expense recoveries);
Exploration and development costs (include: geological prospecting, well abandonment and dry holes, exploration expenses, development expenses);
Safety supplies;
Cafeteria supplies;
Materials, components and supplies for installation and construction that is not related to own product;
All other supplies, material and components not elsewhere specified;
Variance;
All other expenses not reported elsewhere.
Exclude:
Items related to expenditures in prior periods.
22. Total expenses
(sum of lines 1 to 21)
Industry Characteristics
Sales
1. Cost Center
A cost center is a department or section of a company where managers are directly responsible for costs. For example, consider a company that has a manufacturing department, a research and development department, and a payroll department. Each department could be a cost center. Cost centers do not directly report revenues as these are reported by another part of the company such as a head office.
2. Valuation of sales
Please indicate whether you will report at final selling price or any alternate valuation.
If you are a single business unit firm, sales must be reported at your final selling price.
If you are part of a multi-business unit firm:
sales to your firm's non-logging or non-manufacturing business units must be reported at your final selling price.
sales to your firm's logging or manufacturing business units, sales branches, selling warehouses or head offices should be reported at the value shown on your books of account (i.e., book transfer value)
Report all sales (domestic and exports) goods and services from Canadian locations at final selling price. Sales should be reported FOB factory gate: net of excise and provincial or territorial sales taxes, HST/GST, trade discounts, returns and allowances, and charges for outward transportation by common or contract carriers. (Note: FOB factory gate means truck gate if manufacturer is using own truck and driver).
Sales denominated in foreign currency should be converted into Canadian dollars at the exchange rate on the day of transaction.
Note: Goods reported as sold should not be included in inventory and goods held on consignment should be reported as inventory until actually sold. If you are classified as a contract logger, the sales of logs and wood residue that result from logging services performed for another business unit that owns the stumpage rights should not be reported by you but by the business unit that owns the stumpage rights. You should only report the revenues from the logging service provided in question 5.
Please note that the questionnaires for the manufacturing industries and the logging industries are slightly different. Depending on which one you have received, the questions might be worded slightly differently and some categories of revenue might not be part of your questionnaire.
Sales for selected items
3.
a. Sales of logs, wood residue and manufacturing products
Include:
Sales of logs and wood residue, regardless of the source of these materials (for logging operations only);
Sales of logs and wood residue harvested by your own employees, by contractors, or bought by you on the open market should all be reported here;
Sales of goods manufactured from own materials whether at this business unit or at any other subcontracted manufacturing plants located within Canada;
Sales out of warehouses at locations other than your business unit if storage warehouses are owned or rented by your business unit;
Amounts received from progress billings;
Charges for installation of manufactured goods where installation is part of sales;
Book value of goods sold for rental;
Revenue from stumpage sales (for non-logging operations only; logging operations should report these in question 2 – Revenue from stumpage sales);
Transfers to other business units or a head office of your firm. Note that these should be reported at the value shown on your books of account (i.e., book transfer value).
Exclude:
Revenue from stumpage sales (for logging operations only; report these amounts in question 2 – Revenue from stumpage sales);
Transfers into inventory and consignment sales;
Shipping charges by common or contract carriers;
Discounts and returns;
Federal provincial and territorial sales taxes and excise duties and taxes;
Sales of goods purchased for resale, as is;
Revenue from repair work;
Revenue from logging service fees or manufacturing and/or custom work.
b. Revenue from stumpage sales
Please report any revenue earned from stumpage sales during the reporting period.
c. Sales of goods purchased for resale, as is
Report sales of goods that have not been processed or altered in your business unit and that have been purchased and resold in the same condition.
Include:
Sales of products transferred to you from other business units of your firm and sold in the same condition as transferred.
Exclude:
The Logging operations should not report at this line the sales of logs and wood residue, regardless of the business that harvested it (please report the amounts at question 1 – Sales of logs, wood residue and manufactured products);
Transfers into inventory and consignment sales;
Shipping charges by common or contract carriers;
Discounts and returns;
Federal provincial and territorial sales taxes and excise duties and taxes.
d. Revenue from repair work
Repair work comprises fixing/repairing products that have already been installed or delivered to a client (or other business unit). This work could be done at the client's facilities or at your business unit (where the products were uninstalled and shipped for repair). Repair work also includes warranty repairs where your business unit charges a fee to either an external business or another business unit within your firm. In all of these cases, your business unit has only provided labour to a client but this client owns the product(s) and materials involved.
Exclude:
Shipping charges by common or contract carriers;
Discounts;
Federal provincial and territorial sales taxes and excise duties and taxes.
e. Revenue from logging service fees or manufacturing and/or custom work
Logging, custom work or manufacturing service, comprise logging or manufacturing work undertaken to the specifications of a client (or other business unit of your firm) prior to installation or initial delivery. Your business unit has only provided labour to a client but this client owns the product(s) and materials involved (e.g. contract logging).
Exclude:
Shipping charges by common or contract carriers;
Discounts;
Federal provincial and territorial sales taxes and excise duties and taxes.
f. All other sales:
Include:
Sales of goods and services not specified elsewhere.
Exclude:
Revenue from rental and leasing;
Commissions;
Revenue from royalties, franchise and licensing fees;
Revenue from interest and dividends;
Subsidies /grants.
Total sales of goods and services
(sum of questions a. to f.)
Selected expense information
Please note that the questionnaires for the manufacturing industries and the logging industries are slightly different. Depending on which one you have received, the questions might be worded slightly differently and some categories of expense might not be part of your questionnaire.
4.
a. Purchases of raw materials and components
Report the laid-down cost FOB plant gate, but excluding GST for all raw materials and components purchased for your logging or manufacturing process.
Include:
Shipping charges by common carrier or contract carriers;
Freight in and duty;
Fuel purchased to be used as an input into the manufacturing process as a feedstock or processing material (e.g., crude oil processed into gasoline).
Exclude:
Federal provincial and territorial sales taxes and excise duties and taxes;
Purchases of goods purchased for resale in the same condition as purchased (without further manufacturing or processing);
Purchases of non-returnable containers and other shipping and packaging materials (boxes, cartons, barrels, kegs, bottles, pallets, etc.);
Change in inventories.
b. Stumpage fees
Business units undertaking logging operations on Crown land must pay "stumpage fees" for harvested logs. If logging activity is applicable to your business unit, please report the total of all stumpage fees paid during this reporting period.
c. Purchases of non-returnable containers and other shipping and packaging materials
Report the laid-down cost for all shipping and packaging materials purchased FOB plant gate, but excluding GST.
Shipping charges by common carrier or contract carriers;
Freight in and duty.
Exclude:
Federal provincial and territorial sales taxes and excise duties and taxes.
d. Purchases of goods for resale, as is
Report the laid-down cost of goods purchased for resale in the same condition as purchased (FOB plant gate, but excluding GST), i.e., without further manufacturing or processing.
Include:
Shipping charges by common carrier or contract carriers;
Freight in and duty.
Exclude:
Federal provincial and territorial sales taxes and excise duties and taxes;
Change in inventories.
e. Vehicle fuel expense
Report any vehicle fuel expenses incurred during your logging or manufacturing process.
Include:
Purchases of gasoline, diesel fuel, propane, natural gas and other fuel used to operate any type of vehicle at the location or otherwise, such as sales representatives' cars, delivery trucks, lift trucks, etc.
Exclude:
Any fuel purchased for power/heat generation.
Salaries, wages and commissions
Details on salaries, wages and commissions
Details on average number of people employed
This section requests a breakdown of total salaries, wages and commissions for this business unit. Amounts reported for salaries and wages should be gross, before any deductions from employees for income tax and employee contributions to health, accident, pension, insurance, or other benefits, all of which should be included. Please do this calculation separately for direct and indirect labour. Do not include benefit contributions by the employer.
To calculate the average number employed, add the number of employees in the last pay period of each month of the reporting period and divide this sum by the number of months (usually 12). Please do this calculation separately for direct and indirect labour.
The section is designed to account for all personnel on the payroll of your business unit.
5. Direct labour (manufacturing or logging)
Please report gross salaries and average number of workers.
Include employees engaged in:
Manufacturing (processing and/or assembling);
Logging and forestry support;
Packing, handling, warehousing;
Repair and maintenance, janitorial;
Watchmen;
Foremen doing work similar to their employees;
Erection/installation by own business unit when an extension of your manufacturing operations.
6. Indirect labour (administrative and selling/operating)
Please report gross salaries and average number of workers. Do not include workers that are not on your payroll.
Include:
Executives, administrators and office staff;
Sales staff;
Food service staff;
Building construction and major renovation staff (when work is chargeable to fixed asset accounts);
Machinery and equipment repair staff (when work is chargeable to fixed asset accounts).
Inventories
Inventories are to be reported at the value maintained in your accounting records (book value). If your accounting records do not distinguish between goods of own logging or manufacturing process and goods purchased for resale, please provide your best estimate of the distribution between the two inventory types.
Include:
Inventory at the logging processing location, manufacturing plant or at any warehouse or selling outlet which is treated as part of this business unit;
Inventory in transit in Canada;
Inventory held on consignment in Canada.
Exclude:
Goods owned and held in inventory abroad;
Any goods held on consignment for others.
7.
a. Raw materials and components
Include:
Materials and components to be used in the logging or manufacturing process;
Fuel purchased to be used as an input into the logging or manufacturing process as a feedstock or processing material (e.g., crude oil processed into gasoline);
Non-returnable containers and other shipping and packaging materials.
Exclude:
Any raw material intended for resale in the same condition as purchased
b. Goods and work in process
Include:
Partially completed goods;
The value of work done on goods accounted for under progress billing for which no payment has been received.
c. Finished goods manufactured
Include:
Logs, wood residues and manufactured products;
Goods of own manufacture from your business unit.
d. Goods purchased for resale, as is
Include:
All goods which are purchased for resale without further processing by your business unit.
Exclude:
Components manufactured by another business unit/firm that are purchased or transferred by this business and used as inputs for the assembly and manufacturing system (report these at question 15 – Raw material and components).
e. Other inventories (please specify)
Include:
All other inventory of materials used in your logging or manufacturing process but not included in the above categories.
Total inventories
(sum of questions a. to e.)
Sales of logs, wood residue and goods manufactured
This section represents a breakdown, by product for the total reported at question 3. a. - Sales of log, wood residue and goods manufactured in the Industry characteristics section. Please report the value of sales (in thousands of Canadian dollars) for each product produced by your manufacturing operations for the products listed in this section.
Note: If you are classified as a contract logger, the sales of logs and wood residue that result from logging services performed for another business unit that owns the stumpage rights should not be reported by you but by the business unit that owns the stumpage rights. You should only report the revenues from the logging service provided at question 3. e. of the Industry characteristics section.
Exclude:
Shipping charges by contract or common carrier if possible for each product class. If your accounting records do not allow you to provide sales of your reported commodities net of shipping charges, you will be prompted to report your total shipping charges at a later time.
If you manufacture products that are not listed in this section, please enter the product description and relevant amounts at question 2 – All other products of own manufacture sold – please specify below.
Purchases of raw materials and components to be used in the logging or manufacturing process
This section requests a breakdown, by product, of the total reported at question 4. a. – Purchases of raw materials and components of the Industry characteristics section. Please report the cost of raw materials for each individual product used in logging or manufacturing operations.
In reporting the cost of the various items purchased, give the laid-down value at your business unit, (i.e., the amounts after discounts actually paid or payable).
Where quantity information is requested, please provide this information from your records or, if not recorded, provide your best estimate.
Note: If you are involved in contract logging, manufacturing services or custom work, the raw materials and components used in these processes that are owned by the business to which you are providing a service should not be reported here.
Include:
Semi-processed goods, if you are part of a multi-business unit firm and receive semi-processed goods as transfers from the other business units of your firm for further processing. The cost of such goods should be equivalent to the transfer value reported by the shipping unit plus any transportation and handling charges paid by your business unit to common or contract carriers;
Any fuel purchased as an input into the manufacturing process, as a feedstock or processing material (e.g., crude oil processed into gasoline), or for any other non-energy purpose.
Exclude:
Fuel used for energy purposes (e.g., for office or plant heating) - these energy items should be reported in the "Detailed information on energy and water costs or expenses" section.
If you purchased raw materials that are not displayed in this section, please enter the raw material name and relevant amounts at question 2 – All other raw materials and components purchased – Please specify below
Details on this business's locations
General guidelines
This section requests a breakdown of total operating revenues, salaries, wages and commissions for all locations included in this survey. Please report separately for each location (covered by your business unit).
Please indicate if any locations are no longer part of your business unit and should be deleted from the list. If you have added any locations to your business unit, or if any locations are missing from the list, please provide the information on these. The section is designed to account for all personnel on the payroll of your business unit, including those working in ancillary units which form part of your business unit.
Operating revenues represent the revenue generated from the course of normal business operations (e.g., sales and commissions).
Labour expenses
Amounts reported for salaries and wages should be gross, before any deductions from employees for income tax and employee contributions to health, accident, pension, insurance, or other benefits, all of which should be included. Please do this calculation separately for direct and indirect labour at each location. Do not include benefit contributions by the employer.
Direct labour (for logging or manufacturing only)
Include wages for employees engaged in:
Logging and forestry support;
Manufacturing (processing and/or assembling);
Packing, handling, warehousing;
Repair and maintenance, janitorial;
Watchmen;
Foremen doing work similar to their employees;
Erection/installation by own business unit when an extension of your manufacturing operations.
Indirect labour (for administrative and selling or operating only)
Please report gross salaries. Do not include workers that are not on your payroll.
Include salaries for:
Executives, administrators and office staff;
Sales staff;
Food service staff;
Building construction and major renovation staff (when work is chargeable to fixed asset accounts);
Machinery and equipment repair staff (when work is chargeable to fixed asset accounts).
Please indicate whether each specific location operated for the full reporting period or part of it. If a location did not operate for the full year, please provide an explanation in the space provided (e.g. seasonal operations, strike, plant closure, etc.)
Detailed information on energy and water costs or expenses
Please report information on all purchased energy, water utility expenses and electricity purchased by your business unit for energy purposes only. Answers to the detailed questions should cover amounts used by your business unit in all plant and office operations and any support units which are part of your business unit. Do not report fuel consumed as fuel purchased unless the amounts are substantially the same (or unless you can only report consumption)
Include:
Transportation costs, duties, etc. which form part of the laid-down cost at your business unit.
Exclude:
Any fuel purchased to be used as an input into the manufacturing process as a feedstock or processing material or for any other non-energy purposes (e.g., a raw material for products such as chemicals, synthetic rubber and a variety of plastics).
1. Electricity
Please report the delivered cost of purchased electricity.
2. Gasoline
The cost of purchased gasoline includes that used for all plant operations.
Exclude:
Fuel for motor vehicle use
3. Light fuel oil
Please report the total value of purchased light fuel oil for this reporting period.
Include:
Light fuel oil includes all distillate type fuels for power burners;
Fuel oil no.2 (heating oil no. 2);
Fuel oil no.3 (heating oil no. 3);
Furnace fuel oil;
Gas oils;
Light industrial fuel.
4. Heavy fuel oil
Please report the total value of purchased heavy fuel oil for this reporting period.
Include:
All grades of residual type fuels for steam or diesel engines (non-vehicle use);
Bunker B and Bunker C;
Fuel oils no. 4, 5 and 6
Residual fuel oil.
5. Diesel fuel
Please report the total value of purchased diesel fuel for the current reporting period
Exclude:
Fuel for motor vehicle use.
6. Liquefied petroleum gas (e.g., propane, butane)
Please report the total value of purchased liquefied petroleum gases (LPG) for this reporting period. LPG's comprise normally gaseous paraffinic compounds extracted from refinery gases.
Exclude:
Fuel for motor vehicle use
7. Natural gas
Please report the total value of purchased natural gas, which comprises a mix of hydrocarbon compounds and small quantities of various non-hydrocarbons existing in a gaseous phase.
Exclude:
Fuel for motor vehicle use
8. Coal
Please report the total value of purchased coal for this reporting period.
9. Water Utilities
Please report the total value of water utility costs. Note that in some municipalities, water utilities are included in the municipal tax bill. If this case applies to you, please enter the amount if it is itemized on your tax bill.
10. Other energy and water expenses - specify:
Please report the total value of all other purchased energy types not specified elsewhere, e.g., steam, oxygen or hydrogen.
11. Total energy and water expenses
(sum of lines 1 to 10)
How can I obtain data from Statistics Canada?
Inquiry service
Ask about our most recent data by:
Telephone: 1-800-263-1136
Telecommunications device for the hearing impaired: 1-800-363-7629
PLEASE REMEMBER TO SIGN YOUR NAME AT THE END OF THE QUESTIONNAIRE
For further information and assistance
Remember, if you are experiencing difficulty in completing the survey or if you are not sure about how to respond to a specific question, please call us at1-800-858-7921 and someone will be happy to assist you.
Please keep a copy of this questionnaire accessible in case you receive an enquiry from our staff. It could also serve as a guide to completing next year's survey, if necessary.
Thank you for your cooperation.
Remember, all data provided are kept confidential.
Please retain a copy for your records.
This guide is designed to assist you as you complete the 2016 Annual Civil Aviation Survey. If you need more information, please call the Statistics Canada Help Line at the number below.
Your answers are confidential.
Statistics Canada is prohibited by law from releasing any information it collects which could identify any person, business, or organization, unless consent has been given by the respondent or as permitted by the Statistics Act.
Statistics Canada will use information from this survey for statistical purposes.
This section verifies or requests basic identifying information of the business or organization such as legal name, operating name (if applicable), contact information of the designated contact person, current operational status, and main activity(ies).
1. Legal name and Operating name
Legal Name
The legal name is one recognized by law, thus it is the name liable for pursuit or for debts incurred by the business or organization. In the case of a corporation, it is the legal name as fixed by its charter or the statute by which the corporation was created.
Modifications to the legal name should only be done to correct a spelling error or typo.
To indicate a legal name of another legal entity you should instead indicate it in question 3 by selecting 'Not currently operational' and then choosing the applicable reason and providing the legal name of this other entity along with any other requested information.
Operating Name
The operating name is a name the business or organization is commonly known as if different from its legal name. The operating name is synonymous with trade name.
2. Designated contact person
Verify or provide the requested contact information of the designated business or organization contact person.The designated contact person is the person who should receive this questionnaire.The designated contact person may not always be the one who actually completes the questionnaire.If different than the designated contact person, the contact information of the person completing the questionnaire can be indicated later in the questionnaire.
3. Current operational status
Verify or provide the current operational status of the business or organization identified by the legal and operating name in question 1.If indicating the operational status of the business or organization is 'Not currently operational' then indicate an applicable reason and provide the requested information.
4. Main activity
This question verifies the business or organization's current main activity as classified by the North American Industry Classification System (NAICS). The North American Industry Classification System (NAICS) is an industry classification system developed by the statistical agencies of Canada, Mexico and the United States. Created against the background of the North American Free Trade Agreement, it is designed to provide common definitions of the industrial structure of the three countries and a common statistical framework to facilitate the analysis of the three economies. NAICS is based on supply-side or production-oriented principles, to ensure that industrial data, classified to NAICS, are suitable for the analysis of production-related issues such as industrial performance.
The target entity for which NAICS is designed are businesses and other organizations engaged in the production of goods and services. They include farms, incorporated and unincorporated businesses and government business enterprises. They also include government institutions and agencies engaged in the production of marketed and non-marketed services, as well as organizations such as professional associations and unions and charitable or non-profit organizations and the employees of households.
The associated NAICS should reflect those activities conducted by the business or organizational unit(s) targeted by this questionnaire only, as identified in the 'Answering this questionnaire' section and which can be identified by the specified legal and operating name. The main activity is the activity which most defines the targeted business or organization's main purpose or reason for existence. For a business or organization that is for-profit, it is normally the activity that generates the majority of the revenue for the entity.
The NAICS classification contains a limited number of activity classifications; the associated classification might be applicable for this business or organization even if it is not exactly how you would describe this business or organization's main activity.
Please note that any modifications to the main activity through your response to this question might not necessarily be reflected prior to the transmitting of subsequent questionnaires and as a result they may not contain this updated information.
If the current NAICS associated with this business or organizations is not correct, please provide a brief description of the main activity and provide any additional information as requested.
Balance Sheet, Annual – Statement 20 (II, III)
Financial assets
Current assets
Include:
cash, bank balances (including deposits in transit, special deposits for the payments of debts, and so on) and short-term investments due within one year from the date of the balance sheet;
current accounts and notes receivable as well as other current assets such as inventories, charges to subscribers on transportation contracts, interests and dividends receivable, and so on.
All other financial assets – (Include investments and special funds.)
Include investments in associated companies, other investments such as investments in stocks, bonds, and so on, and special funds such as equipment purchase funds, funds set aside for such special purposes as contractual deposits, pension funds, self-insurance funds, and so on.
Property and equipment
Operating - property and equipment – (Include capital leases.)
Include:
ground property and equipment (including flight equipment) owned and/or under capital leases;
the cost of aircraft (airframes), aircraft engines, propellers, components (aircraft communication and navigational equipment) and spare parts that have been purchased outright;
the cost of non-airborne communication and meteorological equipment, ramp equipment, maintenance and engineering equipment, surface transport vehicles and equipment, furniture, fixtures and office equipment, buildings and land as well as miscellaneous ground equipment such as medical equipment, airport and lighting equipment, passenger service equipment, hotel, restaurant and food service equipment, storage and distribution equipment. Property and equipment under capital leases includes the cost of property and equipment under a capital or finance lease, in other words, a lease for a period considered to be the whole or nearly the whole life of the property or equipment.
Accumulated depreciation and amortization - property and equipment
Include:
accumulated depreciation and amortization of ground property and equipment (including flight equipment) owned and/or under capital leases;
accrued charges representing losses, not replaced by current repairs, occurring in physical property and suffered through current lessening of service value due to wear and tear from use and the action of time and the elements; and losses occurring through obsolescence, supersession, new technological developments, changes in popular demand and the requirements of public authority.
Non-operating property and equipment – (Include capital leases.)
Include the cost of all non-operating property and equipment, in other words, all property and equipment not included in the "operating" category above.
Accumulated depreciation and amortization - non-operating property and equipment
Include accumulated depreciation and amortization of the non-operating property and equipment.
All other assets
Include long-term prepayments, developmental and pre-operating costs such as the cost of extraordinary training, unamortized discounts and expenses on the issue of long-term debt securities, property acquisition adjustments, other intangibles such as payments made for patents, copyrights, and so on, and other deferred charges.
Total assets
The sum of the assets above less the accumulated depreciation and amortization.
Liabilities and capital
Current liabilities
Include:
current accounts and traffic balances payable, including balances subject to current settlement and payable to associated companies and/or shareholders, and notes payable on demand or within one year from the date of the balance sheet;
the current portion of long-term debt and the current obligations under capital leases;
air traffic liabilities (unearned transportation revenue), which includes the value of passenger tickets sold but not used or refunded as of the date of the balance sheet, and pre-paid amounts for the transportation of baggage, freight and mail for which the transportation has not occurred as of the date of the balance sheet;
salaries and wages accrued and unpaid, taxes accrued and unpaid, dividends payable, deposits by subscribers on transportation contracts (air travel plan liabilities, in other words, deposits received under air travel plan contracts) and other current and accrued liabilities.
Advances from associated companies and/or shareholders
Include the net amount from associated companies and/or shareholders for notes, loans or advances which are not currently settled.
Long-term debt and other non-current liabilities – (Include capital leases.)
Include:
the face value or principal amount of debt securities (for example, bonds, trust certificates, debentures, notes) issued and assumed by the air carrier and in the hands of others, which is not payable within twelve months of the balance sheet date;
long-term obligations under capital leases, which refers to the present value of unexpired contracts for the acquisition of aircraft under such lease arrangements.
Deferred income taxes
Include taxes that will be owed on income, but that have not yet been assessed.
All other liabilities
Include:
deferred credits which correspond to unamortized premiums on all classes of long-term debt, and other deferred credits such as securities issued or assumed by the air carrier, and other unadjusted accounts that cannot be cleared as of the date of the balance sheet;
provisions for major overhauls such as for flight equipment (in other words, liabilities of uncertain value or timing associated with the complete disassembly and inspection or repair of an aircraft, engine or other component of an aircraft) and other provisions such as liabilities of uncertain value or timing.
Shareholders' equity
Capital stock
Include the equity capital invested in a business through the purchase of various classes of common and preferred shares.
Retained earnings
Include the portion of after-tax profits left over, after dividends have been paid to shareholders, for reinvestment into the company. If this account is negative, then the amount indicated for this item should be shown with a negative (-) sign.
All other items
Include other paid-in capital and reserves. Other paid-in capital or contributed surplus includes the premiums or discounts that have resulted from selling stock, and stock received from donations. Reserves include any reserve fund such as reserve for self-insurance, reserve for pension, reserves against potential future losses, and so on. Also, include proprietorship or partnership accounts (balance year-end).
Total liabilities and capital
The sum of liabilities and capital plus the sum of shareholders' equity which should equal total assets.
Statement of Revenues and Expenses, Annual – Statement 21 (I, II)
Scheduled services
Transportation of passengers or goods, or both, by an aircraft provided by an air carrier that operates the air service and that, directly or indirectly, sells some or all of its seats or part or all of its cargo space to the public on a price per seat, price per unit of mass or price per volume of cargo basis.
Charter services
Transportation of passengers or goods, or both, by aircraft pursuant to a contract under which a person, other than the air carrier that operates the air service, or its agent, reserves a block of seats or part of the cargo space of an aircraft for the person's use or for resale to the public.
Include air ambulance service and the movement of people and goods to logging or heli-logging sites.
Refers to the revenue earned from the transportation of passengers on scheduled and charter services. Include revenue from all surcharges (baggage, fuel, seat selection, and so on) that are retained by the air carrier. Exclude amounts such as taxes, navigation fees, security fees, and so on that are collected but passed on to other entities.
Goods revenue
Refers to the revenue earned from the transportation of goods on scheduled and charter services. Exclude taxes such as the Goods and Services Tax (GST), Harmonized Sales Tax (HST) or Provincial Sales Tax (PST).
All other flight-related revenue
Refers to the revenue earned from air transport activities not included in passenger revenue or goods revenue. Include revenue from other flying services such as flying training, recreational flying and other specialty flying.
All other revenue
Include subsidies and revenue earned from all other sources.
Total operating revenue
The sum of passenger revenue, goods revenue, other flight-related revenue and revenue from all other sources.
Operating expenses - Ground property and equipment maintenance
Employee wages, salaries and benefits
Direct labour costs (wages and salaries) expended on the maintenance of ground property and equipment.
Include benefits such as employer contributions to pensions, medical benefits, insurance, and so on.
All other maintenance - ground property and equipment expenses
Expenses, both direct and indirect, incurred in the repair and upkeep of ground property and equipment.
Include materials and supplies, purchased repair services and all other related expenses.
Total maintenance - ground property and equipment expenses
The sum of the previous two expense items.
Operating expenses - Aircraft operations
Flight crew wages, salaries and benefits
Include the wages, salaries and benefits for flight crews (pilot, co-pilot, navigator, and so on).
Include benefits such as employer contributions to pensions, medical benefits, insurance, and so on and layover expenses such as hotels and meals.
Aircraft fuel and oil
Expenses for turbo fuel, gasoline and all other fuel and oil consumed such as turbine oil and piston oil.
Include throughput charges, non-refundable duties and taxes.
Landing fees
Include airport landing fees paid both in Canada and outside of Canada.
Navigation fees
Charges remitted to NAV CANADA or other international suppliers for the provision of air navigation services. Air navigation services include aeronautical communication services, aeronautical information services, aeronautical radio navigation services, air traffic control services, aviation weather services, emergency assistance services and flight information services.
Aircraft insurance
Expenses for insurance against accidental damage to flight equipment while in flight or on the ground and for insurance against liability occurring from the operation of aircraft or, in the case of non-insurance, the resulting expenses for which the carrier is liable.
Aircraft rental
Expenses incurred for the rental of aircraft (and crew) from other carriers, such as in chartering, interchange and operating or short-term lease agreements.
All other aircraft operation expenses
Expenses incurred directly for the in-flight operation and related standby time of aircraft which are not elsewhere classified.
Total aircraft operations expenses
The sum of the previous seven expense items.
Operating expenses - Flight equipment maintenance
Employee wages, salaries and benefits
Direct labour costs (wages and salaries) expended on the maintenance of flight equipment.
Include benefits such as employer contributions to pensions, medical benefits, insurance, and so on.
Materials and supplies
Expenses on materials and supplies for the maintenance of flight equipment.
Purchased repair services
Expenses for repair services for the maintenance of flight equipment purchased from outside suppliers.
All other maintenance - flight equipment expenses
Expenses, both direct and indirect, incurred in the repair and upkeep of flight equipment.
Total maintenance - flight equipment expenses
The sum of the previous four expense items.
Operating expenses - In-flight services
Employee wages, salaries and benefits
Include:
the wages, salaries and benefits paid to cabin crews (flight attendants, and so on);
benefits such as employer contributions to pensions, medical benefits, insurance, and so on, and layover expenses such as hotels and meals.
Passenger food and supplies
Include expenses for in-flight meals, complimentary drinks, and so on, and the cost of supplies and personal services furnished to passengers.
Passenger liability insurance
Include the premiums for passenger liability and accident insurance paid by the carrier.
All other in-flight service expenses
Include passenger-related expenses incurred due to interrupted flights, including hotels, meals, taxi fares and other expense items, the cost of other services provided to passengers, such as pay, allowances and the cost of passenger service personnel, and all other services provided for the comfort of passengers in transit.
Total in-flight service expenses
The sum of the previous four expense items.
Operating expenses - Aircraft and traffic servicing
Employee wages, salaries and benefits
Include:
the wages, salaries and benefits paid to ground personnel;
benefits such as employer contributions to pensions, medical benefits, insurance, and so on.
Purchased services
Expenses for aircraft and traffic servicing purchased from outside suppliers.
All other aircraft and traffic servicing expenses
Include expenses incurred on the ground for scheduling or preparing aircraft for arrival and takeoff, expenses incurred in enplaning and deplaning passenger and cargo traffic, and expenses involved in servicing and handling individual aircraft and traffic on the ground, in preparing aircraft crews for flight assignment, in controlling the in-flight movements of aircraft and the in-flight expenses of handling all traffic including baggage.
Total aircraft and traffic servicing expenses
The sum of the previous three expense items.
Operating expenses - Promotion and sales
Employee wages, salaries and benefits
Include:
the wages, salaries and benefits paid to all staff engaged in reservations, ticketing, sales and promotional activities;
benefits such as employer contributions to pensions, medical benefits, insurance, and so on.
All other promotion and sales expenses
Include:
passenger and cargo commission expenses;
the net commission payable to others for the sale of transportation on the reporting carrier's service less the commission receivable from the reporting carrier's sale of transportation on other carriers' services, advertising and publicity expenses and any related expenses, accommodation costs, agency fees for outside services, expenses associated with reservations, city ticket offices and other sales expenses.
Total promotion and sales expenses
The sum of the previous two expense items.
Operating expenses - Depreciation
Depreciation - flight equipment
Include:
provisions for the depreciation of flight equipment only;
all charges incurred in normal wear and tear on flight equipment which have not been replaced by current year repair, as well as losses in service ability.
All other depreciation
Include:
provisions for the depreciation of all non-flight ground and property equipment;
all charges incurred in normal wear and tear which have not been replaced by current year repair, as well as losses in service ability;
charges for the amortization of capitalized development and other intangible assets.
Total depreciation
The sum of the previous two expense items.
Operating expenses - All other expenses
Include general administration.
Employee wages, salaries and benefits
Include:
the wages, salaries and benefits paid to all employees performing the general and administrative functions of the air carrier;
benefits such as employer contributions to pensions, medical benefits, insurance, and so on.
Exclude all amounts reported in the previous six wages, salaries and benefits categories.
All other expenses
Include:
all operating expenses and general administration expenses not reported elsewhere;
expenses for general financial accounting activities, supplementary labour income, property taxes, building rentals, communications purchased, purchasing activities, representation at law, and all other operational administration expenses not directly applicable to a particular function that are not included in the previous operating expenses categories;
expenses such as incidental air transport-related expenses associated with revenue reported as "all other revenue";
all miscellaneous operating expenses not covered elsewhere;
staff reduction expenses.
Total other expenses
The sum of the previous two expense items.
Total operating expenses
The sum of the eight expenses sub-totals, in other words, Total maintenance - ground property and equipment expenses, Total aircraft operations expenses, and so on.
Operating income
Net operating income (a loss should be a negative number)
Total operating revenue less total operating expenses – calculated from the previous questions.
Non-operating income/expenses
Interest and discount income
Include interest income from all sources and cash discounts on the purchase of materials and supplies.
Interest expenses
Include interest on unpaid taxes and all classes of debt including premiums, discounts and expenses on short-term obligations, amortization of premiums, discounts and expenses on short-term and long-term obligations.
All other net non-operating income (enter a negative number for a loss)
Include:
capital gains (or losses) from retiring operating property and equipment, aircraft equipment, expendable parts, miscellaneous materials and supplies and other assets, when they are sold or otherwise retired from service as part of a general program and not as incidental sales performed as a service to others;
gains or losses made on investments in securities;
net miscellaneous non-operating income or loss, which refers to revenue and expenses attributable to financing or other activities that are not an integral part of the air transportation activities undertaken by the carrier, or its incidental services. These could include dividend income, the balance of all income or losses from affiliated companies reimbursed to the carrier, foreign exchange adjustments and special items, such as restructuring expenses, which do not occur on a regular basis.
Exclude staff reduction expenses which should be included under all other expenses.
Net non-operating income (a loss should be a negative number)
The sum of the previous three income or expense items.
Provision for income taxes
Include the provision for taxes payable on net income for the accounting period and adjustments of income taxes relating to previous years, including provisions for deferred income taxes resulting from differences between accounting income and taxable income that arise when the time of including items of revenue and expense in the computation of accounting income and taxable income do not coincide. If the net amount is negative, then the amount indicated for this item should be shown with a negative (-) sign.
Net income (a loss should be a negative number)
Net operating income plus net non-operating income less the provision for income taxes.
Fuel and oil consumed
Turbo fuel consumed
Include fuel used in both turboprop and jet aircraft.
Provide the quantity and expenses for turbo fuel consumed. Turbo fuel includes the turbine fuel uplifted for all aircraft in the carrier's fleet. Fuel uplift can be determined based on delivery notes or invoices, aircraft onboard measurement systems or, if the fuel was supplied by a customer, estimated based on hours flown. Report the quantity of turbo fuel consumed in litres.
Include turbo fuel consumed for all scheduled and/or charter operations, regardless of where purchased. The expenses for turbo fuel consumed should be reported in Canadian dollars, regardless of where purchased. Include throughput charges, non-refundable duties and taxes. If the fuel was supplied by a customer, an approximate value may be provided based on prevailing market rates.
Conversion factor
To convert gallons (imperial) into litres (l), multiply by 4.546092.
All other fuel and oil consumed
Provide the quantity and expenses for all non-turbo fuel and oil consumed. Report the quantity of all other fuel and oil consumed in litres. The quantity should include gasoline, turbine oil, piston oil and all other types of fuel and oil consumed for all scheduled and/or charter operations, regardless of where purchased. The expenses for all other fuel and oil consumed should be reported in Canadian dollars, regardless of where purchased. Include throughput charges, non-refundable duties and taxes.
Conversion factor
To convert gallons (imperial) into litres (l), multiply by 4.546092.
Total fuel and oil consumed
The sum of the quantities and expenses reported in the previous two items.
Include all employees, temporary or permanent, on the payroll of the air carrier during the reporting period. Include part-time employees, prorated to the amount of time worked when compared to full-time employees (for example, two part-time employees working half-time are equivalent to one full-time employee).
Wages and salaries expenses
Include a breakdown of the wages and salaries paid for each of the six categories of personnel.
Exclude all benefits, in other words, employer contributions to pensions, medical benefits, insurance, and so on or layover expenses, such as hotels and meals, for flight and cabin crews.
Total employees
The sum of the number and the wages and salaries expenses for the six categories of personnel.
Revenue or expenses by area of operation
Passenger revenue
Include a breakdown of the revenue earned from the transportation of passengers for each province, territory and outside of Canada based on where the transportation service was provided. Total passenger revenue should equal the sum of passenger revenue from scheduled services and charter services previously reported.
Goods revenue
Include a breakdown of the revenue earned from the transportation of goods for each province, territory and outside of Canada based on where the transportation service was provided. Total goods revenue should equal the sum of goods revenue from scheduled services and charter services previously reported.
Employee wages and salaries
Include a breakdown of employee wages and salaries for each province, territory and outside of Canada based on where the employees are located. Total employee wages and salaries should equal the total wages and salaries expenses reported in the "Employment" section above.
This survey is conducted by Statistics Canada in order to collect the necessary information to support the Integrated Business Statistics Program (IBSP). This program combines various survey and administrative data to develop comprehensive measures of the Canadian economy.
The statistical information from the IBSP serves many purposes, including:
Calculating each province and territory's fair share of federal-provincial transfer payments for health, education and social programs
Establishing government programs to assist businesses
Assisting the business community in negotiating contracts and collective agreements
Supporting the government in making informed decisions about fiscal, monetary and foreign exchange policies
Indexing social benefit programs and determining tax brackets
Enabling academics and economists to analyze the economic performance of Canadian industries and to better understand rapidly evolving business environments.
Your information may also be used by Statistics Canada for other statistical and research purposes.
Your participation in this survey is required under the authority of the Statistics Act.
Other important information
Authorization to collect this information
Data are collected under the authority of the Statistics Act, Revised Statutes of Canada, 1985, Chapter S-19.
Confidentiality
By law, Statistics Canada is prohibited from releasing any information it collects that could identify any person, business, or organization, unless consent has been given by the respondent, or as permitted by the Statistics Act. Statistics Canada will use the information from this survey for statistical purposes only.
Record linkages
To enhance the data from this survey and to reduce the reporting burden, Statistics Canada may combine the acquired data with information from other surveys or from administrative sources.
Data-sharing agreements
To reduce respondent burden, Statistics Canada has entered into data-sharing agreements with provincial and territorial statistical agencies and other government organizations, which have agreed to keep the data confidential and use them only for statistical purposes. Statistics Canada will only share data from this survey with those organizations that have demonstrated a requirement to use the data.
Section 11 of the Statistics Act provides for the sharing of information with provincial and territorial statistical agencies that meet certain conditions. These agencies must have the legislative authority to collect the same information, on a mandatory basis, and the legislation must provide substantially the same provisions for confidentiality and penalties for disclosure of confidential information as the Statistics Act. Because these agencies have the legal authority to compel businesses to provide the same information, consent is not requested and businesses may not object to the sharing of the data.
For this survey, there are Section 11 agreements with the provincial and territorial statistical agencies of Newfoundland and Labrador, Nova Scotia, New Brunswick, Québec, Ontario, Manitoba, Saskatchewan, Alberta, British Columbia and the Yukon. The shared data will be limited to information pertaining to business establishments located within the jurisdiction of the respective province or territory.
Section 12 of the Statistics Act provides for the sharing of information with federal, provincial or territorial government organizations. Under Section 12, you may refuse to share your information with any of these organizations by writing a letter of objection to the Chief Statistician, specifying the organizations with which you do not want Statistics Canada to share your data and mailing it to the following address:
Chief Statistician of Canada
Statistics Canada
Attention of Director, Enterprise Statistics Division
150 Tunney's Pasture Driveway
Ottawa, Ontario
K1A 0T6
For this survey, there are Section 12 agreements with the statistical agencies of Prince Edward Island, the Northwest Territories and Nunavut and Fisheries and Oceans Canada.
For agreements with provincial and territorial government organizations, the shared data will be limited to information pertaining to business establishments located within the jurisdiction of the respective province or territory.
Additional information
In cases where information is reported on an amalgamated basis and relates to operations in more than one province or territory, Statistics Canada may allocate a portion of the reported information to these provincial or territorial operations. The allocated information will be shared in accordance with the Section 11 or 12 agreements of the Statistics Act, as described above.
In cases where there is a separate head office, Statistics Canada may adjust the reported revenues of that head office so that those revenues more fully reflect the value of the services the head office provides. In such cases, there will be a corresponding adjustment to the reported expenses of the units served. The adjusted information will be shared in accordance with the Section 11 or 12 agreements of the Statistics Act, as described above.
Business or organization and contact information
1. Please verify or provide the business or organization's legal and operating name and correct where needed.
Note: Legal name modifications should only be done to correct a spelling error or typo.
Legal Name
The legal name is one recognized by law, thus it is the name liable for pursuit or for debts incurred by the business or organization. In the case of a corporation, it is the legal name as fixed by its charter or the statute by which the corporation was created.
Modifications to the legal name should only be done to correct a spelling error or typo.
To indicate a legal name of another legal entity you should instead indicate it in question 3 by selecting 'Not currently operational' and then choosing the applicable reason and providing the legal name of this other entity along with any other requested information.
Operating Name
The operating name is a name the business or organization is commonly known as if different from its legal name. The operating name is synonymous with trade name.
Legal name
Operating name (if applicable)
2. Please verify or provide the contact information of the designated business or organization contact person for this questionnaire and correct where needed.
Note: The designated contact person is the person who should receive this questionnaire. The designated contact person may not always be the one who actually completes the questionnaire.
First name
Last name
Title
Preferred language of communication
English
French
Mailing address (number and street)
City
Province, territory or state
Postal code or ZIP code
Country
Canada
United States
Email address
Telephone number (including area code)
Extension number (if applicable)
The maximum number of characters is 5.
Fax number (including area code)
3. Please verify or provide the current operational status of the business or organization identified by the legal and operating name above.
Operational
Not currently operational
Why is this business or organization not currently operational?
Seasonal operations
When did this business or organization close for the season? Date
When does this business or organization expect to resume operations? Date
Ceased operations
When did this business or organization cease operations? Date
Why did this business or organization cease operations?
Bankruptcy
Liquidation
Dissolution
Other
Specify the other reasons for ceased operations
Sold operations
When was this business or organization sold? Date
What is the legal name of the buyer?
Amalgamated with other businesses or organizations
When did this business or organization amalgamate? Date
What is the legal name of the resulting or continuing business or organization?
What are the legal names of the other amalgamated businesses or organizations?
Temporarily inactive but will re-open
When did this business or organization become temporarily inactive? Date
When does this business or organization expect to resume operations? Date
Why is this business or organization temporarily inactive?
No longer operating due to other reasons
When did this business or organization cease operations? Date
Why did this business or organization cease operations?
4. Please verify or provide the current main activity of the business or organization identified by the legal and operating name above.
Note: The described activity was assigned using the North American Industry Classification System (NAICS).
This question verifies the business or organization's current main activity as classified by the North American Industry Classification System (NAICS). The North American Industry Classification System (NAICS) is an industry classification system developed by the statistical agencies of Canada, Mexico and the United States. Created against the background of the North American Free Trade Agreement, it is designed to provide common definitions of the industrial structure of the three countries and a common statistical framework to facilitate the analysis of the three economies. NAICS is based on supply-side or production-oriented principles, to ensure that industrial data, classified to NAICS, are suitable for the analysis of production-related issues such as industrial performance.
The target entity for which NAICS is designed are businesses and other organizations engaged in the production of goods and services. They include farms, incorporated and unincorporated businesses and government business enterprises. They also include government institutions and agencies engaged in the production of marketed and non-marketed services, as well as organizations such as professional associations and unions and charitable or non-profit organizations and the employees of households.
The associated NAICS should reflect those activities conducted by the business or organizational units targeted by this questionnaire only, as identified in the 'Answering this questionnaire' section and which can be identified by the specified legal and operating name. The main activity is the activity which most defines the targeted business or organization's main purpose or reason for existence. For a business or organization that is for-profit, it is normally the activity that generates the majority of the revenue for the entity.
The NAICS classification contains a limited number of activity classifications; the associated classification might be applicable for this business or organization even if it is not exactly how you would describe this business or organization's main activity.
Please note that any modifications to the main activity through your response to this question might not necessarily be reflected prior to the transmitting of subsequent questionnaires and as a result they may not contain this updated information.
The following is the detailed description including any applicable examples or exclusions for the classification currently associated with this business or organization.
Description and examples
This is the current main activity.
This is not the current main activity.
Please provide a brief but precise description of this business or organization's main activity.
e.g., breakfast cereal manufacturing, shoe store, software development
Main activity
5. You indicated that is not the current main activity. Was this business or organization's main activity ever classified as: ?
Yes
No
When did the main activity change? Date
6. Please search and select the industry classification code that best corresponds to this business or organization's main activity.
How to search:
if desired, you can filter the search results by first selecting this business or organization's activity sector
enter keywords or a brief description that best describes this business or organization main activity
press the Search button to search the database for an activity that best matches the keywords or description you provided
then select an activity from the list.
Select this business or organization's activity sector (optional)
Farming or logging operation
Construction company or general contractor
Manufacturer
Wholesaler
Retailer
Provider of passenger or freight transportation
Provider of investment, savings or insurance products
Real estate agency, real estate brokerage or leasing company
Provider of professional, scientific or technical services
Provider of health care or social services
Restaurant, bar, hotel, motel or other lodging establishment
Other sector
Enter keywords or a brief description, then press the Search button
7. You have indicated that the current main activity of this business or organization is: Main Activity. Are there any other activities that contribute significantly (at least 10%) to this business or organization's revenue?
Yes, there are other activities.
No, that is the only significant activity.
Please provide a brief but precise description of this business or organization's secondary activity.
e.g., breakfast cereal manufacturing, shoe store, software development
8. Approximately what percentage of this business or organization's revenue is generated by each of the following activities?
When precise figures are not available, please provide your best estimates.
Percentage of revenue
Table summary
This table contains no data. It is an example of an empty data table used by respondents to provide data to Statistics Canada.
Percentage of revenue
Main Activity
Secondary activity
All other activities
Total percentage
Reporting period information
1. What are the start and end dates of this business's or organization's most recently completed fiscal year?
Note: For the survey, the end date should fall between April 1, YYYY and March 31, YYYY+1 .
Here are twelve common fiscal periods that fall within the targeted dates:
May 1, YYYY-1 to April 30, YYYY
June 1, YYYY-1 to May 31, YYYY
July 1, YYYY-1 to June 30, YYYY
August 1, YYYY-1 to July 31, YYYY
September 1, YYYY-1 to August 31, YYYY
October 1, YYYY-1 to September 30, YYYY
November 1, YYYY-1 to October 31, YYYY
December 1, YYYY-1 to November 30, YYYY
January 1, YYYY to December 31, YYYY
February 1, YYYY to January 31, YYYY+1
March 1, YYYY to February 28, YYYY+1
April 1, YYYY to March 31, YYYY+1 .
Here are other examples of fiscal periods that fall within the required dates:
September 18, YYYY-1 to September 15, YYYY (e.g., floating year-end)
June 1, YYYY to December 31, YYYY (e.g., a newly opened business)
Fiscal Year Start date
Fiscal Year-End date
2. What is the reason the reporting period does not cover a full year?
Select all that apply.
Seasonal operations
New business
Change of ownership
Temporarily inactive
Change of fiscal year
Ceased operations
Other
Specify reason the reporting period does not cover a full year
Revenue
1. For the reporting period of YYYY-MM-DD to YYYY-MM-DD, what was this business's revenue from each of the following sources?
Notes:
a detailed breakdown may be requested in other sections.
these questions are asked of many different industries. Some questions may not apply to this business.
Please report all amounts in thousands of Canadian dollars.
Revenue
a. Sales of goods and services (e.g., fees, admissions, services revenue)
Sales of goods and services are defined as amounts derived from the sale of goods and services (cash or credit), falling within a business's ordinary activities. Sales should be reported net of trade discount, value added tax and other taxes based on sales.
Include sales of finfish, molluscs, aquaculture services, aquaculture by-products, seed, sales of goods purchased for resale and consulting revenue.
Exclude:
transfers into inventory and consignment sales
federal, provincial and territorial sales taxes and excise duties and taxes
intercompany sales in consolidated financial statements.
b. Rental and leasing
Include rental or leasing of apartments, commercial buildings, land, office space, residential housing, investments in co-tenancies and co-ownerships, hotel or motel rooms, long and short term vehicle leasing, machinery or equipment, storage lockers, et cetera. c. Commissions
c. Commissions
Include commissions earned on the sale of products or services by businesses such as advertising agencies, brokers, insurance agents, lottery ticket sales, sales representatives, and travel agencies - compensation could also be reported under this item (e.g., compensation for collecting sales tax)
d. Subsidies (government assistance to offset certain eligible current expenses or to supplement current revenue)
Include:
grants, donations and fundraising
non-repayable grants, contributions and subsidies from all levels of government
revenue from private sector (corporate and individual) sponsorships, donations and fundraising.
e. Royalties, rights, licensing and franchise fees
A royalty is defined as a payment received by the holder of a copyright, trademark or patent.
Include revenue received from the sale or use of all intellectual property rights of copyrighted materials such as musical, literary, artistic or dramatic works, sound recordings or the broadcasting of communication signals.
f. Dividends
Include:
dividend income
dividends from Canadian sources
dividends from foreign sources
patronage dividends.
Exclude equity income from investments in subsidiaries or affiliates.
g. Interest
Include:
investment revenue
interest from foreign sources
interest from Canadian bonds and debentures
interest from Canadian mortgage loans
interest from other Canadian sources.
Exclude equity income from investments in subsidiaries or affiliates.
h. Other revenue - specify
Include amounts not included in questions a. to g.
Total revenue
The sum of questions a. to h.
Revenue
Table summary
This table contains no data. It is an example of an empty data table used by respondents to provide data to Statistics Canada.
CAN$ '000
Sales of goods and services
Rental and leasing
Commissions
Subsidies
Royalties, rights, licensing and franchise fees
Dividends
Interest
Other
Total revenue
2. In order to reduce future follow-up, please select one of the following options.
The reported value for total revenue $ ###### is significantly different than the $ ###### reported last reporting period.
I confirm that all values are correct.
I am unable to confirm that all values are correct.
The reported value for sales of goods and services $ ###### is significantly different than the $ ###### reported last reporting period.
I confirm that all values are correct.
I am unable to confirm that all values are correct.
Expenses
1. For the reporting period of of YYYY-MM-DD to YYYY-MM-DD , what were this business's expenses for the following items?
Notes:
a detailed breakdown may be requested in other sections.
these questions are asked of many different industries. Some questions may not apply to this business.
Please report all amounts in thousands of Canadian dollars.
Expenses
a. Purchases
Many business units distinguish their costs of materials from their other business expenses (selling, general and administrative). This item is included to allow you to easily record your costs/expenses according to your normal accounting practices.
Include: feed, therapeutants, purchases of fish eggs, live fish, mollusc seed, spat and live larvae for grow-out or processing and purchases of goods for resale b. Employment costs and expenses
(for all employees who were issued a T4)
b1. Salaries, wages and commissions
Please report all salaries and wages (including taxable allowances and employment commissions as defined on the T4 - statement of remuneration paid) before deductions for this reporting period.
Include:
vacation pay
bonuses (including profit sharing)
employee commissions
taxable allowances (e.g.,room and board, vehicle allowances, gifts such as airline tickets for holidays)
severance pay.
Exclude all payments and expenses associated with casual labour and outside contract workers (report at Subcontracts).
b2. Employee benefits
Include contributions to:
health plans
insurance plans
employment insurance
pension plans
workers' compensation
association dues
contributions to any other employee benefits such as child care and supplementary unemployment benefit (SUB) plans
contributions to provincial and territorial health and education payroll taxes.
c. Subcontracts
Subcontract expense refers to the purchasing of services from outside of the company rather than providing them in-house.
Include:
hired casual labour and outside contract workers
custom work and contract work
subcontract and outside labour
hired labour.
d. Research and development fees
Expenses from activities conducted with the intention of making a discovery that could either lead to the development of new products or procedures, or to the improvement of existing products or procedures.
e. Professional and business fees
Include:
legal services
accounting and auditing fees
consulting fees
education and training fees
appraisal fees
management and administration fees
property management fees
information technology (IT) consulting and service fees (purchased)
architectural fees
engineering fees
scientific and technical service fees
other consulting fees (management, technical and scientific)
veterinary fees
fees for human health services
payroll preparation fees
all other professional and business service fees.
Exclude service fees paid to head office (report at Other).
f. Utilities
Utility expenses related to operating your business unit such as water, electricity, gas, heating and hydro.
Include:
diesel, fuel wood, natural gas, oil and propane
sewage.
Exclude:
energy expenses covered in your rental and leasing contracts
telephone, Internet and other telecommunications
vehicle fuel (report at Other).
g. Office and computer-related expenses
Include:
office stationery and supplies, paper and other supplies for photocopiers, printers and fax machines
postage and courier (used in the day-to-day office business activity)
diskettes and computer upgrade expenses
data processing.
Exclude telephone, Internet and other telecommunication expenses (report at Telephone, Internet and other communication).
h. Telephone, Internet and other telecommunication
Include:
Internet
telephone and telecommunications
cellular telephone
fax machine
pager.
i. Business taxes, licenses and permits
Include:
property taxes paid directly and property transfer taxes
vehicle license fees
beverage taxes and business taxes
trade license fees
membership fees and professional license fees
provincial capital tax.
j. Royalties, franchise fees and memberships
Include:
amounts paid to holders of patents, copyrights, performing rights and trademarks
gross overriding royalty expenses and direct royalty costs
resident and non-resident royalty expenses
franchise fees.
Exclude Crown royalties.
k. Crown charges
Federal or provincial royalty, tax, lease or rental payments made in relation to the acquisition, development or ownership of Canadian resource properties.
Include:
Crown royalties
Crown leases and rentals
oil sand leases
stumpage fees.
l. Rental and leasing
Include:
lease rental expenses, real estate rental expenses, condominium fees and equipment rental expenses
motor vehicle rental and leasing expenses
studio lighting and scaffolding
machinery and equipment rental expenses
storage expenses
road and construction equipment rental
fuel and other utility costs covered in your rental and leasing contracts.
m. Repair and maintenance
Include:
buildings and structures
machinery and equipment
security equipment
vehicles
costs related to materials, parts and external labour associated with these expenses
janitorial and cleaning services and garbage removal.
n. Amortization and depreciation
Include:
direct cost depreciation of tangible assets and amortization of leasehold improvements
amortization of intangible assets (e.g., amortization of goodwill, patents, franchises, copyrights, trademarks, deferred charges, organizational costs).
o. Insurance
Insurance recovery income must be deducted from insurance expenses.
Include:
professional and other liability insurance
motor vehicle and property insurance
executive life insurance
bonding, business interruption insurance and fire insurance.
p. Advertising, marketing, promotion, meals and entertainment
Include:
newspaper advertising and media expenses
catalogues, presentations and displays
tickets for theatre, concerts and sporting events for business promotion
fundraising expenses
meals, entertainment and hospitality purchases for clients.
Exclude interest expenses (report at Interest expense).
s. Interest expense
Report the cost of servicing your company's debt.
Include:
interest
bank charges
finance charges
interest payments on capital leases
amortization of bond discounts
interest on short-term and long-term debt, mortgages, bonds and debentures.
t. Other non-production-related costs and expenses
Include:
charitable donations and political contributions
bad debt expense
loan losses
provisions for loan losses (minus bad debt recoveries)
inventory adjustments.
u. All other costs and expenses (including intracompany expenses)
Include:
management fees, transportation, shipping, warehousing/storage, postage and courier, processing services and veterinary fees
production costs
gross overriding royalties
other producing property rentals
other lease rentals
other direct costs
equipment hire and operation
freight-in and duty
overhead expenses allocated to costs of sales
other expenses
cash over/short (negative expenses)
reimbursement of parent company expenses
warranty expenses
recruiting expenses
general and administrative expenses
interdivisional expenses
interfund transfers (minus expense recoveries)
exploration and development
amounts not included in questions a. to t. above.
Total expenses
The sum of questions a. to u.
Expenses
Table summary
This table contains no data. It is an example of an empty data table used by respondents to provide data to Statistics Canada.
CAN$ '000
Purchases
Employment costs and expenses
Salaries, wages and commissions
Employee benefits
Subcontracts
Research and development fees
Professional and business fees
Utilities
Office and computer-related expenses
Telephone, Internet and other telecommunication
Business taxes, licenses and permits
Royalties, franchise fees and memberships
Crown charges
Rental and leasing
Repair and maintenance
Amortization and depreciation
Insurance
Advertising, marketing, promotion, meals and entertainment
Travel, meetings and conventions
Financial services
Interest expense
Other non-production-related costs and expenses
Other
Total expenses
2. In order to reduce future follow-up, please select one of the following options.
The reported value for total expenses $ ###### is significantly different than the $ ###### reported last reporting period.
I confirm that all values are correct.
I am unable to confirm that all values are correct.
The reported value for salaries, wages and commissions $ ###### is significantly different than the $ ###### reported last reporting period.
I confirm that all values are correct.
I am unable to confirm that all values are correct.
The reported value for employee benefits $ ###### is significantly different than the $ ###### reported last reporting period.
I confirm that all values are correct.
I am unable to confirm that all values are correct.
Industry characteristics
1. What were this business's sales for each of the following goods and services?
Notes:
please report all amounts in thousands of Canadian dollars.
Include all sales within or outside Canada recorded in your accounts for sales to other businesses and for transfers to other units of your business.
Exclude GST/HST, PST and QST.
Sales
Sales should be reported net of excise and provincial or territorial sales taxes, HST/GST, trade discounts, returns and allowances and charges for outward transportation by common or contract carriers. Sales denominated in foreign currency should be converted into Canadian dollars at the exchange rate on the day of transaction. Dollar amounts and percentages should be rounded to whole numbers. When precise figures are not available, please provide your best estimate.
a. to f. Production of finfish (hatchery or grow-out)
This category is comprised of establishments primarily engaged in farm-raising finfish. These establishments use some form of intervention in the rearing process to enhance production, such as keeping animals in captivity, regular stocking and feeding of animals, and protecting them from predators.
Finfish production is reported as gutted head-on and the value is based on a farm-gate value.
Exclude establishments primarily engaged in catching or taking fish and other aquatic animals from their natural habitat.
g. to j. Production of shellfish (seed or grow-out)
This category is comprised of establishments primarily engaged in farm-raising shellfish. These establishments use some form of intervention in the rearing process to enhance production, such as keeping animals in captivity, regular stocking and feeding of animals, and protecting them from predators.
Shellfish is reported as whole, and the value is based on a farm-gate value.
Exclude establishments primarily engaged in catching or taking fish and other aquatic animals from their natural habitat.
l. Sales of goods purchased for resale
Report sales of goods that have not been processed or altered in your business unit and that have been purchased and resold in the same condition.
Sales
Table summary
This table contains no data. It is an example of an empty data table used by respondents to provide data to Statistics Canada.
CAN$ '000
Whole fish dressed, fresh or chilled
Fish eggs and live fish for grow-out
Whole fish live
Whole fish dressed and frozen
Fish fillets, fresh or frozen and other fish meat
Fish, dried, smoked or in brine
Oysters
Mussels
Clams
Scallops
Aquaculture services
Sales of goods purchased for resale
Consulting revenue
Other
Total sales of goods and services
In order to reduce future follow-up, please select one of the following options.
You did not report any revenue from shellfish products, but you did in the previous year.
I confirm that all values are correct.
I am unable to confirm that all values are correct.
2. What were this business's expenses for each of the following goods and services?
Notes:
please report all amounts in thousands of Canadian dollars.
Include all expenses within or outside Canada recorded by this business unit.
Exclude GST/HST, PST and QST.
Materials, components and supply expenses
Exclude capital expenditures.
g. Management fees or any other service fees paid to head office and other business support units
Management fees or any other service fees paid to head office (e.g., legal fees, advertising fees, insurance) and other business support units (e.g., warehouses, sales centres, trucking facilities).
h. to j. Purchased service expenses
Purchased service expenses are services purchased from external businesses (e.g., third parties). Exclude purchased services that have been reported at question g. (management fees or any other service fees paid to head office and other business support units).
h. Transportation, shipping (contracted out), warehousing, storage, postage and courier
Report transportation and storage costs/expenses if they can be reported separately from purchases.
Include:
freight transport services by air, sea, or land (including rental with operator)
postage and courier expenses (including local messenger and delivery)
storage or warehousing services
moving services.
Exclude shipping using your own vehicles.
i. Processing services
Processing services are the costs incurred when another company provides services related to gutting, cleaning, slitting or shelling.
Expenses
Table summary
This table contains no data. It is an example of an empty data table used by respondents to provide data to Statistics Canada.
CAN$ '000
Feed
Therapeutants
Purchases of fish eggs, live fish, mollusc seed, spat and live larvae for grow-out
Purchases of fish eggs, live fish, mollusc seed, spat and live larvae for processing
Purchases of goods for resale
Other
Management fees or any other service fees paid to head office and other business support units
Transportation, shipping (contracted out), warehousing, storage, postage and courier
Processing services
Veterinary fees
3. What were this business's inventories for each of the following goods?
Notes:
Inventories are to be reported at book value (i.e., the value maintained in the accounting records).
Please report all amounts in thousands of Canadian dollars.
Include inventory owned by this business unit within or outside Canada (including inventory held at any warehouse, selling outlet, in transit or on consignment).
Exclude inventory held on consignment for others.
Inventories
Table summary
This table contains no data. It is an example of an empty data table used by respondents to provide data to Statistics Canada.
Value of opening inventory CAN$ '000
Value of closing inventory CAN$ '000
Raw materials
Goods in process
Finished products
Goods purchased for resale
Value of total inventory
In order to reduce future follow-up, please select one of the following options.
You reported revenue from fish products, but you did not report any value of opening inventory.
I confirm that all values are correct.
I am unable to confirm that all values are correct.
4. What was the average number of people employed during the reporting period?
Include full-time, part-time and temporary employees and employees absent with pay.
Exclude contract workers who are not part of your payroll.
Number
Changes or events
1. Indicate any changes or events that affected the reported values for this business or organization, compared with the last reporting period.
Select all that apply.
Strike or lock-out
Exchange rate impact
Price changes in goods or services sold
Contracting out
Organisational change
Price changes in labour or raw materials
Natdiural saster
Recession
Change in product line
Sold business units
Expansion
New or lost contract
Plant closures
Acquisition of business units
Other
Specify the other changes or events
No changes or events
Contact person
1. Statistics Canada may need to contact the person who completed this questionnaire for further information.
Is Provided Given Names Provided Family Name the best person to contact?
Yes
No
Who is the best person to contact about this questionnaire?
First name
Last name
Title
Email address
Telephone number (including area code)
Extension number (if applicable) The maximum number of characters is 5.
Fax number (including area code)
Feedback
1. How long did it take to complete this questionnaire?
Include the time spent gathering the necessary information.
Hours
Minutes
2. We invite your comments about this questionnaire.
This survey is conducted by Statistics Canada in order to collect the necessary information to support the Integrated Business Statistics Program (IBSP). This program combines various survey and administrative data to develop comprehensive measures of the Canadian economy.
The statistical information from the IBSP serves many purposes, including:
Calculating each province and territory's fair share of federal-provincial transfer payments for health, education and social programs
Establishing government programs to assist businesses
Assisting the business community in negotiating contracts and collective agreements
Supporting the government in making informed decisions about fiscal, monetary and foreign exchange policies
Indexing social benefit programs and determining tax brackets
Enabling academics and economists to analyze the economic performance of Canadian industries and to better understand rapidly evolving business environments.
Your information may also be used by Statistics Canada for other statistical and research purposes.
Your participation in this survey is required under the authority of the Statistics Act.
Other important information
Authorization to collect this information
Data are collected under the authority of the Statistics Act, Revised Statutes of Canada, 1985, Chapter S-19.
Confidentiality
By law, Statistics Canada is prohibited from releasing any information it collects that could identify any person, business, or organization, unless consent has been given by the respondent, or as permitted by the Statistics Act. Statistics Canada will use the information from this survey for statistical purposes only.
Record linkages
To enhance the data from this survey and to reduce respondent burden, Statistics Canada may combine it with information from other surveys or from administrative sources.
Data-sharing agreements
To reduce respondent burden, Statistics Canada has entered into data-sharing agreements with provincial and territorial statistical agencies and other government organizations, which have agreed to keep the data confidential and use them only for statistical purposes. Statistics Canada will only share data from this survey with those organizations that have demonstrated a requirement to use the data.
Section 11 of the Statistics Act provides for the sharing of information with provincial and territorial statistical agencies that meet certain conditions. These agencies must have the legislative authority to collect the same information, on a mandatory basis, and the legislation must provide substantially the same provisions for confidentiality and penalties for disclosure of confidential information as the Statistics Act. Because these agencies have the legal authority to compel businesses to provide the same information, consent is not requested and businesses may not object to the sharing of the data.
For this survey, there are Section 11 agreements with the provincial and territorial statistical agencies of Newfoundland and Labrador, Nova Scotia, New Brunswick, Québec, Ontario, Manitoba, Saskatchewan, Alberta, British Columbia and the Yukon. The shared data will be limited to information pertaining to business establishments located within the jurisdiction of the respective province or territory.
Section 12 of the Statistics Act provides for the sharing of information with federal, provincial or territorial government organizations. Under Section 12, you may refuse to share your information with any of these organizations by writing a letter of objection to the Chief Statistician, specifying the organizations with which you do not want Statistics Canada to share your data and mailing it to the following address:
Chief Statistician of Canada
Statistics Canada
Attention of Director, Enterprise Statistics Division
150 Tunney's Pasture Driveway
Ottawa, Ontario
K1A 0T6
For this survey, there are Section 12 agreements with the statistical agencies of Prince Edward Island, the Northwest Territories and Nunavut.
For agreements with provincial and territorial government organizations, the shared data will be limited to information pertaining to business establishments located within the jurisdiction of the respective province or territory.
Business or organization and contact information
1. Please verify or provide the business or organization's legal and operating name and correct where needed.
Note: Legal name modifications should only be done to correct a spelling error or typo.
Legal Name
The legal name is one recognized by law, thus it is the name liable for pursuit or for debts incurred by the business or organization. In the case of a corporation, it is the legal name as fixed by its charter or the statute by which the corporation was created.
Modifications to the legal name should only be done to correct a spelling error or typo.
To indicate a legal name of another legal entity you should instead indicate it in question 3 by selecting 'Not currently operational' and then choosing the applicable reason and providing the legal name of this other entity along with any other requested information.
Operating Name
The operating name is a name the business or organization is commonly known as if different from its legal name. The operating name is synonymous with trade name.
Legal name
Operating name (if applicable)
2. Please verify or provide the contact information of the designated business or organization contact person for this questionnaire and correct where needed.
Note: The designated contact person is the person who should receive this questionnaire. The designated contact person may not always be the one who actually completes the questionnaire.
First name
Last name
Title
Preferred language of communication
English
French
Mailing address (number and street)
City
Province, territory or state
Postal code or ZIP code
Country
Canada
United States
Email address
Telephone number (including area code)
Extension number (if applicable)
The maximum number of characters is 5.
Fax number (including area code)
3. Please verify or provide the current operational status of the business or organization identified by the legal and operating name above.
Operational
Not currently operational
Why is this business or organization not currently operational?
Seasonal operations
Ceased operations
Sold operations
Amalgamated with other businesses or organizations
Temporarily inactive but will re-open
No longer operating due to other reasons
When did this business or organization close for the season? Date
When does this business or organization expect to resume operations? Date
When did this business or organization cease operations? Date
Why did this business or organization cease operations?
Bankruptcy
Liquidation
Dissolution
Other
Specify the other reasons for ceased operations
When was this business or organization sold? Date
What is the legal name of the buyer?
When did this business or organization amalgamate? Date
What is the legal name of the resulting or continuing business or organization?
What are the legal names of the other amalgamated businesses or organizations?
When did this business or organization become temporarily inactive? Date
When does this business or organization expect to resume operations? Date
Why is this business or organization temporarily inactive?
When did this business or organization cease operations? Date
Why did this business or organization cease operations?
4. Please verify or provide the current main activity of the business or organization identified by the legal and operating name above.
Note: The described activity was assigned using the North American Industry Classification System (NAICS).
This question verifies the business or organization's current main activity as classified by the North American Industry Classification System (NAICS). The North American Industry Classification System (NAICS) is an industry classification system developed by the statistical agencies of Canada, Mexico and the United States. Created against the background of the North American Free Trade Agreement, it is designed to provide common definitions of the industrial structure of the three countries and a common statistical framework to facilitate the analysis of the three economies. NAICS is based on supply-side or production-oriented principles, to ensure that industrial data, classified to NAICS, are suitable for the analysis of production-related issues such as industrial performance.
The target entity for which NAICS is designed are businesses and other organizations engaged in the production of goods and services. They include farms, incorporated and unincorporated businesses and government business enterprises. They also include government institutions and agencies engaged in the production of marketed and non-marketed services, as well as organizations such as professional associations and unions and charitable or non-profit organizations and the employees of households.
The associated NAICS should reflect those activities conducted by the business or organizational units targeted by this questionnaire only, as identified in the 'Answering this questionnaire' section and which can be identified by the specified legal and operating name. The main activity is the activity which most defines the targeted business or organization's main purpose or reason for existence. For a business or organization that is for-profit, it is normally the activity that generates the majority of the revenue for the entity.
The NAICS classification contains a limited number of activity classifications; the associated classification might be applicable for this business or organization even if it is not exactly how you would describe this business or organization's main activity.
Please note that any modifications to the main activity through your response to this question might not necessarily be reflected prior to the transmitting of subsequent questionnaires and as a result they may not contain this updated information.
The following is the detailed description including any applicable examples or exclusions for the classification currently associated with this business or organization.
Description and examples
This is the current main activity.
This is not the current main activity.
Please provide a brief but precise description of this business or organization's main activity.
e.g., breakfast cereal manufacturing, shoe store, software development
Main activity
5. You indicated that is not the current main activity. Was this business or organization's main activity ever classified as: ?
Yes
No
When did the main activity change? Date
6. Please search and select the industry classification code that best corresponds to this business or organization's main activity.
Select this business or organization's activity sector (optional)
Farming or logging operation
Construction company or general contractor
Manufacturer
Wholesaler
Retailer
Provider of passenger or freight transportation
Provider of investment, savings or insurance products
Real estate agency, real estate brokerage or leasing company
Provider of professional, scientific or technical services
Provider of health care or social services
Restaurant, bar, hotel, motel or other lodging establishment
Other sector
7. You have indicated that the current main activity of this business or organization is: Main activity Are there any other activities that contribute significantly (at least 10%) to this business or organization's revenue?
Yes, there are other activities.
No, that is the only significant activity.
Please provide a brief but precise description of this business or organization's secondary activity.
e.g., breakfast cereal manufacturing, shoe store, software development
8. Approximately what percentage of this business or organization's revenue is generated by each of the following activities?
When precise figures are not available, please provide your best estimates.
Approximately what percentage of this business or organization's revenue is generated by each of the following activities - table
Table summary
This table contains no data. It is an example of an empty data table used by respondents to provide data to Statistics Canada.
Percentage of revenue
Main activity
Secondary activity
All other activities
Total percentage
Reporting period information
1. What are the start and end dates of this business's or organization's most recently completed fiscal year?
Note: For the survey, the end date should fall between April 1, YYYY and March 31, YYYY+1 .
Here are twelve common fiscal periods that fall within the targeted dates:
May 1, YYYY-1 to April 30, YYYY
June 1, YYYY-1 to May 31, YYYY
July 1, YYYY-1 to June 30, YYYY
August 1, YYYY-1 to July 31, YYYY
September 1, YYYY-1 to August 31, YYYY
October 1, YYYY-1 to September 30, YYYY
November 1, YYYY-1 to October 31, YYYY
December 1, YYYY-1 to November 30, YYYY
January 1, YYYY to December 31, YYYY
February 1, YYYY to January 31, YYYY+1
March 1, YYYY to February 28, YYYY+1
April 1, YYYY to March 31, YYYY+1 .
Here are other examples of fiscal periods that fall within the required dates:
September 18, YYYY-1 to September 15, YYYY (e.g., floating year-end)
June 1, YYYY to December 31, YYYY (e.g., a newly opened business)
Fiscal Year Start date
Fiscal Year-End date
2. What is the reason the reporting period does not cover a full year?
Select all that apply.
Seasonal operations
New business
Change of ownership
Temporarily inactive
Change of fiscal year
Ceased operations
Other
Specify reason the reporting period does not cover a full year
Revenue
1. For the reporting period of YYYY-MM-DD to YYYY-MM-DD , what was this business's revenue from each of the following sources?
Notes:
a detailed breakdown may be requested in other sections
these questions are asked of many different industries. Some questions may not apply to this business
Please report all amounts in thousands of Canadian dollars.
Revenue
a. Sales of goods and services (e.g., fees, commissions, services revenue)
Report net of returns and allowances
Sales of goods and services are defined as amounts derived from the sale of goods and services (cash or credit), falling within a business's ordinary activities. Sales should be reported net of trade discount, value added tax and other taxes based on sales.
Include:
sales from Canadian locations (domestic and export sales)
transfers to other business units or a head office of your firm.
Exclude:
transfers into inventory and consignment sales
federal, provincial and territorial sales taxes and excise duties and taxes
intercompany sales in consolidated financial statements.
b. Rental and leasing
Include: rental or leasing of apartments, commercial buildings, land, office space, residential housing, investments in co-tenancies and co-ownerships, hotel or motel rooms, long and short term vehicle leasing, machinery or equipment, storage lockers, etc.
c. Commissions
Include: commissions earned on the sale of products or services by businesses such as advertising agencies, brokers, insurance agents, lottery ticket sales, sales representatives and travel agencies - compensation could also be reported under this item (for example, compensation for collecting sales tax)
d. Subsidies (including grants, donations, fundraising and sponsorships)
Include:
non-repayable grants, contributions and subsidies from all levels of government
revenue from private sector (corporate and individual) sponsorships, donations and fundraising.
e. Royalties, rights, licensing and franchise fees
A royalty is defined as a payment received by the holder of a copyright, trademark or patent.
Include revenue received from the sale or use of all intellectual property rights of copyrighted materials such as musical, literary, artistic or dramatic works, sound recordings or the broadcasting of communication signals.
f. Dividends
Include:
dividend income
dividends from Canadian sources
dividends from foreign sources
patronage dividends.
Exclude equity income from investments in subsidiaries or affiliates.
g. Interest
Include:
investment revenue
interest from foreign sources
interest from Canadian bonds and debentures
interest from Canadian mortgage loans
interest from other Canadian sources.
Exclude equity income from investments in subsidiaries or affiliates.
h. Other revenue - please specify
Include amounts not included in questions a. to g.
Total revenue
The sum of sub-questions a. to h.
Other revenue - please specify - table
Table summary
This table contains no data. It is an example of an empty data table used by respondents to provide data to Statistics Canada.
CAN$ '000
Sales of goods and services
Rental and leasing
Commissions
Subsidies
Royalties, rights, licensing and franchise fees
Dividends
Interest
Other
Total revenue
1. In order to reduce future follow-up, please select one of the following options.
The reported value for total revenue $ ###### is significantly different than the $ ###### reported last reporting period.
I confirm that all values are correct.
I am unable to confirm that all values are correct.
The reported sales of goods and services entered $ ###### is significantly different than the $ ###### reported last reporting period.
I confirm that all values are correct.
I am unable to confirm that all values are correct.
E-Commerce
1. For the reporting period of YYYY-MM-DD to YYYY-MM-DD , what was this business's total revenue?
Include sales of goods and services; rental, leasing and property management; commissions; subsidies, grants, donations, fundraising and sponsorships; royalties; rights; licensing and franchise fees; dividends, interest and other revenue.
Please report all amounts in thousands of Canadian dollars.
Total revenue
2. For the reporting period of YYYY-MM-DD to YYYY-MM-DD , did this business have any e-commerce revenue?
E-commerce revenue: sales of goods and services conducted over the Internet with or without online payment.
Include all revenue for which an order is received and commitment to purchase is made via the Internet, although payment can be made by other means, such as orders made on web pages, an extranet, mobile devices or Electronic Data Interchange (EDI).
Exclude orders made by telephone, facsimile or e-mail.
Yes
No
3. Of the $ ###### in total revenue reported, what was the total e-commerce revenue?
If precise figures are not available, please provide your best estimate.
Total e-commerce revenue
4. For the reporting period of YYYY-MM-DD to YYYY-MM-DD , did this business make sales over the Internet through any of the following methods?
Select all that apply.
Mobile app
Include sales through any app, or application, that is downloaded and designed to run on a handheld device such as a smartphone or tablet (for example, places where a user may download these apps include Apple's App Store, Google Play or Blackberry App World).
Company website
Include sales through a browser-based website where your organization maintains control of the content.
Third-party website
Include sales through a browser-based website where a third-party maintains the structure of the website and control of the look and feel while your company only provides the product to be sold (for example, Amazon, Expedia, Etsy).
Electronic Data Interchange (EDI)
A standard format for exchanging business data. EDI is based on the use of message standards, ensuring that all participants use a common language.
Via a mobile app
Via your company website
Via a third-party website
Via Electronic Data Interchange (EDI)
Other
Specify the other methods
5. Does this business have any full-time staff dedicated solely to activities related to e-commerce?
Yes
No
6. Why did this business not make sales over the Internet?
Select all that apply.
Goods and services do not lend themselves to online sales
Prefer to maintain current business model
Lack of skilled workers to implement and maintain e-commerce infrastructure
Cost of development is too high
Security concerns
Other
Specify the other reasons
Expenses
1. For the reporting period of YYYY-MM-DD to YYYY-MM-DD , what were this business's expenses for the following items?
Notes:
a detailed breakdown may be requested in other sections
these questions are asked of many different industries. Some questions may not apply to this business
Please report all amounts in thousands of Canadian dollars.
Expenses
a. Cost of goods sold
Many business units distinguish their costs of materials from their other business expenses (selling, general and administrative). This item is included to allow you to easily record your costs/expenses according to your normal accounting practices.
Include:
cost of raw materials and/or goods purchased for resale - net of discounts earned on purchases
freight in and duty.
Exclude all costs associated with salaries, wages, benefits, commissions and subcontracts (report at Employment costs and expenses, and Subcontracts).
b. Employment costs and expenses
b1. Salaries, wages and commissions
Please report all salaries and wages (including taxable allowances and employment commissions as defined on the T4 - Statement of Remuneration Paid) before deductions for this reporting period.
Include:
vacation pay
bonuses (including profit sharing)
employee commissions
taxable allowances (e.g., room and board, vehicle allowances, gifts such as airline tickets for holidays)
severance pay.
Exclude all payments and expenses associated with casual labour and outside contract workers (report at Subcontracts).
b2. Employee benefits
Include contributions to:
health plans
insurance plans
employment insurance
pension plans
workers' compensation
association dues
contributions to any other employee benefits such as child care and supplementary unemployment benefit (SUB) plans
contributions to provincial and territorial health and education payroll taxes.
c. Subcontracts
Subcontract expense refers to the purchasing of services from outside of the company rather than providing them in-house.
Include:
hired casual labour and outside contract workers
custom work and contract work
subcontract and outside labour
hired labour.
d. Research and development fees
Expenses from activities conducted with the intention of making a discovery that could either lead to the development of new products or procedures, or to the improvement of existing products or procedures.
e. Professional and business fees
Include:
legal services
accounting and auditing fees
consulting fees
education and training fees
appraisal fees
management and administration fees
property management fees
information technology (IT) consulting and service fees (purchased)
architectural fees
engineering fees
scientific and technical service fees
other consulting fees (management, technical and scientific)
veterinary fees
fees for human health services
payroll preparation fees
all other professional and business service fees.
Exclude service fees paid to Head Office (report at All other costs and expenses).
f. Utilities
Utility expenses related to operating your business unit such as water, electricity, gas, heating and hydro.
Include:
diesel, fuel wood, natural gas, oil and propane
sewage.
Exclude:
energy expenses covered in your rental and leasing contracts
telephone, Internet and other telecommunications
vehicle fuel (report at All other costs and expenses).
g. Office and computer related expenses
Include:
office stationery and supplies, paper and other supplies for photocopiers, printers and fax machines
postage and courier (used in the day to day office business activity)
computer and peripherals upgrade expenses
data processing.
Exclude telephone, Internet and other telecommunication expenses (report at Telephone, Internet and other telecommunication).
h. Telephone, Internet and other telecommunication
Include:
internet
telephone and telecommunications
cellular telephone
fax machine
pager.
i. Business taxes, licenses and permits
Include:
property taxes paid directly and property transfer taxes
vehicle license fees
beverage taxes and business taxes
trade license fees
membership fees and professional license fees
provincial capital tax.
j. Royalties, franchise fees and memberships
Include:
amounts paid to holders of patents, copyrights, performing rights and trademarks
gross overriding royalty expenses and direct royalty costs
resident and non-resident royalty expenses
franchise fees.
Exclude Crown royalties
k. Crown charges
Federal or Provincial royalty, tax, lease or rental payments made in relation to the acquisition, development or ownership of Canadian resource properties.
Include:
Crown royalties
Crown leases and rentals
oil sand leases
stumpage fees.
l. Rental and leasing
Include:
lease rental expenses, real estate rental expenses, condominium fees and equipment rental expenses
motor vehicle rental and leasing expenses
studio lighting and scaffolding
machinery and equipment rental expenses
storage expenses
road and construction equipment rental
fuel and other utility costs covered in your rental and leasing contracts.
m. Repair and maintenance
Include:
buildings and structures
machinery and equipment
security equipment
vehicles
costs related to materials, parts and external labour associated with these expenses
janitorial and cleaning services and garbage removal.
n. Amortization and depreciation
Include:
direct cost depreciation of tangible assets and amortization of leasehold improvements
amortization of intangible assets (e.g., amortization of goodwill, patents, franchises, copyrights, trademarks, deferred charges, organizational costs).
o. Insurance
Insurance recovery income should be deducted from insurance expenses.
Include:
professional and other liability insurance
motor vehicle and property insurance
executive life insurance
bonding, business interruption insurance and fire insurance.
p. Advertising, marketing, promotion, meals and entertainment
Include:
newspaper advertising and media expenses
catalogues, presentations and displays
tickets for theatre, concerts and sporting events for business promotion
fundraising expenses
meals, entertainment and hospitality purchases for clients.
exploration and development (including prospect/geological, well abandonment & dry holes, exploration expenses, development expenses)
amounts not included in sub-questions a. to t. above.
Total expenses
The sum of sub-questions a. to u.
Total expenses - table
Table summary
This table contains no data. It is an example of an empty data table used by respondents to provide data to Statistics Canada.
CAN$ '000
Cost of goods sold
Opening inventories
Purchases
Closing inventories
Cost of goods sold
Employment costs and expenses
Salaries, wages and commissions
Employee benefits
Subcontracts
Research and development fees
Professional and business fees
Utilities
Office and computer related expenses
Telephone, Internet and other telecommunication
Business taxes, licenses and permits
Royalties, franchise fees and memberships
Crown charges
Rental and leasing
Repair and maintenance
Amortization and depreciation
Insurance
Advertising, marketing, promotion, meals and entertainment
Travel, meetings and conventions
Financial services
Interest expense
Other non-production-related costs and expenses
Other
Total expenses
1. In order to reduce future follow-up, please select one of the following options.
The value for total expenses $ ###### is significantly different than the $ ###### reported last reporting period.
I confirm that all values are correct.
I am unable to confirm that all values are correct.
I confirm that all values are correct.
I am unable to confirm that all values are correct.
I confirm that all values are correct.
I am unable to confirm that all values are correct.
Industry characteristics
1. What were this business's sales for each of the following goods and services?
Please report all amounts in thousands of Canadian dollars.
Report your gross revenue from the rental and/or operating lease of the following commercial and industrial machinery and equipment (without operator).
Include payments for lease contracts in which the lessor is responsible for maintenance.
Industry characteristics
Please exclude any federal, provincial or territorial sales tax collected for remittance to a government agency.
Sales
Operating leases typically meet certain criteria:
rental and leasing agreements finance the acquisition of equipment and machinery for less than their useful economic life
the lessee can return the machinery and equipment at the end of the lease term without further obligation to the lessor
operators for the machinery and equipment are not provided to the lessee (this does not include repair and maintenance or training services offered by the lessor).
Sales revenues from other types of rental and lease agreements including capital (direct financing) and sales type leases should be reported at Revenue from capital leases.
a. Revenue from rental and/or operating lease agreements for computers and peripherals
Include renting and leasing of computer hardware and peripherals such as printers, modems, scanners, etc.
Exclude:
leasing and providing loans to buyers of goods and equipment or to vendors and dealers to finance their inventories (report at Revenue from capital leases)
renting and/or leasing residential furniture (report at Other)
renting and/or leasing consumer electronics and appliances (report at Other)
b. Revenue from rental and/or operating lease agreements for other office machinery and equipment (e.g., office furniture)
Include renting and leasing of: - business machines such as photocopiers, fax machines, and telecommunication systems
office furniture.
Exclude:
leasing and providing loans to buyers of goods and equipment or to vendors and dealers to finance their inventories (report at Revenue from capital leases)
renting and/or leasing residential furniture (report at Other)
renting and/or leasing consumer electronics and appliances (report at Other)
c. Revenue from rental and/or operating lease agreements for machinery and equipment for transportation (e.g., air, rail and water transportation)
Include renting and leasing of:
airplanes and helicopters without pilots
chartering of commercial boats (e.g., steamships, tugboats, etc.) without operator
railway car leasing (except financial).
Exclude:
leasing and providing loans to buyers of goods and equipment or to vendors and dealers to finance their inventories (report at Revenue from capital leases)
renting and/or leasing air, rail and water transportation equipment with operator
renting and/or leasing pleasure boats (report at Other)
renting and/or leasing automobiles or trucks (report at Other)
d. Revenue from rental and/or operating lease agreements for heavy machinery and equipment (e.g., for agriculture, construction, forestry, mining, oil and gas extractions, etc.)
Include renting and/or leasing of:
heavy machinery and equipment
oil field and oil well drilling machinery and equipment
scaffolding (including mobile platforms)
construction forms
pallets and shipping containers.
Exclude:
leasing and providing loans to buyers of goods and equipment or to vendors and dealers to finance their inventories (report at Revenue from capital leases)
renting and/or leasing heavy machinery and equipment with operator.
e. Revenue from rental and/or operating lease agreements for other commercial and industrial equipment (e.g., materials handling, manufacturing, machine tools, power generation, intermodal containers, medical equipment, audio-visual and theatrical equipment, vending machines, etc.)
Include renting and leasing of:
construction and temporary road signs
communications equipment (e.g., mobile radio systems and public address systems)
diesel generators
garbage dumpsters
industrial trucks and other types of materials handling machinery and equipment
industrial machinery and equipment
lottery terminal equipment
medical equipment
metalworking machinery and equipment
motion picture equipment rental (including studio property rental)
offshore tool rental
painting equipment
plumbing equipment
restaurant equipment
sawmill equipment and machinery
sound and lighting machinery and equipment
textile machinery and equipment
theatrical equipment and scenery (except costumes)
vending and other types of coin-operated machines (e.g., washing machines)
welding equipment
woodworking equipment.
Exclude:
leasing and providing loans to buyers of goods and equipment or to vendors and dealers to finance their inventories (report at Revenue from capital leases)
renting and/or leasing commercial and/or industrial machinery and equipment with operator
renting and/or leasing automobiles or trucks (report at Other)
f. Revenue from capital (financial) leases
This question refers to revenue from providing capital (financial) or sales type leases. Typically, a capital lease is used to finance machinery and equipment for the major part of its economic life.
During the lease contract, the lessee is responsible for maintenance, interest and principle. After the lease period is over, ownership of the machinery and equipment is transferred to the lessee.
g. Labour charged to customers for repair and maintenance services
Include revenue from the labour associated with installation and set-up fees.
Exclude parts and materials charged to customers (report at Sales or merchandise and other items).
h. Sales of merchandise
Include:
sales of new machinery and equipment
sales of other non-rental items
sales of food and beverages.
Exclude disposal of previously rented and/or leased equipments (report at Net gains or losses from disposal of previous rented and/or leased equipment).
k. Commissions revenue
Include commissions earned from the sale of insurance, etc.
l. Other sales
Include:
other types of machinery and equipment rental (e.g., automobiles and trucks, consumer goods, etc.)
delivery and freight revenue
building, shop and land rental revenue
interest revenue
bad debt recoveries
miscellaneous service rental.
Other sales - table
Table summary
This table contains no data. It is an example of an empty data table used by respondents to provide data to Statistics Canada.
CAN$ '000
Revenue from rental and/or operating lease agreements for computers and peripherals
Revenue from rental and/or operating lease agreements for other office machinery and equipment
Revenue from rental and/or operating lease agreements for machinery and equipment for transportation
Revenue from rental and/or operating lease agreements for heavy machinery and equipment
Revenue from rental and/or operating lease agreements for other commercial and industrial equipment
Revenue from capital (financial) leases
Labour charged to customers for repair and maintenance services
Sales of merchandise and other items
Net gains or losses from disposal of previously rented and/or leased equipment
Gross proceeds from disposal of previously rented and/or leased equipment
Commissions revenue
Other
Total sales
In order to reduce future follow-up, please select one of the following options.
You have not reported any revenue from rental and/or operating lease agreements for heavy machinery and equipment, but you did in the previous year.
I confirm that all values are correct.
I am unable to confirm that all values are correct.
Your revenue from rental and/or operating lease agreements for heavy machinery and equipment $ ###### is significantly different than the $ ###### reported last reporting period.
I confirm that all values are correct.
I am unable to confirm that all values are correct.
You have not reported any revenue from rental and/or operating lease agreements for other commercial and industrial equipment, but you did in the previous year.
I confirm that all values are correct.
I am unable to confirm that all values are correct.
Your revenue from rental and/or operating lease agreements for other commercial and industrial equipment $ ###### is significantly different than the $ ###### reported last reporting period.
I confirm that all values are correct.
I am unable to confirm that all values are correct.
You have not reported any revenue from rental and/or operating lease agreements for computers and peripherals OR other office machinery and equipment, but you did in the previous year.
I confirm that all values are correct.
I am unable to confirm that all values are correct.
The value for the net loss or gain from the disposal of previously rented and/or leased equipment is more than the gross proceeds from the disposal.
I confirm that all values are correct.
I am unable to confirm that all values are correct.
Your revenue from rental and/or operating lease agreements for computers and peripherals OR other office machinery and equipment $ ###### is significantly different than the $ ###### reported last reporting period.
I confirm that all values are correct.
I am unable to confirm that all values are correct.
You have not reported any revenue from rental and/or operating lease agreements for machinery and equipment for transportation, but you did in the previous year.
I confirm that all values are correct.
I am unable to confirm that all values are correct.
Your revenue from rental and/or operating lease agreements for machinery and equipment for transportation $ ###### is significantly different than the $ ###### reported last reporting period.
I confirm that all values are correct.
I am unable to confirm that all values are correct.
Sales by type of client
1. What was this business's breakdown of sales by the following types of client?
Sales by type of client
This section is designed to measure which sector of the economy purchases your services.
Please provide a percentage breakdown of your sales by type of client.
Please ensure that the sum of percentages reported in this section equals 100%.
a. to c. Clients in Canada
a. Individuals and households
Please report the percentage of sales to individuals and households who do not represent the business or
government sector.
b. Businesses
Percentage of sales sold to the business sector should be reported here.
Include sales to Crown corporations.
c. Governments, not-for-profit organizations and public institutions (e.g., hospitals, schools)
Percentage of sales to federal, provincial, territorial and municipal governments should be reported here.
Include: sales to hospitals, schools, universities and public utilities.
d. Clients outside Canada
Please report the percentage of total sales to customers or clients located outside Canada including foreign businesses, foreign individuals, foreign institutions and/or governments.
Include sales to foreign subsidiaries and affiliates.
Clients outside Canada - Table
Table summary
This table contains no data. It is an example of an empty data table used by respondents to provide data to Statistics Canada.
Percentage
Clients in Canada — individuals and households
Clients in Canada — businesses
Clients in Canada — governments, not-for-profit organizations and public institutions
Clients outside of Canada
Total percentage
Sales by consumer location
1. What was the percentage breakdown of this business's sales by consumer location?
Consumer location is the location where the goods or services will ultimately be used.
If ultimate consumer location is not known, the following are acceptable substitutes:
shipping destination
client's billing address
location of this business's retail customers
location of this business's warehouses/distribution centres.
What was the percentage breakdown of this business's sales by consumer location - table
Table summary
This table contains no data. It is an example of an empty data table used by respondents to provide data to Statistics Canada.
Percentage
Newfoundland and Labrador
Prince Edward Island
Nova Scotia
New Brunswick
Quebec
Ontario
Manitoba
Saskatchewan
Alberta
British Columbia
Yukon
Northwest Territories
Nunavut
United States
All other countries
Total percentage
Sales by consumer location
International transactions - Revenue received from exports
1. During the reporting period of YYYY-MM-DD to YYYY-MM-DD , did this business receive revenue from clients outside Canada for the sale of products, services, royalties, rights, licensing or franchise fees?
International transactions
This section is intended to measure the value of international transactions on goods, services, royalties and licenses fees. It covers imported services and goods purchased outside Canada as well as the value of exported services and goods to clients/customers outside Canada. Please report also royalties, rights, licensing and franchise fees paid to and/or received from outside Canada. Services cover a variety of industrial, professional, trade and business services.
Yes
No
International transactions - Revenue received from exports
2. What was the revenue received from clients outside Canada?
International transactions
This section is intended to measure the value of international transactions on goods, services, royalties and licenses fees. It covers imported services and goods purchased outside Canada as well as the value of exported services and goods to clients/customers outside Canada. Please report also royalties, rights, licensing and franchise fees paid to and/or received from outside Canada. Services cover a variety of industrial, professional, trade and business services.
Revenue received ( CAN$ '000 )
3. What was the percentage breakdown of revenue received from clients outside Canada by goods, services and royalties?
International transactions
This section is intended to measure the value of international transactions on goods, services, royalties and licenses fees. It covers imported services and goods purchased outside Canada as well as the value of exported services and goods to clients/customers outside Canada. Please report also royalties, rights, licensing and franchise fees paid to and/or received from outside Canada. Services cover a variety of industrial, professional, trade and business services.
International transactions - table
Table summary
This table contains no data. It is an example of an empty data table used by respondents to provide data to Statistics Canada.
Percentage
Goods
Services
Royalties, rights, licensing and franchise fees
Total percentage
4. What was the percentage breakdown of revenue received from clients outside Canada by country?
International transactions
This section is intended to measure the value of international transactions on goods, services, royalties and licenses fees. It covers imported services and goods purchased outside Canada as well as the value of exported services and goods to clients/customers outside Canada. Please report also royalties, rights, licensing and franchise fees paid to and/or received from outside Canada. Services cover a variety of industrial, professional, trade and business services.
International transactions - table
Table summary
This table contains no data. It is an example of an empty data table used by respondents to provide data to Statistics Canada.
Percentage
United States
Mexico
Provide the percentage of revenue received from any other countries - top 4 clients only
Other
Other
Other
Other
Total percentage
International transactions - Purchases from outside Canada (Imports)
5. During the reporting period of YYYY-MM-DD to YYYY-MM-DD , did this business make payments to suppliers outside Canada for the purchase of products, services, royalties, rights, licensing or franchise fees?
International transactions
This section is intended to measure the value of international transactions on goods, services, royalties and licenses fees. It covers imported services and goods purchased outside Canada as well as the value of exported services and goods to clients/customers outside Canada. Please report also royalties, rights, licensing and franchise fees paid to and/or received from outside Canada. Services cover a variety of industrial, professional, trade and business services.
Yes
No
6. What were the payments made to suppliers outside Canada?
International transactions
This section is intended to measure the value of international transactions on goods, services, royalties and licenses fees. It covers imported services and goods purchased outside Canada as well as the value of exported services and goods to clients/customers outside Canada. Please report also royalties, rights, licensing and franchise fees paid to and/or received from outside Canada. Services cover a variety of industrial, professional, trade and business services.
Payments made ( CAN$ '000 )
7. What was the percentage breakdown of payments made to suppliers outside Canada by goods, services and royalties?
International transactions
This section is intended to measure the value of international transactions on goods, services, royalties and licenses fees. It covers imported services and goods purchased outside Canada as well as the value of exported services and goods to clients/customers outside Canada. Please report also royalties, rights, licensing and franchise fees paid to and/or received from outside Canada. Services cover a variety of industrial, professional, trade and business services.
International transactions - table
Table summary
This table contains no data. It is an example of an empty data table used by respondents to provide data to Statistics Canada.
Percentage
Goods
Services
Royalties, rights, licensing and franchise fees
Total percentage
8. What was the percentage breakdown of payments made to suppliers outside Canada by country?
International transactions
This section is intended to measure the value of international transactions on goods, services, royalties and licenses fees. It covers imported services and goods purchased outside Canada as well as the value of exported services and goods to clients/customers outside Canada. Please report also royalties, rights, licensing and franchise fees paid to and/or received from outside Canada. Services cover a variety of industrial, professional, trade and business services.
International transactions - table
Table summary
This table contains no data. It is an example of an empty data table used by respondents to provide data to Statistics Canada.
Percentage
United States
Mexico
Provide the percentage of payments made to any other countries - top 4 clients only
Other
Other
Other
Other
Total percentage
Changes or events
1. Indicate any changes or events that affected the reported values for this business or organization, compared with the last reporting period.
Select all that apply.
Strike or lock-out
Exchange rate impact
Price changes in goods or services sold
Contracting out
Organisational change
Price changes in labour or raw materials
Natural disaster
Recession
Change in product line
Sold business units
Expansion
New or lost contract
Plant closures
Acquisition of business units
Other
Specify the other changes or events
No changes or events
Contact person
1. Statistics Canada may need to contact the person who completed this questionnaire for further information.
Is Provided Given Names Provided Family Name the best person to contact?
Yes
No
Who is the best person to contact about this questionnaire?
First name
Last name
Title
Email address
Telephone number (including area code)
Extension number (if applicable) The maximum number of characters is 5.
Fax number (including area code)
Feedback
1. How long did it take to complete this questionnaire?
Include the time spent gathering the necessary information.
Hours
Minutes
2. We invite your comments about this questionnaire.
This survey is conducted by Statistics Canada in order to collect the necessary information to support the Integrated Business Statistics Program (IBSP). This program combines various survey and administrative data to develop comprehensive measures of the Canadian economy.
The statistical information from the IBSP serves many purposes, including:
Calculating each province and territory's fair share of federal-provincial transfer payments for health, education and social programs
Establishing government programs to assist businesses
Assisting the business community in negotiating contracts and collective agreements
Supporting the government in making informed decisions about fiscal, monetary and foreign exchange policies
Indexing social benefit programs and determining tax brackets
Enabling academics and economists to analyze the economic performance of Canadian industries and to better understand rapidly evolving business environments.
Your information may also be used by Statistics Canada for other statistical and research purposes.
Your participation in this survey is required under the authority of the Statistics Act.
Other important information
Authorization to collect this information
Data are collected under the authority of the Statistics Act, Revised Statutes of Canada, 1985, Chapter S-19.
Confidentiality
By law, Statistics Canada is prohibited from releasing any information it collects that could identify any person, business, or organization, unless consent has been given by the respondent, or as permitted by the Statistics Act. Statistics Canada will use the information from this survey for statistical purposes only.
Record linkages
To enhance the data from this survey and to reduce the reporting burden, Statistics Canada may combine the acquired data with information from other surveys or from administrative sources.
Data-sharing agreements
To reduce respondent burden, Statistics Canada has entered into data-sharing agreements with provincial and territorial statistical agencies and other government organizations, which have agreed to keep the data confidential and use them only for statistical purposes. Statistics Canada will only share data from this survey with those organizations that have demonstrated a requirement to use the data.
Section 11 of the Statistics Act provides for the sharing of information with provincial and territorial statistical agencies that meet certain conditions. These agencies must have the legislative authority to collect the same information, on a mandatory basis, and the legislation must provide substantially the same provisions for confidentiality and penalties for disclosure of confidential information as the Statistics Act. Because these agencies have the legal authority to compel businesses to provide the same information, consent is not requested and businesses may not object to the sharing of the data.
For this survey, there are Section 11 agreements with the provincial and territorial statistical agencies of Newfoundland and Labrador, Nova Scotia, New Brunswick, Québec, Ontario, Manitoba, Saskatchewan, Alberta, British Columbia and the Yukon. The shared data will be limited to information pertaining to business establishments located within the jurisdiction of the respective province or territory.
Section 12 of the Statistics Act provides for the sharing of information with federal, provincial or territorial government organizations. Under Section 12, you may refuse to share your information with any of these organizations by writing a letter of objection to the Chief Statistician, specifying the organizations with which you do not want Statistics Canada to share your data and mailing it to the following address:
Chief Statistician of Canada
Statistics Canada
Attention of Director, Enterprise Statistics Division
150 Tunney's Pasture Driveway
Ottawa, Ontario
K1A 0T6
For this survey, there are Section 12 agreements with the statistical agencies of Prince Edward Island, the Northwest Territories and Nunavut.
For agreements with provincial and territorial government organizations, the shared data will be limited to information pertaining to business establishments located within the jurisdiction of the respective province or territory.
Business or organization and contact information
1. Please verify or provide the business or organization's legal and operating name and correct where needed.
Note: Legal name modifications should only be done to correct a spelling error or typo.
Legal Name
The legal name is one recognized by law, thus it is the name liable for pursuit or for debts incurred by the business or organization. In the case of a corporation, it is the legal name as fixed by its charter or the statute by which the corporation was created.
Modifications to the legal name should only be done to correct a spelling error or typo.
To indicate a legal name of another legal entity you should instead indicate it in question 3 by selecting 'Not currently operational' and then choosing the applicable reason and providing the legal name of this other entity along with any other requested information.
Operating Name
The operating name is a name the business or organization is commonly known as if different from its legal name. The operating name is synonymous with trade name.
Legal name
Operating name (if applicable)
2. Please verify or provide the contact information of the designated business or organization contact person for this questionnaire and correct where needed.
Note: The designated contact person is the person who should receive this questionnaire. The designated contact person may not always be the one who actually completes the questionnaire.
3. Please verify or provide the current operational status of the business or organization identified by the legal and operating name above.
Operational
Not currently operational
Why is this business or organization not currently operational?
Seasonal operations
Ceased operations
Sold operations
Amalgamated with other businesses or organizations
Temporarily inactive but will re-open
No longer operating due to other reasons
When did this business or organization close for the season? Date
When does this business or organization expect to resume operations? Date
When did this business or organization cease operations? Date
Why did this business or organization cease operations?
Bankruptcy
Liquidation
Dissolution
Other
Specify the other reasons for ceased operations
When was this business or organization sold? Date
What is the legal name of the buyer?
When did this business or organization amalgamate? Date
What is the legal name of the resulting or continuing business or organization?
What are the legal names of the other amalgamated businesses or organizations?
When did this business or organization become temporarily inactive? Date
When does this business or organization expect to resume operations? Date
Why is this business or organization temporarily inactive?
When did this business or organization cease operations? Date
Why did this business or organization cease operations?
4. Please verify or provide the current main activity of the business or organization identified by the legal and operating name above.
Note: The described activity was assigned using the North American Industry Classification System (NAICS).
This question verifies the business or organization's current main activity as classified by the North American Industry Classification System (NAICS). The North American Industry Classification System (NAICS) is an industry classification system developed by the statistical agencies of Canada, Mexico and the United States. Created against the background of the North American Free Trade Agreement, it is designed to provide common definitions of the industrial structure of the three countries and a common statistical framework to facilitate the analysis of the three economies. NAICS is based on supply-side or production-oriented principles, to ensure that industrial data, classified to NAICS, are suitable for the analysis of production-related issues such as industrial performance.
The target entity for which NAICS is designed are businesses and other organizations engaged in the production of goods and services. They include farms, incorporated and unincorporated businesses and government business enterprises. They also include government institutions and agencies engaged in the production of marketed and non-marketed services, as well as organizations such as professional associations and unions and charitable or non-profit organizations and the employees of households.
The associated NAICS should reflect those activities conducted by the business or organizational units targeted by this questionnaire only, as identified in the 'Answering this questionnaire' section and which can be identified by the specified legal and operating name. The main activity is the activity which most defines the targeted business or organization's main purpose or reason for existence. For a business or organization that is for-profit, it is normally the activity that generates the majority of the revenue for the entity.
The NAICS classification contains a limited number of activity classifications; the associated classification might be applicable for this business or organization even if it is not exactly how you would describe this business or organization's main activity.
Please note that any modifications to the main activity through your response to this question might not necessarily be reflected prior to the transmitting of subsequent questionnaires and as a result they may not contain this updated information.
The following is the detailed description including any applicable examples or exclusions for the classification currently associated with this business or organization.
Description and examples
This is the current main activity.
This is not the current main activity.
Please provide a brief but precise description of this business or organization's main activity.
e.g., breakfast cereal manufacturing, shoe store, software development
Main activity
5. You indicated that is not the current main activity. Was this business or organization's main activity ever classified as: ?
Yes
No
When did the main activity change? Date
6. Please search and select the industry classification code that best corresponds to this business or organization's main activity.
Select this business or organization's activity sector (optional)
Farming or logging operation
Construction company or general contractor
Manufacturer
Wholesaler
Retailer
Provider of passenger or freight transportation
Provider of investment, savings or insurance products
Real estate agency, real estate brokerage or leasing company
Provider of professional, scientific or technical services
Provider of health care or social services
Restaurant, bar, hotel, motel or other lodging establishment
Other sector
7. You have indicated that the current main activity of this business or organization is: Main activity Are there any other activities that contribute significantly (at least 10%) to this business or organization's revenue?
Yes, there are other activities.
No, that is the only significant activity.
Please provide a brief but precise description of this business or organization's secondary activity.
e.g., breakfast cereal manufacturing, shoe store, software development
8. Approximately what percentage of this business or organization's revenue is generated by each of the following activities?
When precise figures are not available, please provide your best estimates.
Approximately what percentage of this business or organization's revenue is generated by each of the following activities - title
Table summary
This table contains no data. It is an example of an empty data table used by respondents to provide data to Statistics Canada.
Percentage of revenue
Main activity
Secondary activity
All other activities
Total percentage
Reporting period information
1. What are the start and end dates of this business's or organization's most recently completed fiscal year?
Note: For the survey, the end date should fall between April 1, YYYY and March 31, YYYY+1 .
Here are twelve common fiscal periods that fall within the targeted dates:
May 1, YYYY-1 to April 30, YYYY
June 1, YYYY-1 to May 31, YYYY
July 1, YYYY-1 to June 30, YYYY
August 1, YYYY-1 to July 31, YYYY
September 1, YYYY-1 to August 31, YYYY
October 1, YYYY-1 to September 30, YYYY
November 1, YYYY-1 to October 31, YYYY
December 1, YYYY-1 to November 30, YYYY
January 1, YYYY to December 31, YYYY
February 1, YYYY to January 31, YYYY+1
March 1, YYYY to February 28, YYYY+1
April 1, YYYY to March 31, YYYY+1 .
Here are other examples of fiscal periods that fall within the required dates:
September 18, YYYY-1 to September 15, YYYY (e.g., floating year-end)
June 1, YYYY to December 31, YYYY (e.g., a newly opened business)
Fiscal Year Start date
Fiscal Year-End date
2. What is the reason the reporting period does not cover a full year?
Select all that apply.
Seasonal operations
New business
Change of ownership
Temporarily inactive
Change of fiscal year
Ceased operations
Other
Specify reason the reporting period does not cover a full year
Revenue
1. For the reporting period of YYYY-MM-DD to YYYY-MM-DD , what was this business's revenue from each of the following sources?
Notes:
a detailed breakdown may be requested in other sections
these questions are asked of many different industries. Some questions may not apply to this business
Please report all amounts in thousands of Canadian dollars.
Revenue
a. Sales of goods and services (e.g., fees, commissions, services revenue)
Report net of returns and allowances.
Sales of goods and services are defined as amounts derived from the sale of goods and services (cash or credit), falling within a business's ordinary activities. Sales should be reported net of trade discount, value added tax and other taxes based on sales.
Include:
sales from Canadian locations (domestic and export sales)
transfers to other business units or a head office of your firm.
Exclude:
transfers into inventory and consignment sales
federal, provincial and territorial sales taxes and excise duties and taxes
intercompany sales in consolidated financial statements.
b. Rental and leasing
Include: rental or leasing of apartments, commercial buildings, land, office space, residential housing, investments in co-tenancies and co-ownerships, hotel or motel rooms, long and short term vehicle leasing, machinery or equipment, storage lockers, etc.
c. Commissions
Include: commissions earned on the sale of products or services by businesses such as advertising agencies, brokers, insurance agents, lottery ticket sales, sales representatives and travel agencies - compensation could also be reported under this item (for example, compensation for collecting sales tax)
d. Subsidies (including grants, donations, fundraising and sponsorships)
Include:
non-repayable grants, contributions and subsidies from all levels of government
revenue from private sector (corporate and individual) sponsorships, donations and fundraising.
e. Royalties, rights, licensing and franchise fees
A royalty is defined as a payment received by the holder of a copyright, trademark or patent.
Include revenue received from the sale or use of all intellectual property rights of copyrighted materials such as musical, literary, artistic or dramatic works, sound recordings or the broadcasting of communication signals.
f. Dividends
Include:
dividend income
dividends from Canadian sources
dividends from foreign sources
patronage dividends.
Exclude equity income from investments in subsidiaries or affiliates.
g. Interest
Include:
investment revenue
interest from foreign sources
interest from Canadian bonds and debentures
interest from Canadian mortgage loans
interest from other Canadian sources.
Exclude equity income from investments in subsidiaries or affiliates.
h. Other revenue - please specify
Include amounts not included in questions a. to g.
Total revenue
The sum of sub-questions a. to h.
Other revenue - table
Table summary
This table contains no data. It is an example of an empty data table used by respondents to provide data to Statistics Canada.
CAN$ '000
Sales of goods and services
Rental and leasing
Commissions
Subsidies
Royalties, rights, licensing and franchise fees
Dividends
Interest
Other
Total revenue
1. In order to reduce future follow-up, please select one of the following options.
The reported value for total revenue $ ###### is significantly different than the $ ###### reported last reporting period.
I confirm that all values are correct.
I am unable to confirm that all values are correct.
The reported sales of goods and services entered $ ###### is significantly different than the $ ###### reported last reporting period.
I confirm that all values are correct.
I am unable to confirm that all values are correct.
Expenses
1. For the reporting period of YYYY-MM-DD to YYYY-MM-DD , what were this business's expenses for the following items?
Notes:
a detailed breakdown may be requested in other sections
these questions are asked of many different industries. Some questions may not apply to this business
Please report all amounts in thousands of Canadian dollars.
Expenses
a. Cost of goods sold
Many business units distinguish their costs of materials from their other business expenses (selling, general and administrative). This item is included to allow you to easily record your costs/expenses according to your normal accounting practices.
Include:
cost of raw materials and/or goods purchased for resale - net of discounts earned on purchases
freight in and duty.
Exclude all costs associated with salaries, wages, benefits, commissions and subcontracts (report at Employment costs and expenses, and Subcontracts).
b. Employment costs and expenses
b1. Salaries, wages and commissions
Please report all salaries and wages (including taxable allowances and employment commissions as defined on the T4 - Statement of Remuneration Paid) before deductions for this reporting period.
Include:
vacation pay
bonuses (including profit sharing)
employee commissions
taxable allowances (e.g., room and board, vehicle allowances, gifts such as airline tickets for holidays)
severance pay.
Exclude all payments and expenses associated with casual labour and outside contract workers (report at Subcontracts).
b2. Employee benefits
Include contributions to:
health plans
insurance plans
employment insurance
pension plans
workers' compensation
association dues
contributions to any other employee benefits such as child care and supplementary unemployment benefit (SUB) plans
contributions to provincial and territorial health and education payroll taxes.
c. Subcontracts
Subcontract expense refers to the purchasing of services from outside of the company rather than providing them in-house.
Include:
hired casual labour and outside contract workers
custom work and contract work
subcontract and outside labour
hired labour.
d. Research and development fees
Expenses from activities conducted with the intention of making a discovery that could either lead to the development of new products or procedures, or to the improvement of existing products or procedures.
e. Professional and business fees
Include:
legal services
accounting and auditing fees
consulting fees
education and training fees
appraisal fees
management and administration fees
property management fees
information technology (IT) consulting and service fees (purchased)
architectural fees
engineering fees
scientific and technical service fees
other consulting fees (management, technical and scientific)
veterinary fees
fees for human health services
payroll preparation fees
all other professional and business service fees.
Exclude service fees paid to Head Office (report at All other costs and expenses).
f. Utilities
Utility expenses related to operating your business unit such as water, electricity, gas, heating and hydro.
Include:
diesel, fuel wood, natural gas, oil and propane
sewage.
Exclude:
energy expenses covered in your rental and leasing contracts
telephone, Internet and other telecommunications
vehicle fuel (report at All other costs and expenses).
g. Office and computer related expenses
Include:
office stationery and supplies, paper and other supplies for photocopiers, printers and fax machines
postage and courier (used in the day to day office business activity)
computer and peripherals upgrade expenses
data processing.
Exclude telephone, Internet and other telecommunication expenses (report at Telephone, Internet and other telecommunication).
h. Telephone, Internet and other telecommunication
Include:
internet
telephone and telecommunications
cellular telephone
fax machine
pager.
i. Business taxes, licenses and permits
Include:
property taxes paid directly and property transfer taxes
vehicle license fees
beverage taxes and business taxes
trade license fees
membership fees and professional license fees
provincial capital tax.
j. Royalties, franchise fees and memberships
Include:
amounts paid to holders of patents, copyrights, performing rights and trademarks
gross overriding royalty expenses and direct royalty costs
resident and non-resident royalty expenses
franchise fees.
Exclude Crown royalties
k. Crown charges
Federal or Provincial royalty, tax, lease or rental payments made in relation to the acquisition, development or ownership of Canadian resource properties.
Include:
Crown royalties
Crown leases and rentals
oil sand leases
stumpage fees.
l. Rental and leasing
Include:
lease rental expenses, real estate rental expenses, condominium fees and equipment rental expenses
motor vehicle rental and leasing expenses
studio lighting and scaffolding
machinery and equipment rental expenses
storage expenses
road and construction equipment rental
fuel and other utility costs covered in your rental and leasing contracts.
m. Repair and maintenance
Include:
buildings and structures
machinery and equipment
security equipment
vehicles
costs related to materials, parts and external labour associated with these expenses
janitorial and cleaning services and garbage removal.
n. Amortization and depreciation
Include:
direct cost depreciation of tangible assets and amortization of leasehold improvements
amortization of intangible assets (e.g., amortization of goodwill, patents, franchises, copyrights, trademarks, deferred charges, organizational costs).
o. Insurance
Insurance recovery income should be deducted from insurance expenses.
Include:
professional and other liability insurance
motor vehicle and property insurance
executive life insurance
bonding, business interruption insurance and fire insurance.
p. Advertising, marketing, promotion, meals and entertainment
Include:
newspaper advertising and media expenses
catalogues, presentations and displays
tickets for theatre, concerts and sporting events for business promotion
fundraising expenses
meals, entertainment and hospitality purchases for clients.
exploration and development (including prospect/geological, well abandonment & dry holes, exploration expenses, development expenses)
amounts not included in sub-questions a. to t. above.
Total expenses
The sum of sub-questions a. to u.
The sum of sub-questions a. to u. - table
Table summary
This table contains no data. It is an example of an empty data table used by respondents to provide data to Statistics Canada.
CAN$ '000
Cost of goods sold
Opening inventories
Purchases
Closing inventories
Cost of goods sold
Employment costs and expenses
Salaries, wages and commissions
Employee benefits
Subcontracts
Research and development fees
Professional and business fees
Utilities
Office and computer related expenses
Telephone, Internet and other telecommunication
Business taxes, licenses and permits
Royalties, franchise fees and memberships
Crown charges
Rental and leasing
Repair and maintenance
Amortization and depreciation
Insurance
Advertising, marketing, promotion, meals and entertainment
Travel, meetings and conventions
Financial services
Interest expense
Other non-production-related costs and expenses
Other
Total expenses
1. In order to reduce future follow-up, please select one of the following options.
The value for total expenses $ ###### is significantly different than the $ ###### reported last reporting period.
I confirm that all values are correct.
I am unable to confirm that all values are correct.
Industry characteristics
1. What were this business's sales for each of the following goods and services?
Please report in thousands of Canadian dollars.
Include:
licensing contracts known as 'revenue sharing' agreements
a. Licensing rights to exhibit, televise or rent feature films
Feature films - feature-length productions (75 minutes or more) and where the first market is theatres. This does not include "movies of the week" and made for television films (which are to be included in question 1(b) Licensing rights to televise or rent television programs), nor straight to video productions (which are to be included in question 1(e) Wholesaling of pre-recorded Canadian and non-Canadian videos - DVD and Blu-ray).
b. Licensing rights to televise or rent television programs
Television programs: programming designed primarily for conventional television or discretionary programming services.
Include serials, news and public affairs shows, game shows, reality shows, documentaries (except those intended for theatrical release) and made-for-TV movies.
c. Licensing rights to exhibit, televise or rent digital media
Digital media - linear or non-linear content created primarily for the Internet, wireless and other emerging platforms and/or device.
d. Licensing rights to exhibit, televise or rent other audiovisual works
(e.g., short films, corporate/ industry videos, music videos, educational videos, videos for government, documentaries not intended for theatrical or television release, etc.)
Report for all other audiovisual works except those reported in questions 1a, 1b and 1c.
Audiovisual works include film productions, television productions, interactive digital media productions and convergent digital media productions.
Total distribution sales
The sum of questions 1a. to 1d.
e. Wholesaling of pre-recorded Canadian and non-Canadian videos - DVD and Blu-ray
Report all direct sales of DVDs and Blu-rays to wholesale, retail and rental markets.
Include sales of DVDs and Blu-rays manufactured through duplication and packaging as well as those purchased from other distributors.
f. Production of audiovisual works for outright sale or contract production of audiovisual works or other sources of revenue
Report all revenue from goods and services rendered that is not reported in questions 1 a. to 1 e.
Include:
revenue from outright sale or contract production of audiovisual works (feature films, television programs and other)
merchandise licensing.
Exclude:
grants and subsidies and investment income such as dividends and interest
revenue from royalties, rights and licensing.
Total sales of goods and services
The sum of questions 1 a. to 1 f.
Total sales of goods and services - table
Table summary
This table contains no data. It is an example of an empty data table used by respondents to provide data to Statistics Canada.
CAN$ '000
Licensing rights to exhibit, televise or rent feature films
Licensing rights to exhibit, televise or rent television programs
Licensing rights to exhibit, televise or rent digital media
Licensing rights to exhibit, televise or rent other audiovisual works
Total distribution sales
Wholesaling of pre-recorded Canadian and non-Canadian videos
Production of audiovisual works for outright sale or contract production of audiovisual works or other sources of revenue
Total sales of goods and services
In order to reduce future follow-up, please select one of the following options.
The total amount of $ ###### for total sales is significantly different than the $ ###### reported last reporting period.
I confirm that all values are correct.
I am unable to confirm that all values are correct.
2. Report revenue from the distribution of feature films, television programs and other audiovisual works according to their primary markets within or outside Canada.
Include fixed rentals and productions released on a percentage or commission basis.
Exclude wholesaling.
Please report all amounts in thousands of Canadian dollars.
Include: fixed rentals and productions released on a percentage or commission basis.
Exclude wholesaling
a) Theatres
See question 1a for definition of feature films.
b) On-demand services market - e.g., SVOD, TVOD
On-demand services (SVOD and TVOD): These include BDU-specific VOD services (the VOD service that often comes with a subscription to a BDU) as well as over-the-top services (OTT services).
BDU=Broadcasting Distribution Undertaking
Video-on-demand (VOD) - VOD services allow viewers to select programs to view at the time of their own choosing. In contrast, traditional broadcasting services such as conventional, pay and specialty television services are often referred to as "linear services" in that they present programs at specific times as part of a program schedule. VOD services are "non-linear" since it is the consumer who selects the program and the viewing time.
c) Conventional television networks and stations
The conventional television market includes private and public broadcasters that maintain over-the-air infrastructure to broadcast to households, although the vast majority of Canadian households now receive conventional television signals via cable or satellite television providers.
d) Discretionary services market - e.g., Pay and Specialty TV
Specialty television services are available via cable or satellite television providers. The specialty television service includes sports, 24-news, movies, arts and other thematic channels that earn revenue from a combination of subscription fees and advertising sales.
Pay television services are also only available via cable or satellite television services. They typically feature premium programming such as recently released films and do not earn revenue from advertising; instead they rely on subscription or transactional payments from households.
e) Other (markets)
Include:
Distribution in film clubs, retirement communities, campus theatres, schools, libraries, airlines, military bases, hospitals, and other institutions, etc.
revenue to the home video rental market
f) Distribution of feature films, television programs and other audiovisual works to all markets outside Canada
Report total distribution revenue of audiovisual works (feature films, television programs and other) to all markets outside Canada.
Total distribution sales
The sum of questions a to f.
Total distribution sales - table
Table summary
This table contains no data. It is an example of an empty data table used by respondents to provide data to Statistics Canada.
Canadian productions CAN$ '000
Non-Canadian productions CAN$ '000
Total CAN$ '000
Market distribution of feature films and television programs inside Canada
Theatres
On-demand services market
Conventional television networks and stations
Discretionary services market
Other
Market distribution of feature films and television programs outside Canada
Distribution of feature films, television programs and other audiovisual works to all markets outside Canada
Total distribution sales
In order to reduce future follow-up, please select one of the following options.
You have not reported any distribution revenue from canadian productions, but did in the previous year.
I confirm that all values are correct.
I am unable to confirm that all values are correct.
The total amount of $ ###### for distribution revenue from canadian productions is significantly different than the $ ###### reported last reporting period.
I confirm that all values are correct.
I am unable to confirm that all values are correct.
You have not reported any distribution revenue from non-canadian productions, but did in the previous year.
I confirm that all values are correct.
I am unable to confirm that all values are correct.
The total amount of $ ###### for distribution revenue from non-canadian productions is significantly different than the $ ###### reported last reporting period.
I confirm that all values are correct.
I am unable to confirm that all values are correct.
3. Provide the percentage of production sales for Canadian and Non-Canadian productions by original language.
Provide the percentage of production sales for Canadian and Non-Canadian productions by original language - table
Table summary
This table contains no data. It is an example of an empty data table used by respondents to provide data to Statistics Canada.
Percentage
Canadian productions
English
French
Other
Total
Non-Canadian productions
English
French
Other
Total
Industry characteristics
4. What were this business's expenses for each of the following goods and services?
Please report all amounts in thousands of Canadian dollars.
What were this business's expenses for each of the following goods and services - table
Table summary
This table contains no data. It is an example of an empty data table used by respondents to provide data to Statistics Canada.
CAN$ '000
Cost of DVDs and Blu-rays purchased
Royalties, rights and licensing fees from Canadian productions
Royalties, rights and licensing fees from non-Canadian productions
In order to reduce future follow-up, please select one of the following options.
The value of $ ###### for expenses is significantly different than the $ ###### reported last reporting period.
I confirm that all values are correct.
I am unable to confirm that all values are correct.
Sales by type of client
1. What was this business's breakdown of sales by the following types of client?
Sales by type of client
This section is designed to measure which sector of the economy purchases your services.
Please provide a percentage breakdown of your sales by type of client.
Please ensure that the sum of percentages reported in this section equals 100%.
a. to c. Clients in Canada
a. Individuals and households
Please report the percentage of sales to individuals and households who do not represent the business or government sector.
b. Businesses
Percentage of sales sold to the business sector should be reported here.
Include sales to Crown corporations.
c. Governments, not-for-profit organizations and public institutions (e.g., hospitals, schools)
Percentage of sales to federal, provincial, territorial and municipal governments should be reported here.
Include: sales to hospitals, schools, universities and public utilities.
d. Clients outside Canada
Please report the percentage of total sales to customers or clients located outside Canada including foreign businesses, foreign individuals, foreign institutions and/or governments.
Include sales to foreign subsidiaries and affiliates.
Clients outside Canada - table
Table summary
This table contains no data. It is an example of an empty data table used by respondents to provide data to Statistics Canada.
Percentage
Clients in Canada — individuals and households
Clients in Canada — businesses
Clients in Canada — governments, not-for-profit organizations and public institutions
Clients outside of Canada
Total percentage
Sales by consumer location
1. What was the percentage breakdown of this business's sales by consumer location?
Consumer location is the location where the goods or services will ultimately be used.
If ultimate consumer location is not known, the following are acceptable substitutes:
shipping destination
client's billing address
location of this business's retail customers
location of this business's warehouses/distribution centres.
What was the percentage breakdown of this business's sales by consumer location - table
Table summary
This table contains no data. It is an example of an empty data table used by respondents to provide data to Statistics Canada.
Percentage
Newfoundland and Labrador
Prince Edward Island
Nova Scotia
New Brunswick
Quebec
Ontario
Manitoba
Saskatchewan
Alberta
British Columbia
Yukon
Northwest Territories
Nunavut
United States
All other countries
Total percentage
Sales by consumer location
International transactions - Revenue received from exports
1. During the reporting period of YYYY-MM-DD to YYYY-MM-DD , did this business receive revenue from clients outside Canada for the sale of products, services, royalties, rights, licensing or franchise fees?
International transactions
This section is intended to measure the value of international transactions on goods, services, royalties and licenses fees. It covers imported services and goods purchased outside Canada as well as the value of exported services and goods to clients/customers outside Canada. Please report also royalties, rights, licensing and franchise fees paid to and/or received from outside Canada. Services cover a variety of industrial, professional, trade and business services.
Yes
No
International transactions - Revenue received from exports
2. What was the revenue received from clients outside Canada?
International transactions
This section is intended to measure the value of international transactions on goods, services, royalties and licenses fees. It covers imported services and goods purchased outside Canada as well as the value of exported services and goods to clients/customers outside Canada. Please report also royalties, rights, licensing and franchise fees paid to and/or received from outside Canada. Services cover a variety of industrial, professional, trade and business services.
Revenue received ( CAN$ '000 )
3. What was the percentage breakdown of revenue received from clients outside Canada by goods, services and royalties?
International transactions
This section is intended to measure the value of international transactions on goods, services, royalties and licenses fees. It covers imported services and goods purchased outside Canada as well as the value of exported services and goods to clients/customers outside Canada. Please report also royalties, rights, licensing and franchise fees paid to and/or received from outside Canada. Services cover a variety of industrial, professional, trade and business services.
International transactions - table
Table summary
This table contains no data. It is an example of an empty data table used by respondents to provide data to Statistics Canada.
Percentage
Goods
Services
Royalties, rights, licensing and franchise fees
Total percentage
4. What was the percentage breakdown of revenue received from clients outside Canada by country?
International transactions
This section is intended to measure the value of international transactions on goods, services, royalties and licenses fees. It covers imported services and goods purchased outside Canada as well as the value of exported services and goods to clients/customers outside Canada. Please report also royalties, rights, licensing and franchise fees paid to and/or received from outside Canada. Services cover a variety of industrial, professional, trade and business services.
International transactions - table
Table summary
This table contains no data. It is an example of an empty data table used by respondents to provide data to Statistics Canada.
Percentage
United States
Mexico
Provide the percentage of revenue received from any other countries - top 4 clients only
Other 1 - specif
Other 2 - specify
Other 3 - specif
Other 4 - specif
Total percentage
List of countries
Aruba
Afghanistan
Angola
Anguilla
Åland Islands
Albania
Andorra
United Arab Emirates
Argentina
Armenia
American Samoa
Antarctica
French Southern Territories
Antigua and Barbuda
Australia
Austria
Azerbaijan
Burundi
Belgium
Benin
Bonaire, Saint Eustatius and Saba
Burkina Faso
Bangladesh
Bulgaria
Bahrain
Bahamas
Bosnia and Herzegovina
Saint Barthélemy
Belarus
Belize
Bermuda
Bolivia
Brazil
Barbados
Brunei Darussalam
Bhutan
Bouvet Island
Botswana
Central African Republic
Cocos (Keeling) Islands
Switzerland
Chile
China
Côte d'Ivoire
Cameroon
Congo, The Democratic Republic of the
Congo, Republic of the
Cook Islands
Colombia
Comoros
Cape Verde
Costa Rica
Cuba
Curaçao
Christmas Island
Cayman Islands
Cyprus
Czech Republic
Germany
Djibouti
Dominica
Denmark
Dominican Republic
Algeria
Ecuador
Egypt
Eritrea
Western Sahara
Spain
Estonia
Ethiopia
Finland
Fiji
Falkland Islands (Malvinas)
France
Faroe Islands
Micronesia, Federated States of
Gabon
United Kingdom
Georgia
Guernsey
Ghana
Gibraltar
Guinea
Guadeloupe
Gambia
Guinea-Bissau
Equatorial Guinea
Greece
Grenada
Greenland
Guatemala
French Guiana
Guam
Guyana
Hong Kong Special Administrative Region
Heard Island and McDonald Islands
Honduras
Croatia
Haiti
Hungary
Indonesia
Isle of Man
India
British Indian Ocean Territory
Ireland, Republic of
Iran
Iraq
Iceland
Israel
Italy
Jamaica
Jersey
Jordan
Japan
Kazakhstan
Kenya
Kyrgyzstan
Cambodia
Kiribati
Saint Kitts and Nevis
Korea, South
Kuwait
Laos
Lebanon
Liberia
Libya
Saint Lucia
Liechtenstein
Sri Lanka
Lesotho
Lithuania
Luxembourg
Latvia
Macao Special Administrative Region
Saint Martin (French part)
Morocco
Monaco
Moldova
Madagascar
Maldives
Marshall Islands
Macedonia, Republic of
Mali
Malta
Burma (Myanmar)
Montenegro
Mongolia
Northern Mariana Islands
Mozambique
Mauritania
Montserrat
Martinique
Mauritius
Malawi
Malaysia
Mayotte
Namibia
New Caledonia
Niger
Norfolk Island
Nigeria
Nicaragua
Niue
Netherlands
Norway
Nepal
Nauru
New Zealand
Oman
Pakistan
Panama
Pitcairn
Peru
Philippines
Palau
Papua New Guinea
Poland
Puerto Rico
Korea, North
Portugal
Paraguay
West Bank and Gaza Strip (Palestine)
French Polynesia
Qatar
Réunion
Romania
Russian Federation
Rwanda
Saudi Arabia
Sudan
Senegal
Singapore
South Georgia and the South Sandwich Islands
Saint Helena
Svalbard and Jan Mayen
Solomon Islands
Sierra Leone
El Salvador
San Marino
Somalia
Saint Pierre and Miquelon
Serbia
Sao Tome and Principe
Suriname
Slovakia
Slovenia
Sweden
Swaziland
Sint Maarten (Dutch part)
Seychelles
Syria
Turks and Caicos Islands
Chad
Togo
Thailand
Tajikistan
Tokelau
Turkmenistan
Timor-Leste
Tonga
Trinidad and Tobago
Tunisia
Turkey
Tuvalu
Taiwan
Tanzania
Uganda
Ukraine
United States Minor Outlying Islands
Uruguay
Uzbekistan
Holy See (Vatican City State)
Saint Vincent and the Grenadines
Venezuela
Virgin Islands, British
Virgin Islands, United States
Viet Nam
Vanuatu
Wallis and Futuna
Samoa
Kosovo
Yemen
South Africa, Republic of
Zambia
Zimbabwe
International transactions - Purchases from outside Canada (Imports)
5. During the reporting period of YYYY-MM-DD to YYYY-MM-DD , did this business make payments to suppliers outside Canada for the purchase of products, services, royalties, rights, licensing or franchise fees?
International transactions
This section is intended to measure the value of international transactions on goods, services, royalties and licenses fees. It covers imported services and goods purchased outside Canada as well as the value of exported services and goods to clients/customers outside Canada. Please report also royalties, rights, licensing and franchise fees paid to and/or received from outside Canada. Services cover a variety of industrial, professional, trade and business services.
Yes
No
6. What were the payments made to suppliers outside Canada?
International transactions
This section is intended to measure the value of international transactions on goods, services, royalties and licenses fees. It covers imported services and goods purchased outside Canada as well as the value of exported services and goods to clients/customers outside Canada. Please report also royalties, rights, licensing and franchise fees paid to and/or received from outside Canada. Services cover a variety of industrial, professional, trade and business services.
Payments made ( CAN$ '000 )
7. What was the percentage breakdown of payments made to suppliers outside Canada by goods, services and royalties?
International transactions
This section is intended to measure the value of international transactions on goods, services, royalties and licenses fees. It covers imported services and goods purchased outside Canada as well as the value of exported services and goods to clients/customers outside Canada. Please report also royalties, rights, licensing and franchise fees paid to and/or received from outside Canada. Services cover a variety of industrial, professional, trade and business services.
International transactions - table
Table summary
This table contains no data. It is an example of an empty data table used by respondents to provide data to Statistics Canada.
Percentage
Goods
Services
Royalties, rights, licensing and franchise fees
Total percentage
8. What was the percentage breakdown of payments made to suppliers outside Canada by country?
International transactions
This section is intended to measure the value of international transactions on goods, services, royalties and licenses fees. It covers imported services and goods purchased outside Canada as well as the value of exported services and goods to clients/customers outside Canada. Please report also royalties, rights, licensing and franchise fees paid to and/or received from outside Canada. Services cover a variety of industrial, professional, trade and business services.
International transactions - table
Table summary
This table contains no data. It is an example of an empty data table used by respondents to provide data to Statistics Canada.
Percentage
United States
Mexico
Provide the percentage of payments made to any other countries - top 4 clients only
Other 1 - specif
Other 2 - specif
Other 3 - specif
Other 4 - specif
Total percentage
List of countries
Aruba
Afghanistan
Angola
Anguilla
Åland Islands
Albania
Andorra
United Arab Emirates
Argentina
Armenia
American Samoa
Antarctica
French Southern Territories
Antigua and Barbuda
Australia
Austria
Azerbaijan
Burundi
Belgium
Benin
Bonaire, Saint Eustatius and Saba
Burkina Faso
Bangladesh
Bulgaria
Bahrain
Bahamas
Bosnia and Herzegovina
Saint Barthélemy
Belarus
Belize
Bermuda
Bolivia
Brazil
Barbados
Brunei Darussalam
Bhutan
Bouvet Island
Botswana
Central African Republic
Cocos (Keeling) Islands
Switzerland
Chile
China
Côte d'Ivoire
Cameroon
Congo, The Democratic Republic of the
Congo, Republic of the
Cook Islands
Colombia
Comoros
Cape Verde
Costa Rica
Cuba
Curaçao
Christmas Island
Cayman Islands
Cyprus
Czech Republic
Germany
Djibouti
Dominica
Denmark
Dominican Republic
Algeria
Ecuador
Egypt
Eritrea
Western Sahara
Spain
Estonia
Ethiopia
Finland
Fiji
Falkland Islands (Malvinas)
France
Faroe Islands
Micronesia, Federated States of
Gabon
United Kingdom
Georgia
Guernsey
Ghana
Gibraltar
Guinea
Guadeloupe
Gambia
Guinea-Bissau
Equatorial Guinea
Greece
Grenada
Greenland
Guatemala
French Guiana
Guam
Guyana
Hong Kong Special Administrative Region
Heard Island and McDonald Islands
Honduras
Croatia
Haiti
Hungary
Indonesia
Isle of Man
India
British Indian Ocean Territory
Ireland, Republic of
Iran
Iraq
Iceland
Israel
Italy
Jamaica
Jersey
Jordan
Japan
Kazakhstan
Kenya
Kyrgyzstan
Cambodia
Kiribati
Saint Kitts and Nevis
Korea, South
Kuwait
Laos
Lebanon
Liberia
Libya
Saint Lucia
Liechtenstein
Sri Lanka
Lesotho
Lithuania
Luxembourg
Latvia
Macao Special Administrative Region
Saint Martin (French part)
Morocco
Monaco
Moldova
Madagascar
Maldives
Marshall Islands
Macedonia, Republic of
Mali
Malta
Burma (Myanmar)
Montenegro
Mongolia
Northern Mariana Islands
Mozambique
Mauritania
Montserrat
Martinique
Mauritius
Malawi
Malaysia
Mayotte
Namibia
New Caledonia
Niger
Norfolk Island
Nigeria
Nicaragua
Niue
Netherlands
Norway
Nepal
Nauru
New Zealand
Oman
Pakistan
Panama
Pitcairn
Peru
Philippines
Palau
Papua New Guinea
Poland
Puerto Rico
Korea, North
Portugal
Paraguay
West Bank and Gaza Strip (Palestine)
French Polynesia
Qatar
Réunion
Romania
Russian Federation
Rwanda
Saudi Arabia
Sudan
Senegal
Singapore
South Georgia and the South Sandwich Islands
Saint Helena
Svalbard and Jan Mayen
Solomon Islands
Sierra Leone
El Salvador
San Marino
Somalia
Saint Pierre and Miquelon
Serbia
Sao Tome and Principe
Suriname
Slovakia
Slovenia
Sweden
Swaziland
Sint Maarten (Dutch part)
Seychelles
Syria
Turks and Caicos Islands
Chad
Togo
Thailand
Tajikistan
Tokelau
Turkmenistan
Timor-Leste
Tonga
Trinidad and Tobago
Tunisia
Turkey
Tuvalu
Taiwan
Tanzania
Uganda
Ukraine
United States Minor Outlying Islands
Uruguay
Uzbekistan
Holy See (Vatican City State)
Saint Vincent and the Grenadines
Venezuela
Virgin Islands, British
Virgin Islands, United States
Viet Nam
Vanuatu
Wallis and Futuna
Samoa
Kosovo
Yemen
South Africa, Republic of
Zambia
Zimbabwe
Changes or events
1. Indicate any changes or events that affected the reported values for this business or organization, compared with the last reporting period.
Select all that apply.
Strike or lock-out
Exchange rate impact
Price changes in goods or services sold
Contracting out
Organisational change
Price changes in labour or raw materials
Natural disaster
Recession
Change in product line
Sold business units
Expansion
New or lost contract
Plant closures
Acquisition of business units
Other
Specify the other changes or events
No changes or events
Contact person
1. Statistics Canada may need to contact the person who completed this questionnaire for further information. Is Provided Given Names Provided Family Name the best person to contact?
Yes
No
Who is the best person to contact about this questionnaire?
First name
Last name
Title
Email address
Telephone number (including area code)
Extension number (if applicable) The maximum number of characters is 5.
Fax number (including area code)
Feedback
1. How long did it take to complete this questionnaire?
Include the time spent gathering the necessary information.
Hours
Minutes
2. We invite your comments about this questionnaire.
This survey is conducted by Statistics Canada in order to collect the necessary information to support the Integrated Business Statistics Program (IBSP). This program combines various survey and administrative data to develop comprehensive measures of the Canadian economy.
The statistical information from the IBSP serves many purposes, including:
Calculating each province and territory's fair share of federal-provincial transfer payments for health, education and social programs
Establishing government programs to assist businesses
Assisting the business community in negotiating contracts and collective agreements
Supporting the government in making informed decisions about fiscal, monetary and foreign exchange policies
Indexing social benefit programs and determining tax brackets
Enabling academics and economists to analyze the economic performance of Canadian industries and to better understand rapidly evolving business environments.
Your information may also be used by Statistics Canada for other statistical and research purposes.
Your participation in this survey is required under the authority of the Statistics Act.
Other important information
Authorization to collect this information
Data are collected under the authority of the Statistics Act, Revised Statutes of Canada, 1985, Chapter S-19.
Confidentiality
By law, Statistics Canada is prohibited from releasing any information it collects that could identify any person, business, or organization, unless consent has been given by the respondent, or as permitted by the Statistics Act. Statistics Canada will use the information from this survey for statistical purposes only.
Record linkages
To enhance the data from this survey and to reduce respondent burden, Statistics Canada may combine it with information from other surveys or from administrative sources.
Data-sharing agreements
To reduce respondent burden, Statistics Canada has entered into data-sharing agreements with provincial and territorial statistical agencies and other government organizations, which have agreed to keep the data confidential and use them only for statistical purposes. Statistics Canada will only share data from this survey with those organizations that have demonstrated a requirement to use the data.
Section 11 of the Statistics Act provides for the sharing of information with provincial and territorial statistical agencies that meet certain conditions. These agencies must have the legislative authority to collect the same information, on a mandatory basis, and the legislation must provide substantially the same provisions for confidentiality and penalties for disclosure of confidential information as the Statistics Act. Because these agencies have the legal authority to compel businesses to provide the same information, consent is not requested and businesses may not object to the sharing of the data.
For this survey, there are Section 11 agreements with the provincial and territorial statistical agencies of Newfoundland and Labrador, Nova Scotia, New Brunswick, Québec, Ontario, Manitoba, Saskatchewan, Alberta, British Columbia and the Yukon. The shared data will be limited to information pertaining to business establishments located within the jurisdiction of the respective province or territory.
Section 12 of the Statistics Act provides for the sharing of information with federal, provincial or territorial government organizations. Under Section 12, you may refuse to share your information with any of these organizations by writing a letter of objection to the Chief Statistician, specifying the organizations with which you do not want Statistics Canada to share your data and mailing it to the following address:
Chief Statistician of Canada
Statistics Canada
Attention of Director, Enterprise Statistics Division
150 Tunney's Pasture Driveway
Ottawa, Ontario
K1A 0T6
For this survey, there are Section 12 agreements with the statistical agencies of Prince Edward Island, the Northwest Territories and Nunavut.
For agreements with provincial and territorial government organizations, the shared data will be limited to information pertaining to business establishments located within the jurisdiction of the respective province or territory.
Business or organization and contact information
1. Please verify or provide the business or organization's legal and operating name and correct where needed.
Note: Legal name modifications should only be done to correct a spelling error or typo.
Legal Name
The legal name is one recognized by law, thus it is the name liable for pursuit or for debts incurred by the business or organization. In the case of a corporation, it is the legal name as fixed by its charter or the statute by which the corporation was created.
Modifications to the legal name should only be done to correct a spelling error or typo.
To indicate a legal name of another legal entity you should instead indicate it in question 3 by selecting 'Not currently operational' and then choosing the applicable reason and providing the legal name of this other entity along with any other requested information.
Operating Name
The operating name is a name the business or organization is commonly known as if different from its legal name. The operating name is synonymous with trade name.
Legal name
Operating name (if applicable)
2. Please verify or provide the contact information of the designated business or organization contact person for this questionnaire and correct where needed.
Note: The designated contact person is the person who should receive this questionnaire. The designated contact person may not always be the one who actually completes the questionnaire.
First name
Last name
Title
Preferred language of communication
English
French
Mailing address (number and street)
City
Province, territory or state
Postal code or ZIP code
Country
Canada
United States
Email address
Telephone number (including area code)
Extension number (if applicable) The maximum number of characters is 5.
Fax number (including area code)
3. Please verify or provide the current operational status of the business or organization identified by the legal and operating name above.
Operational
Not currently operational
Why is this business or organization not currently operational?
Operational
Not currently operational
Why is this business or organization not currently operational?
Seasonal operations
When did this business or organization close for the season? Date
When does this business or organization expect to resume operations? Date
Ceased operations
When did this business or organization cease operations? Date
Why did this business or organization cease operations?
Bankruptcy
Liquidation
Dissolution
Other
Specify the other reasons for ceased operations
Sold operations
When was this business or organization sold? Date
What is the legal name of the buyer?
Amalgamated with other businesses or organizations
When did this business or organization amalgamate? Date
What is the legal name of the resulting or continuing business or organization?
What are the legal names of the other amalgamated businesses or organizations?
Temporarily inactive but will re-open
When did this business or organization become temporarily inactive? Date
When does this business or organization expect to resume operations? Date
Why is this business or organization temporarily inactive?
No longer operating due to other reasons
When did this business or organization cease operations? Date
Why did this business or organization cease operations?
4. Please verify or provide the current main activity of the business or organization identified by the legal and operating name above.
Note: The described activity was assigned using the North American Industry Classification System (NAICS).
This question verifies the business or organization's current main activity as classified by the North American Industry Classification System (NAICS). The North American Industry Classification System (NAICS) is an industry classification system developed by the statistical agencies of Canada, Mexico and the United States. Created against the background of the North American Free Trade Agreement, it is designed to provide common definitions of the industrial structure of the three countries and a common statistical framework to facilitate the analysis of the three economies. NAICS is based on supply-side or production-oriented principles, to ensure that industrial data, classified to NAICS, are suitable for the analysis of production-related issues such as industrial performance.
The target entity for which NAICS is designed are businesses and other organizations engaged in the production of goods and services. They include farms, incorporated and unincorporated businesses and government business enterprises. They also include government institutions and agencies engaged in the production of marketed and non-marketed services, as well as organizations such as professional associations and unions and charitable or non-profit organizations and the employees of households.
The associated NAICS should reflect those activities conducted by the business or organizational units targeted by this questionnaire only, as identified in the 'Answering this questionnaire' section and which can be identified by the specified legal and operating name. The main activity is the activity which most defines the targeted business or organization's main purpose or reason for existence. For a business or organization that is for-profit, it is normally the activity that generates the majority of the revenue for the entity.
The NAICS classification contains a limited number of activity classifications; the associated classification might be applicable for this business or organization even if it is not exactly how you would describe this business or organization's main activity.
Please note that any modifications to the main activity through your response to this question might not necessarily be reflected prior to the transmitting of subsequent questionnaires and as a result they may not contain this updated information.
The following is the detailed description including any applicable examples or exclusions for the classification currently associated with this business or organization.
Description and examples
This is the current main activity.
This is not the current main activity.
Please provide a brief but precise description of this business or organization's main activity.
e.g., breakfast cereal manufacturing, shoe store, software development
Main activity
5. You indicated that is not the current main activity. Was this business or organization's main activity ever classified as: ?
Yes
When did the main activity change? Date
No
6. Please search and select the industry classification code that best corresponds to this business or organization's main activity.
Select this business or organization's activity sector (optional)
Farming or logging operation
Construction company or general contractor
Manufacturer
Wholesaler
Retailer
Provider of passenger or freight transportation
Provider of investment, savings or insurance products
Real estate agency, real estate brokerage or leasing company
Provider of professional, scientific or technical services
Provider of health care or social services
Restaurant, bar, hotel, motel or other lodging establishment
Other sector
7. You have indicated that the current main activity of this business or organization is: Main activity Are there any other activities that contribute significantly (at least 10%) to this business or organization's revenue?
Yes, there are other activities.
No, that is the only significant activity.
Please provide a brief but precise description of this business or organization's secondary activity.
e.g., breakfast cereal manufacturing, shoe store, software development
8. Approximately what percentage of this business or organization's revenue is generated by each of the following activities?
When precise figures are not available, please provide your best estimates.
Percentage of revenue
Table summary
This table contains no data. It is an example of an empty data table used by respondents to provide data to Statistics Canada.
Percentage of revenue
Main activity
Secondary activity
All other activities
Total percentage
Reporting period information
1. What are the start and end dates of this business's or organization's most recently completed fiscal year?
Note: For the survey, the end date should fall between April 1, YYYY and March 31, YYYY+1 .
Here are twelve common fiscal periods that fall within the targeted dates:
May 1, YYYY-1 to April 30, YYYY
June 1, YYYY-1 to May 31, YYYY
July 1, YYYY-1 to June 30, YYYY
August 1, YYYY-1 to July 31, YYYY
September 1, YYYY-1 to August 31, YYYY
October 1, YYYY-1 to September 30, YYYY
November 1, YYYY-1 to October 31, YYYY
December 1, YYYY-1 to November 30, YYYY
January 1, YYYY to December 31, YYYY
February 1, YYYY to January 31, YYYY+1
March 1, YYYY to February 28, YYYY+1
April 1, YYYY to March 31, YYYY+1 .
Here are other examples of fiscal periods that fall within the required dates:
September 18, YYYY-1 to September 15, YYYY (e.g., floating year-end)
June 1, YYYY to December 31, YYYY (e.g., a newly opened business)
Fiscal Year-Start date
Fiscal Year-End date
2. What is the reason the reporting period does not cover a full year?
Select all that apply.
Seasonal operations
New business
Change of ownership
Temporarily inactive
Change of fiscal year
Ceased operations
Other
Specify reason the reporting period does not cover a full year
Revenue
1. For the reporting period of YYYY-MM-DD to YYYY-MM-DD , what was this business's revenue from each of the following sources?
Notes:
a detailed breakdown may be requested in other sections
these questions are asked of many different industries. Some questions may not apply to this business
Please report all amounts in thousands of Canadian dollars.
Revenue
a. Sales of goods and services (e.g., fees, commissions, services revenue)
Report net of returns and allowances.
Sales of goods and services are defined as amounts derived from the sale of goods and services (cash or credit), falling within a business's ordinary activities. Sales should be reported net of trade discount, value added tax and other taxes based on sales.
Include:
sales from Canadian locations (domestic and export sales)
transfers to other business units or a head office of your firm.
Exclude:
transfers into inventory and consignment sales
federal, provincial and territorial sales taxes and excise duties and taxes
intercompany sales in consolidated financial statements.
b. Rental and leasing
Include: rental or leasing of apartments, commercial buildings, land, office space, residential housing, investments in co-tenancies and co-ownerships, hotel or motel rooms, long and short term vehicle leasing, machinery or equipment, storage lockers, etc.
c. Commissions
Include: commissions earned on the sale of products or services by businesses such as advertising agencies, brokers, insurance agents, lottery ticket sales, sales representatives and travel agencies - compensation could also be reported under this item (for example, compensation for collecting sales tax)
d. Subsidies (including grants, donations, fundraising and sponsorships)
Include:
non-repayable grants, contributions and subsidies from all levels of government
revenue from private sector (corporate and individual) sponsorships, donations and fundraising.
e. Royalties, rights, licensing and franchise fees
A royalty is defined as a payment received by the holder of a copyright, trademark or patent.
Include revenue received from the sale or use of all intellectual property rights of copyrighted materials such as musical, literary, artistic or dramatic works, sound recordings or the broadcasting of communication signals.
f. Dividends
Include:
dividend income
dividends from Canadian sources
dividends from foreign sources
patronage dividends.
Exclude equity income from investments in subsidiaries or affiliates.
g. Interest
Include:
investment revenue
interest from foreign sources
interest from Canadian bonds and debentures
interest from Canadian mortgage loans
interest from other Canadian sources.
Exclude equity income from investments in subsidiaries or affiliates.
h. Other revenue - please specify
Include amounts not included in questions a. to g.
Total revenue
The sum of sub-questions a. to h.
Other revenue - table
Table summary
This table contains no data. It is an example of an empty data table used by respondents to provide data to Statistics Canada.
CAN$ '000
Sales of goods and services
Rental and leasing
Commissions
Subsidies
Royalties, rights, licensing and franchise fees
Dividends
Interest
Other
Total revenue
1. In order to reduce future follow-up, please select one of the following options.
The reported value for total revenue $ ###### is significantly different than the $ ###### reported last reporting period.
I confirm that all values are correct.
I am unable to confirm that all values are correct.
The reported sales of goods and services entered $ ###### is significantly different than the $ ###### reported last reporting period.
I confirm that all values are correct.
I am unable to confirm that all values are correct.
E-Commerce
1. For the reporting period of YYYY-MM-DD to YYYY-MM-DD , what was this business's total revenue?
Include sales of goods and services; rental, leasing and property management; commissions; subsidies, grants, donations, fundraising and sponsorships; royalties; rights; licensing and franchise fees; dividends, interest and other revenue.
Please report all amounts in thousands of Canadian dollars.
Total revenue
2. For the reporting period of YYYY-MM-DD to YYYY-MM-DD , did this business have any e-commerce revenue?
E-commerce revenue: sales of goods and services conducted over the Internet with or without online payment.
Include all revenue for which an order is received and commitment to purchase is made via the Internet, although payment can be made by other means, such as orders made on web pages, an extranet, mobile devices or Electronic Data Interchange (EDI).
Exclude orders made by telephone, facsimile or e-mail.
Yes
No
3. Of the $ ###### in total revenue reported, what was the total e-commerce revenue?
If precise figures are not available, please provide your best estimate.
Total e-commerce revenue
4. For the reporting period of YYYY-MM-DD to YYYY-MM-DD , did this business make sales over the Internet through any of the following methods?
Select all that apply.
Mobile app
Include sales through any app, or application, that is downloaded and designed to run on a handheld device such as a smartphone or tablet (for example, places where a user may download these apps include Apple's App Store, Google Play or Blackberry App World).
Company website
Include sales through a browser-based website where your organization maintains control of the content.
Third-party website
Include sales through a browser-based website where a third-party maintains the structure of the website and control of the look and feel while your company only provides the product to be sold (for example, Amazon, Expedia, Etsy).
Electronic Data Interchange (EDI)
A standard format for exchanging business data. EDI is based on the use of message standards, ensuring that all participants use a common language.
Via a mobile app
Via your company website
Via a third-party website
Via Electronic Data Interchange (EDI)
Other
Specify the other methods
5. Does this business have any full-time staff dedicated solely to activities related to e-commerce?
Yes
No
6. Why did this business not make sales over the Internet?
Select all that apply.
Goods and services do not lend themselves to online sales
Prefer to maintain current business model
Lack of skilled workers to implement and maintain e-commerce infrastructure
Cost of development is too high
Security concerns
Other
Specify the other reasons
Expenses
1. For the reporting period of YYYY-MM-DD to YYYY-MM-DD , what were this business's expenses for the following items?
Notes:
a detailed breakdown may be requested in other sections
these questions are asked of many different industries. Some questions may not apply to this business
Please report all amounts in thousands of Canadian dollars.
Expenses
a. Cost of goods sold
Many business units distinguish their costs of materials from their other business expenses (selling, general and administrative). This item is included to allow you to easily record your costs/expenses according to your normal accounting practices.
Include:
cost of raw materials and/or goods purchased for resale - net of discounts earned on purchases
freight in and duty.
Exclude all costs associated with salaries, wages, benefits, commissions and subcontracts (report at Employment costs and expenses, and Subcontracts).
b. Employment costs and expenses
b1. Salaries, wages and commissions
Please report all salaries and wages (including taxable allowances and employment commissions as defined on the T4 - Statement of Remuneration Paid) before deductions for this reporting period.
Include:
vacation pay
bonuses (including profit sharing)
employee commissions
taxable allowances (e.g., room and board, vehicle allowances, gifts such as airline tickets for holidays)
severance pay.
Exclude all payments and expenses associated with casual labour and outside contract workers (report at Subcontracts).
b2. Employee benefits
Include contributions to:
health plans
insurance plans
employment insurance
pension plans
workers' compensation
association dues
contributions to any other employee benefits such as child care and supplementary unemployment benefit (SUB) plans
contributions to provincial and territorial health and education payroll taxes.
c. Subcontracts
Subcontract expense refers to the purchasing of services from outside of the company rather than providing them in-house.
Include:
hired casual labour and outside contract workers
custom work and contract work
subcontract and outside labour
hired labour.
d. Research and development fees
Expenses from activities conducted with the intention of making a discovery that could either lead to the development of new products or procedures, or to the improvement of existing products or procedures.
e. Professional and business fees
Include:
legal services
accounting and auditing fees
consulting fees
education and training fees
appraisal fees
management and administration fees
property management fees
information technology (IT) consulting and service fees (purchased)
architectural fees
engineering fees
scientific and technical service fees
other consulting fees (management, technical and scientific)
veterinary fees
fees for human health services
payroll preparation fees
all other professional and business service fees.
Exclude service fees paid to Head Office (report at All other costs and expenses).
f. Utilities
Utility expenses related to operating your business unit such as water, electricity, gas, heating and hydro.
Include:
diesel, fuel wood, natural gas, oil and propane
sewage.
Exclude:
energy expenses covered in your rental and leasing contracts
telephone, Internet and other telecommunications
vehicle fuel (report at All other costs and expenses).
g. Office and computer related expenses
Include:
office stationery and supplies, paper and other supplies for photocopiers, printers and fax machines
postage and courier (used in the day to day office business activity)
computer and peripherals upgrade expenses
data processing.
Exclude telephone, Internet and other telecommunication expenses (report at Telephone, Internet and other telecommunication).
h. Telephone, Internet and other telecommunication
Include:
internet
telephone and telecommunications
cellular telephone
fax machine
pager.
i. Business taxes, licenses and permits
Include:
property taxes paid directly and property transfer taxes
vehicle license fees
beverage taxes and business taxes
trade license fees
membership fees and professional license fees
provincial capital tax.
j. Royalties, franchise fees and memberships
Include:
amounts paid to holders of patents, copyrights, performing rights and trademarks
gross overriding royalty expenses and direct royalty costs
resident and non-resident royalty expenses
franchise fees.
Exclude Crown royalties
k. Crown charges
Federal or Provincial royalty, tax, lease or rental payments made in relation to the acquisition, development or ownership of Canadian resource properties.
Include:
Crown royalties
Crown leases and rentals
oil sand leases
stumpage fees.
l. Rental and leasing
Include:
lease rental expenses, real estate rental expenses, condominium fees and equipment rental expenses
motor vehicle rental and leasing expenses
studio lighting and scaffolding
machinery and equipment rental expenses
storage expenses
road and construction equipment rental
fuel and other utility costs covered in your rental and leasing contracts.
m. Repair and maintenance
Include:
buildings and structures
machinery and equipment
security equipment
vehicles
costs related to materials, parts and external labour associated with these expenses
janitorial and cleaning services and garbage removal.
n. Amortization and depreciation
Include:
direct cost depreciation of tangible assets and amortization of leasehold improvements
amortization of intangible assets (e.g., amortization of goodwill, patents, franchises, copyrights, trademarks, deferred charges, organizational costs).
o. Insurance
Insurance recovery income should be deducted from insurance expenses.
Include:
professional and other liability insurance
motor vehicle and property insurance
executive life insurance
bonding, business interruption insurance and fire insurance.
p. Advertising, marketing, promotion, meals and entertainment
Include:
newspaper advertising and media expenses
catalogues, presentations and displays
tickets for theatre, concerts and sporting events for business promotion
fundraising expenses
meals, entertainment and hospitality purchases for clients.
exploration and development (including prospect/geological, well abandonment & dry holes, exploration expenses, development expenses)
amounts not included in sub-questions a. to t. above.
Total expenses
The sum of sub-questions a. to u.
Total expenses - table
Table summary
This table contains no data. It is an example of an empty data table used by respondents to provide data to Statistics Canada.
CAN$ '000
Cost of goods sold
Opening inventories
Purchases
Closing inventories
Cost of goods sold
Employment costs and expenses
Salaries, wages and commissions
Employee benefits
Subcontracts
Research and development fees
Professional and business fees
Utilities
Office and computer related expenses
Telephone, Internet and other telecommunication
Business taxes, licenses and permits
Royalties, franchise fees and memberships
Crown charges
Rental and leasing
Repair and maintenance
Amortization and depreciation
Insurance
Advertising, marketing, promotion, meals and entertainment
Travel, meetings and conventions
Financial services
Interest expense
Other non-production-related costs and expenses
Other
Total expenses
1. In order to reduce future follow-up, please select one of the following options.
The value for total expenses $ ###### is significantly different than the $ ###### reported last reporting period.
I confirm that all values are correct.
I am unable to confirm that all values are correct.
Industry characteristics
1. What were this business's sales for each of the following goods and services?
Exclude subsidies, royalties, dividend and interest revenue.
Report all amounts in thousands of Canadian dollars.
Please provide a breakdown of your sales and services revenue, where applicable. Amounts should be reported net of trade discount, value added tax and other taxes based on sales.
Include sales from Canadian locations.
Exclude:
grants and subsidies
donations and fundraising
royalties, rights, licensing and franchise fees
investment income.
a. Admissions to live performances and events presented by this business
Include:
admissions through sale of general public tickets and seasonal subscriptions
bundled admission packages that include food and beverage service, backstage passes, etc.
personal seat licenses and box leases
admissions to live performances in which the admission takes the form of a cover charge
membership fees paid primarily for the right of admission to performances.
Exclude:
payments received for events and performances owned/produced/presented by other establishments using your facilities (report at question 1b.)
contract production (report at question 1d.).
b. Facility rental revenue
Please report your share of box office receipts for events or performances that were owned/produced/ presented by others using or renting your facilities.
d. Contract production
Fees earned by individuals, companies or teams for the production of live performances, sports or racing events under contract to promoters, venue owners or others. The contracts will specify the type of payment received by the performers, artists, companies, athletes or teams, for example a flat rate and/or a percentage of admission revenues. Contracts may also specify the disposition of any intellectual property rights arising from the performance.
Exclude:
contract production of literary, dramatic, musical and artistic works, sound recordings and communication signals (report at question 1m.)
licensing of copyrights relating to a live performance (report at question 2a.)
technical (non-performance) services (report at question 1g.).
e. Professional fees and commission for career management and representation services for artists, athletes, entertainers and others
Acting on behalf of artists, athletes, entertainers and other public figures in a wide range of activities that enhance the client's career.
Include negotiating contracts and bookings performances and public appearances.
f. Event management services
Planning, organizing, marketing and managing a live sports or performing arts event on behalf of others including venue owners, performers, etc.
g. Technical artistic services
Providing artistic technical support services, such as backstage services and post-production services.
Include:
lighting, key grip and set placement and removal
editing, visual effects, copying, captioning, adding music and foreign language dubbing.
i. Advertising revenue
Revenue obtained by providing services that attract attention to a product, business, cause, etc.
Include:
the provision of display space on various surfaces such as billboards
agent services involved in buying and selling space or time for advertising messages
the sale of venue naming rights, sponsorship rights, endorsement services and exclusivity rights.
j. Sales of food and non-alcoholic beverages
Include:
prepared meals
packaged food
vending machine sales.
l. Sales of merchandise
Revenue obtained from parts and materials charged in repair work as well as from the sales of all items other than food or beverages.
Include:
recreational and sports equipment and accessories
oil and gasoline
clothing
arts and crafts
magazines.
Sales of merchandise - table
Table summary
This table contains no data. It is an example of an empty data table used by respondents to provide data to Statistics Canada.
CAN$ '000
Admissions to live performances and events presented by this business
For live performing arts performances, festivals and fairs
For live sports and racing events
For other events
Total
Facility rental revenue
For live performing arts performances, festivals and fairs
For live sports and racing events
For other events
Total
Rental revenue from traveller accommodations
Contract production
Professional fees and commissions for career management and representation services for artists, athletes, entertainers and others
Event management services
Technical artistic services
Receipts from gambling
Advertising revenue
Sales of food and non-alcoholic beverages
Sales of alcoholic beverages
Sales of merchandise
All other goods and services
Total sales of goods and services
In order to reduce future follow-up, please select one of the following options.
Your total sales $ ###### is significantly different than the $ ###### reported last reporting period.
I confirm that all values are correct.
I am unable to confirm that all values are correct.
2. What was this business's revenue from the following royalties, rights, licensing and franchise fees?
Revenues from royalties, rights, licensing and franchise fees
a. Licensing of rights to use copyrighted works and trademarks
Licensing the rights to use copyrighted intellectual property and trademarks, such as logos. Licenses authorize the licensee to exploit the copyrighted work, for example: to reproduce or perform a literary or musical piece of work by making a sound or video recording of the piece, to rent a computer program to make a recording of a particular performance. A license may authorize some or all of these rights.
Include licenses to use:
literary works such as book manuscripts and computer programs
dramatic works such as films, videos, plays, screenplays and scripts
musical works
artistic works such as paintings and photographs
actor's or singer's performances
broadcast communication signals
sound recordings.
b. Broadcast and other media rights
Granting the right of access (on a fee, royalty, or other basis) to a sporting event, facility or activity for the purpose of commercially exploiting sounds, images and other information of the event, facility or activity. The contracts define the type of exploitation permitted and may specify the ownership of intellectual property rights relating to the sounds, images and other information.
Broadcast and other media rights - table
Table summary
This table contains no data. It is an example of an empty data table used by respondents to provide data to Statistics Canada.
CAN$ '000
Licensing of rights to use copyrighted works and trademarks
Broadcast and other media rights
All other royalties, rights, licensing and franchise fees
Total royalties, rights, licenses and franchise fees
In order to reduce future follow-up, please select one of the following options.
Your total sales $ ###### is significantly different than the $ ###### reported last reporting period.
I confirm that all values are correct.
I am unable to confirm that all values are correct.
3. For the reporting period of YYYY-MM-DD to YYYY-MM-DD , what was the attendance for the following performances and events?
If a particular category does not apply to this business, leave the field blank. If records are not kept, please provide your best estimate.
Attendance
Live sports and racing events and Live performing arts performances, festivals and fairs
a. and c. Presented by this business
Please report attendance numbers for presentations that are produced/owned by your establishment.
b. and d. Presented by others using this business's facilities (such as rentals)
Please report attendance numbers for presentations that are produced/owned by another establishment.
Number of spectators
Live sports and racing events
Presented by this business
Presented by others using this business's facilities
Live performing arts performances, festivals and fairs
Presented by this business
Presented by others using this business's facilities
Sales by type of client
1. What was this business's breakdown of sales by the following types of client?
Sales by type of client
This section is designed to measure which sector of the economy purchases your services.
Please provide a percentage breakdown of your sales by type of client.
Please ensure that the sum of percentages reported in this section equals 100%.
a. to c. Clients in Canada
a. Individuals and households
Please report the percentage of sales to individuals and households who do not represent the business or government sector.
b. Businesses
Percentage of sales sold to the business sector should be reported here.
Include sales to Crown corporations.
c. Governments, not-for-profit organizations and public institutions (e.g., hospitals, schools)
Percentage of sales to federal, provincial, territorial and municipal governments should be reported here.
Include: sales to hospitals, schools, universities and public utilities.
d. Clients outside Canada
Please report the percentage of total sales to customers or clients located outside Canada including foreign businesses, foreign individuals, foreign institutions and/or governments.
Include sales to foreign subsidiaries and affiliates.
Clients outside Canada - table
Table summary
This table contains no data. It is an example of an empty data table used by respondents to provide data to Statistics Canada.
Percentage
Clients in Canada — individuals and households
Clients in Canada — businesses
Clients in Canada — governments, not-for-profit organizations and public institutions
Clients outside of Canada
Total percentage
International transactions - Revenue received from exports
1. During the reporting period of YYYY-MM-DD to YYYY-MM-DD , did this business receive revenue from clients outside Canada for the sale of products, services, royalties, rights, licensing or franchise fees?
International transactions
This section is intended to measure the value of international transactions on goods, services, royalties and licenses fees. It covers imported services and goods purchased outside Canada as well as the value of exported services and goods to clients/customers outside Canada. Please report also royalties, rights, licensing and franchise fees paid to and/or received from outside Canada. Services cover a variety of industrial, professional, trade and business services.
Yes
No
2. What was the revenue received from clients outside Canada?
International transactions
This section is intended to measure the value of international transactions on goods, services, royalties and licenses fees. It covers imported services and goods purchased outside Canada as well as the value of exported services and goods to clients/customers outside Canada. Please report also royalties, rights, licensing and franchise fees paid to and/or received from outside Canada. Services cover a variety of industrial, professional, trade and business services.
Revenue received ( CAN$ '000)
3. What was the percentage breakdown of revenue received from clients outside Canada by goods, services and royalties?
International transactions
This section is intended to measure the value of international transactions on goods, services, royalties and licenses fees. It covers imported services and goods purchased outside Canada as well as the value of exported services and goods to clients/customers outside Canada. Please report also royalties, rights, licensing and franchise fees paid to and/or received from outside Canada. Services cover a variety of industrial, professional, trade and business services.
International transactions - table
Table summary
This table contains no data. It is an example of an empty data table used by respondents to provide data to Statistics Canada.
Percentage
Goods
Services
Royalties, rights, licensing and franchise fees
Total percentage
4. What was the percentage breakdown of revenue received from clients outside Canada by country?
International transactions
This section is intended to measure the value of international transactions on goods, services, royalties and licenses fees. It covers imported services and goods purchased outside Canada as well as the value of exported services and goods to clients/customers outside Canada. Please report also royalties, rights, licensing and franchise fees paid to and/or received from outside Canada. Services cover a variety of industrial, professional, trade and business services.
International transactions - table
Table summary
This table contains no data. It is an example of an empty data table used by respondents to provide data to Statistics Canada.
Percentage
United States
Mexico
Provide the percentage of revenue received from any other countries - top 4 clients only
Other 1 - specify
Other 2 - specify
Other 3 - specify
Other 4 - specify
Total percentage
List of countries
Aruba
Afghanistan
Angola
Anguilla
Åland Islands
Albania
Andorra
United Arab Emirates
Argentina
Armenia
American Samoa
Antarctica
French Southern Territories
Antigua and Barbuda
Australia
Austria
Azerbaijan
Burundi
Belgium
Benin
Bonaire, Saint Eustatius and Saba
Burkina Faso
Bangladesh
Bulgaria
Bahrain
Bahamas
Bosnia and Herzegovina
Saint Barthélemy
Belarus
Belize
Bermuda
Bolivia
Brazil
Barbados
Brunei Darussalam
Bhutan
Bouvet Island
Botswana
Central African Republic
Cocos (Keeling) Islands
Switzerland
Chile
China
Côte d'Ivoire
Cameroon
Congo, The Democratic Republic of the
Congo, Republic of the
Cook Islands
Colombia
Comoros
Cape Verde
Costa Rica
Cuba
Curaçao
Christmas Island
Cayman Islands
Cyprus
Czech Republic
Germany
Djibouti
Dominica
Denmark
Dominican Republic
Algeria
Ecuador
Egypt
Eritrea
Western Sahara
Spain
Estonia
Ethiopia
Finland
Fiji
Falkland Islands (Malvinas)
France
Faroe Islands
Micronesia, Federated States of
Gabon
United Kingdom
Georgia
Guernsey
Ghana
Gibraltar
Guinea
Guadeloupe
Gambia
Guinea-Bissau
Equatorial Guinea
Greece
Grenada
Greenland
Guatemala
French Guiana
Guam
Guyana
Hong Kong Special Administrative Region
Heard Island and McDonald Islands
Honduras
Croatia
Haiti
Hungary
Indonesia
Isle of Man
India
British Indian Ocean Territory
Ireland, Republic of
Iran
Iraq
Iceland
Israel
Italy
Jamaica
Jersey
Jordan
Japan
Kazakhstan
Kenya
Kyrgyzstan
Cambodia
Kiribati
Saint Kitts and Nevis
Korea, South
Kuwait
Laos
Lebanon
Liberia
Libya
Saint Lucia
Liechtenstein
Sri Lanka
Lesotho
Lithuania
Luxembourg
Latvia
Macao Special Administrative Region
Saint Martin (French part)
Morocco
Monaco
Moldova
Madagascar
Maldives
Marshall Islands
Macedonia, Republic of
Mali
Malta
Burma (Myanmar)
Montenegro
Mongolia
Northern Mariana Islands
Mozambique
Mauritania
Montserrat
Martinique
Mauritius
Malawi
Malaysia
Mayotte
Namibia
New Caledonia
Niger
Norfolk Island
Nigeria
Nicaragua
Niue
Netherlands
Norway
Nepal
Nauru
New Zealand
Oman
Pakistan
Panama
Pitcairn
Peru
Philippines
Palau
Papua New Guinea
Poland
Puerto Rico
Korea, North
Portugal
Paraguay
West Bank and Gaza Strip (Palestine)
French Polynesia
Qatar
Réunion
Romania
Russian Federation
Rwanda
Saudi Arabia
Sudan
Senegal
Singapore
South Georgia and the South Sandwich Islands
Saint Helena
Svalbard and Jan Mayen
Solomon Islands
Sierra Leone
El Salvador
San Marino
Somalia
Saint Pierre and Miquelon
Serbia
Sao Tome and Principe
Suriname
Slovakia
Slovenia
Sweden
Swaziland
Sint Maarten (Dutch part)
Seychelles
Syria
Turks and Caicos Islands
Chad
Togo
Thailand
Tajikistan
Tokelau
Turkmenistan
Timor-Leste
Tonga
Trinidad and Tobago
Tunisia
Turkey
Tuvalu
Taiwan
Tanzania
Uganda
Ukraine
United States Minor Outlying Islands
Uruguay
Uzbekistan
Holy See (Vatican City State)
Saint Vincent and the Grenadines
Venezuela
Virgin Islands, British
Virgin Islands, United States
Viet Nam
Vanuatu
Wallis and Futuna
Samoa
Kosovo
Yemen
South Africa, Republic of
Zambia
Zimbabwe
5. During the reporting period of YYYY-MM-DD to YYYY-MM-DD , did this business make payments to suppliers outside Canada for the purchase of products, services, royalties, rights, licensing or franchise fees?
International transactions
This section is intended to measure the value of international transactions on goods, services, royalties and licenses fees. It covers imported services and goods purchased outside Canada as well as the value of exported services and goods to clients/customers outside Canada. Please report also royalties, rights, licensing and franchise fees paid to and/or received from outside Canada. Services cover a variety of industrial, professional, trade and business services.
Yes
No
6. What were the payments made to suppliers outside Canada?
International transactions
This section is intended to measure the value of international transactions on goods, services, royalties and licenses fees. It covers imported services and goods purchased outside Canada as well as the value of exported services and goods to clients/customers outside Canada. Please report also royalties, rights, licensing and franchise fees paid to and/or received from outside Canada. Services cover a variety of industrial, professional, trade and business services.
Payments made ( CAN$ '000)
7. What was the percentage breakdown of payments made to suppliers outside Canada by goods, services and royalties?
International transactions
This section is intended to measure the value of international transactions on goods, services, royalties and licenses fees. It covers imported services and goods purchased outside Canada as well as the value of exported services and goods to clients/customers outside Canada. Please report also royalties, rights, licensing and franchise fees paid to and/or received from outside Canada. Services cover a variety of industrial, professional, trade and business services.
International transactions - table
Table summary
This table contains no data. It is an example of an empty data table used by respondents to provide data to Statistics Canada.
Percentage
Goods
Services
Royalties, rights, licensing and franchise fees
Total percentage
8. What was the percentage breakdown of payments made to suppliers outside Canada by country?
International transactions
This section is intended to measure the value of international transactions on goods, services, royalties and licenses fees. It covers imported services and goods purchased outside Canada as well as the value of exported services and goods to clients/customers outside Canada. Please report also royalties, rights, licensing and franchise fees paid to and/or received from outside Canada. Services cover a variety of industrial, professional, trade and business services.
International transactions -table
Table summary
This table contains no data. It is an example of an empty data table used by respondents to provide data to Statistics Canada.
Percentage
United States
Mexico
Provide the percentage of payments made to any other countries - top 4 clients only
Other 1 - specify
Other 2 - specify
Other 3 - specify
Other 4 - specify
Total percentage
List of countries
Aruba
Afghanistan
Angola
Anguilla
Åland Islands
Albania
Andorra
United Arab Emirates
Argentina
Armenia
American Samoa
Antarctica
French Southern Territories
Antigua and Barbuda
Australia
Austria
Azerbaijan
Burundi
Belgium
Benin
Bonaire, Saint Eustatius and Saba
Burkina Faso
Bangladesh
Bulgaria
Bahrain
Bahamas
Bosnia and Herzegovina
Saint Barthélemy
Belarus
Belize
Bermuda
Bolivia
Brazil
Barbados
Brunei Darussalam
Bhutan
Bouvet Island
Botswana
Central African Republic
Cocos (Keeling) Islands
Switzerland
Chile
China
Côte d'Ivoire
Cameroon
Congo, The Democratic Republic of the
Congo, Republic of the
Cook Islands
Colombia
Comoros
Cape Verde
Costa Rica
Cuba
Curaçao
Christmas Island
Cayman Islands
Cyprus
Czech Republic
Germany
Djibouti
Dominica
Denmark
Dominican Republic
Algeria
Ecuador
Egypt
Eritrea
Western Sahara
Spain
Estonia
Ethiopia
Finland
Fiji
Falkland Islands (Malvinas)
France
Faroe Islands
Micronesia, Federated States of
Gabon
United Kingdom
Georgia
Guernsey
Ghana
Gibraltar
Guinea
Guadeloupe
Gambia
Guinea-Bissau
Equatorial Guinea
Greece
Grenada
Greenland
Guatemala
French Guiana
Guam
Guyana
Hong Kong Special Administrative Region
Heard Island and McDonald Islands
Honduras
Croatia
Haiti
Hungary
Indonesia
Isle of Man
India
British Indian Ocean Territory
Ireland, Republic of
Iran
Iraq
Iceland
Israel
Italy
Jamaica
Jersey
Jordan
Japan
Kazakhstan
Kenya
Kyrgyzstan
Cambodia
Kiribati
Saint Kitts and Nevis
Korea, South
Kuwait
Laos
Lebanon
Liberia
Libya
Saint Lucia
Liechtenstein
Sri Lanka
Lesotho
Lithuania
Luxembourg
Latvia
Macao Special Administrative Region
Saint Martin (French part)
Morocco
Monaco
Moldova
Madagascar
Maldives
Marshall Islands
Macedonia, Republic of
Mali
Malta
Burma (Myanmar)
Montenegro
Mongolia
Northern Mariana Islands
Mozambique
Mauritania
Montserrat
Martinique
Mauritius
Malawi
Malaysia
Mayotte
Namibia
New Caledonia
Niger
Norfolk Island
Nigeria
Nicaragua
Niue
Netherlands
Norway
Nepal
Nauru
New Zealand
Oman
Pakistan
Panama
Pitcairn
Peru
Philippines
Palau
Papua New Guinea
Poland
Puerto Rico
Korea, North
Portugal
Paraguay
West Bank and Gaza Strip (Palestine)
French Polynesia
Qatar
Réunion
Romania
Russian Federation
Rwanda
Saudi Arabia
Sudan
Senegal
Singapore
South Georgia and the South Sandwich Islands
Saint Helena
Svalbard and Jan Mayen
Solomon Islands
Sierra Leone
El Salvador
San Marino
Somalia
Saint Pierre and Miquelon
Serbia
Sao Tome and Principe
Suriname
Slovakia
Slovenia
Sweden
Swaziland
Sint Maarten (Dutch part)
Seychelles
Syria
Turks and Caicos Islands
Chad
Togo
Thailand
Tajikistan
Tokelau
Turkmenistan
Timor-Leste
Tonga
Trinidad and Tobago
Tunisia
Turkey
Tuvalu
Taiwan
Tanzania
Uganda
Ukraine
United States Minor Outlying Islands
Uruguay
Uzbekistan
Holy See (Vatican City State)
Saint Vincent and the Grenadines
Venezuela
Virgin Islands, British
Virgin Islands, United States
Viet Nam
Vanuatu
Wallis and Futuna
Samoa
Kosovo
Yemen
South Africa, Republic of
Zambia
Zimbabwe
Changes or events
1. Indicate any changes or events that affected the reported values for this business or organization, compared with the last reporting period.
Select all that apply.
Strike or lock-out
Exchange rate impact
Price changes in goods or services sold
Contracting out
Organisational change
Price changes in labour or raw materials
Natural disaster
Recession
Change in product line
Sold business units
Expansion
New or lost contract
Plant closures
Acquisition of business units
Other
Specify the other changes or events
No changes or events
Contact person
1. Statistics Canada may need to contact the person who completed this questionnaire for further information. Is Provided Given Names Provided Family Name the best person to contact?
Yes
No
Who is the best person to contact about this questionnaire?
First name
Last name
Title
Email address
Telephone number (including area code)
Extension number (if applicable) The maximum number of characters is 5.
Fax number (including area code)
Feedback
1. How long did it take to complete this questionnaire?
Include the time spent gathering the necessary information.
Hours
Minutes
2. We invite your comments about this questionnaire.
This survey is conducted by Statistics Canada in order to collect the necessary information to support the Integrated Business Statistics Program (IBSP). This program combines various survey and administrative data to develop comprehensive measures of the Canadian economy.
The statistical information from the IBSP serves many purposes, including:
calculating each province and territory's fair share of federal-provincial transfer payments for health, education and social programs
establishing government programs to assist businesses
assisting the business community in negotiating contracts and collective agreements
supporting the government in making informed decisions about fiscal, monetary and foreign exchange policies
indexing social benefit programs and determining tax brackets
enabling academics and economists to analyze the economic performance of Canadian industries and to better understand rapidly evolving business environments.
Your information may also be used by Statistics Canada for other statistical and research purposes.
Your participation in this survey is required under the authority of the Statistics Act.
Other important information
Authorization to collect this information
Data are collected under the authority of the Statistics Act, Revised Statutes of Canada, 1985, Chapter S-19.
Confidentiality
By law, Statistics Canada is prohibited from releasing any information it collects that could identify any person, business, or organization, unless consent has been given by the respondent, or as permitted by the Statistics Act. Statistics Canada will use the information from this survey for statistical purposes only.
Record linkages
To enhance the data from this survey and to reduce the reporting burden, Statistics Canada may combine the acquired data with information from other surveys or from administrative sources.
Data-sharing agreements
To reduce respondent burden, Statistics Canada has entered into data-sharing agreements with provincial and territorial statistical agencies and other government organizations, which have agreed to keep the data confidential and use them only for statistical purposes. Statistics Canada will only share data from this survey with those organizations that have demonstrated a requirement to use the data.
Section 11 of the Statistics Act provides for the sharing of information with provincial and territorial statistical agencies that meet certain conditions. These agencies must have the legislative authority to collect the same information, on a mandatory basis, and the legislation must provide substantially the same provisions for confidentiality and penalties for disclosure of confidential information as the Statistics Act. Because these agencies have the legal authority to compel businesses to provide the same information, consent is not requested and businesses may not object to the sharing of the data.
For this survey, there are Section 11 agreements with the provincial and territorial statistical agencies of Newfoundland and Labrador, Nova Scotia, New Brunswick, Québec, Ontario, Manitoba, Saskatchewan, Alberta, British Columbia and the Yukon. The shared data will be limited to information pertaining to business establishments located within the jurisdiction of the respective province or territory.
Section 12 of the Statistics Act provides for the sharing of information with federal, provincial or territorial government organizations. Under Section 12, you may refuse to share your information with any of these organizations by writing a letter of objection to the Chief Statistician, specifying the organizations with which you do not want Statistics Canada to share your data and mailing it to the following address:
Chief Statistician of Canada
Statistics Canada
Attention of Director, Enterprise Statistics Division
150 Tunney's Pasture Driveway
Ottawa, Ontario
K1A 0T6
For this survey, there are Section 12 agreements with the statistical agencies of Prince Edward Island, the Northwest Territories and Nunavut.
For agreements with provincial and territorial government organizations, the shared data will be limited to information pertaining to business establishments located within the jurisdiction of the respective province or territory.
Business or organization and contact information
1. Please verify or provide the business or organization's legal and operating name and correct where needed.
Note: Legal name modifications should only be done to correct a spelling error or typo.
Legal Name
The legal name is one recognized by law, thus it is the name liable for pursuit or for debts incurred by the business or organization. In the case of a corporation, it is the legal name as fixed by its charter or the statute by which the corporation was created.
Modifications to the legal name should only be done to correct a spelling error or typo.
To indicate a legal name of another legal entity you should instead indicate it in question 3 by selecting 'Not currently operational' and then choosing the applicable reason and providing the legal name of this other entity along with any other requested information.
Operating Name
The operating name is a name the business or organization is commonly known as if different from its legal name. The operating name is synonymous with trade name.
Legal name
Operating name (if applicable)
2. Please verify or provide the contact information of the designated business or organization contact person for this questionnaire and correct where needed.
Note: The designated contact person is the person who should receive this questionnaire. The designated contact person may not always be the one who actually completes the questionnaire.
First name
Last name
Title
Preferred language of communication
English
French
Mailing address (number and street)
City
Province, territory or state
Postal code or ZIP code
Country
Canada
United States
Email address
Telephone number (including area code)
Extension number (if applicable) The maximum number of characters is 5.
Fax number (including area code)
3. Please verify or provide the current operational status of the business or organization identified by the legal and operating name above.
Operational
Not currently operational
Why is this business or organization not currently operational?
Seasonal operations
Ceased operations
Sold operations
Amalgamated with other businesses or organizations
Temporarily inactive but will re-open
No longer operating due to other reasons
When did this business or organization close for the season? Date
When does this business or organization expect to resume operations? Date
When did this business or organization cease operations? Date
Why did this business or organization cease operations?
Bankruptcy
Liquidation
Dissolution
Other
Specify the other reasons for ceased operations
When was this business or organization sold? Date
What is the legal name of the buyer?
When did this business or organization amalgamate? Date
What is the legal name of the resulting or continuing business or organization?
What are the legal names of the other amalgamated businesses or organizations?
When did this business or organization become temporarily inactive? Date
When does this business or organization expect to resume operations? Date
Why is this business or organization temporarily inactive?
When did this business or organization cease operations? Date
Why did this business or organization cease operations?
4. Please verify or provide the current main activity of the business or organization identified by the legal and operating name above.
Note: The described activity was assigned using the North American Industry Classification System (NAICS).
This question verifies the business or organization's current main activity as classified by the North American Industry Classification System (NAICS). The North American Industry Classification System (NAICS) is an industry classification system developed by the statistical agencies of Canada, Mexico and the United States. Created against the background of the North American Free Trade Agreement, it is designed to provide common definitions of the industrial structure of the three countries and a common statistical framework to facilitate the analysis of the three economies. NAICS is based on supply-side or production-oriented principles, to ensure that industrial data, classified to NAICS, are suitable for the analysis of production-related issues such as industrial performance.
The target entity for which NAICS is designed are businesses and other organizations engaged in the production of goods and services. They include farms, incorporated and unincorporated businesses and government business enterprises. They also include government institutions and agencies engaged in the production of marketed and non-marketed services, as well as organizations such as professional associations and unions and charitable or non-profit organizations and the employees of households.
The associated NAICS should reflect those activities conducted by the business or organizational units targeted by this questionnaire only, as identified in the 'Answering this questionnaire' section and which can be identified by the specified legal and operating name. The main activity is the activity which most defines the targeted business or organization's main purpose or reason for existence. For a business or organization that is for-profit, it is normally the activity that generates the majority of the revenue for the entity.
The NAICS classification contains a limited number of activity classifications; the associated classification might be applicable for this business or organization even if it is not exactly how you would describe this business or organization's main activity.
Please note that any modifications to the main activity through your response to this question might not necessarily be reflected prior to the transmitting of subsequent questionnaires and as a result they may not contain this updated information.
The following is the detailed description including any applicable examples or exclusions for the classification currently associated with this business or organization.
Description and examples
This is the current main activity.
This is not the current main activity.
Please provide a brief but precise description of this business or organization's main activity.
e.g., breakfast cereal manufacturing, shoe store, software development
Main activity
5. You indicated that is not the current main activity. Was this business or organization's main activity ever classified as: ?
Yes
No
When did the main activity change? Date
6. Please search and select the industry classification code that best corresponds to this business or organization's main activity.
Select this business or organization's activity sector (optional)
Farming or logging operation
Construction company or general contractor
Manufacturer
Wholesaler
Retailer
Provider of passenger or freight transportation
Provider of investment, savings or insurance products
Real estate agency, real estate brokerage or leasing company
Provider of professional, scientific or technical services
Provider of health care or social services
Restaurant, bar, hotel, motel or other lodging establishment
Other sector
7. You have indicated that the current main activity of this business or organization is: Main activity Are there any other activities that contribute significantly (at least 10%) to this business or organization's revenue?
Yes, there are other activities.
No, that is the only significant activity.
Please provide a brief but precise description of this business or organization's secondary activity.
e.g., breakfast cereal manufacturing, shoe store, software development
8. Approximately what percentage of this business or organization's revenue is generated by each of the following activities?
When precise figures are not available, please provide your best estimates.
Approximately what percentage of this business or organization's revenue is generated by each of the following activities? - table
Table summary
This table contains no data. It is an example of an empty data table used by respondents to provide data to Statistics Canada.
Percentage of revenue
Main activity
Secondary activity
All other activities
Total percentage
Reporting period information
1. What are the start and end dates of this business's or organization's most recently completed fiscal year?
Note: For the survey, the end date should fall between April 1, YYYY and March 31, YYYY+1 .
Here are twelve common fiscal periods that fall within the targeted dates:
May 1, YYYY-1 to April 30, YYYY
June 1, YYYY-1 to May 31, YYYY
July 1, YYYY-1 to June 30, YYYY
August 1, YYYY-1 to July 31, YYYY
September 1, YYYY-1 to August 31, YYYY
October 1, YYYY-1 to September 30, YYYY
November 1, YYYY-1 to October 31, YYYY
December 1, YYYY-1 to November 30, YYYY
January 1, YYYY to December 31, YYYY
February 1, YYYY to January 31, YYYY+1
March 1, YYYY to February 28, YYYY+1
April 1, YYYY to March 31, YYYY+1 .
Here are other examples of fiscal periods that fall within the required dates:
September 18, YYYY-1 to September 15, YYYY (e.g., floating year-end)
June 1, YYYY to December 31, YYYY (e.g., a newly opened business)
Fiscal Year Start date
Fiscal Year-End date
2. What is the reason the reporting period does not cover a full year?
Select all that apply.
Seasonal operations
New business
Change of ownership
Temporarily inactive
Change of fiscal year
Ceased operations
Other
Specify reason the reporting period does not cover a full year
Revenue
1. For the reporting period of YYYY-MM-DD to YYYY-MM-DD , what was this business's revenue from each of the following sources?
Notes:
a detailed breakdown may be requested in other sections
these questions are asked of many different industries. Some questions may not apply to this business
Please report all amounts in thousands of Canadian dollars.
Revenue
a. Sales of goods and services (e.g., fees, commissions, services revenue)
Report net of returns and allowances.
Sales of goods and services are defined as amounts derived from the sale of goods and services (cash or credit), falling within a business's ordinary activities. Sales should be reported net of trade discount, value added tax and other taxes based on sales.
Include:
sales from Canadian locations (domestic and export sales)
transfers to other business units or a head office of your firm.
Exclude:
transfers into inventory and consignment sales
federal, provincial and territorial sales taxes and excise duties and taxes
intercompany sales in consolidated financial statements.
b. Rental and leasing
Include: rental or leasing of apartments, commercial buildings, land, office space, residential housing, investments in co-tenancies and co-ownerships, hotel or motel rooms, long and short term vehicle leasing, machinery or equipment, storage lockers, etc.
c. Commissions
Include: commissions earned on the sale of products or services by businesses such as advertising agencies, brokers, insurance agents, lottery ticket sales, sales representatives and travel agencies - compensation could also be reported under this item (for example, compensation for collecting sales tax)
d. Subsidies (including grants, donations, fundraising and sponsorships)
Include:
non-repayable grants, contributions and subsidies from all levels of government
revenue from private sector (corporate and individual) sponsorships, donations and fundraising.
e. Royalties, rights, licensing and franchise fees
A royalty is defined as a payment received by the holder of a copyright, trademark or patent.
Include revenue received from the sale or use of all intellectual property rights of copyrighted materials such as musical, literary, artistic or dramatic works, sound recordings or the broadcasting of communication signals.
f. Dividends
Include:
dividend income
dividends from Canadian sources
dividends from foreign sources
patronage dividends.
Exclude equity income from investments in subsidiaries or affiliates.
g. Interest
Include:
investment revenue
interest from foreign sources
interest from Canadian bonds and debentures
interest from Canadian mortgage loans
interest from other Canadian sources.
Exclude equity income from investments in subsidiaries or affiliates.
h. Other revenue - please specify
Include amounts not included in questions a. to g.
Total revenue
The sum of sub-questions a. to h.
Other revenue - table
Table summary
This table contains no data. It is an example of an empty data table used by respondents to provide data to Statistics Canada.
CAN$ '000
Sales of goods and services
Rental and leasing
Commissions
Subsidies
Royalties, rights, licensing and franchise fees
Dividends
Interest
Other
Total revenue
1. In order to reduce future follow-up, please select one of the following options.
The reported value for total revenue $ ###### is significantly different than the $ ###### reported last reporting period.
I confirm that all values are correct.
I am unable to confirm that all values are correct.
The reported sales of goods and services entered $ ###### is significantly different than the $ ###### reported last reporting period.
I confirm that all values are correct.
I am unable to confirm that all values are correct.
E-Commerce
1. For the reporting period of YYYY-MM-DD to YYYY-MM-DD , what was this business's total revenue?
Include sales of goods and services; rental, leasing and property management; commissions; subsidies, grants, donations, fundraising and sponsorships; royalties; rights; licensing and franchise fees; dividends, interest and other revenue.
Please report all amounts in thousands of Canadian dollars.
Total revenue
2. For the reporting period of YYYY-MM-DD to YYYY-MM-DD , did this business have any e-commerce revenue?
E-commerce revenue: sales of goods and services conducted over the Internet with or without online payment.
Include all revenue for which an order is received and commitment to purchase is made via the Internet, although payment can be made by other means, such as orders made on web pages, an extranet, mobile devices or Electronic Data Interchange (EDI).
Exclude orders made by telephone, facsimile or e-mail.
Yes
No
3. Of the $ ###### in total revenue reported, what was the total e-commerce revenue?
If precise figures are not available, please provide your best estimate.
Total e-commerce revenue
4. For the reporting period of YYYY-MM-DD to YYYY-MM-DD , did this business make sales over the Internet through any of the following methods?
Select all that apply.
Mobile app
Include sales through any app, or application, that is downloaded and designed to run on a handheld device such as a smartphone or tablet (for example, places where a user may download these apps include Apple's App Store, Google Play or Blackberry App World).
Company website
Include sales through a browser-based website where your organization maintains control of the content.
Third-party website
Include sales through a browser-based website where a third-party maintains the structure of the website and control of the look and feel while your company only provides the product to be sold (for example, Amazon, Expedia, Etsy).
Electronic Data Interchange (EDI)
A standard format for exchanging business data. EDI is based on the use of message standards, ensuring that all participants use a common language.
Via a mobile app
Via your company website
Via a third-party website
Via Electronic Data Interchange (EDI)
Other
Specify the other methods
5. Does this business have any full-time staff dedicated solely to activities related to e-commerce?
Yes
No
6. Why did this business not make sales over the Internet?
Select all that apply.
Goods and services do not lend themselves to online sales
Prefer to maintain current business model
Lack of skilled workers to implement and maintain e-commerce infrastructure
Cost of development is too high
Security concerns
Other
Specify the other reasons
Expenses
1. For the reporting period of YYYY-MM-DD to YYYY-MM-DD , what were this business's expenses for the following items?
Notes:
a detailed breakdown may be requested in other sections
these questions are asked of many different industries. Some questions may not apply to this business
Please report all amounts in thousands of Canadian dollars.
Expenses
a. Cost of goods sold
Many business units distinguish their costs of materials from their other business expenses (selling, general and administrative). This item is included to allow you to easily record your costs/expenses according to your normal accounting practices.
Include:
cost of raw materials and/or goods purchased for resale - net of discounts earned on purchases
freight in and duty.
Exclude all costs associated with salaries, wages, benefits, commissions and subcontracts (report at Employment costs and expenses, and Subcontracts).
b. Employment costs and expenses
b1. Salaries, wages and commissions
Please report all salaries and wages (including taxable allowances and employment commissions as defined on the T4 - Statement of Remuneration Paid) before deductions for this reporting period.
Include:
vacation pay
bonuses (including profit sharing)
employee commissions
taxable allowances (e.g., room and board, vehicle allowances, gifts such as airline tickets for holidays)
severance pay.
Exclude all payments and expenses associated with casual labour and outside contract workers (report at Subcontracts).
b2. Employee benefits
Include contributions to:
health plans
insurance plans
employment insurance
pension plans
workers' compensation
association dues
contributions to any other employee benefits such as child care and supplementary unemployment benefit (SUB) plans
contributions to provincial and territorial health and education payroll taxes.
c. Subcontracts
Subcontract expense refers to the purchasing of services from outside of the company rather than providing them in-house.
Include:
hired casual labour and outside contract workers
custom work and contract work
subcontract and outside labour
hired labour.
d. Research and development fees
Expenses from activities conducted with the intention of making a discovery that could either lead to the development of new products or procedures, or to the improvement of existing products or procedures.
e. Professional and business fees
Include:
legal services
accounting and auditing fees
consulting fees
education and training fees
appraisal fees
management and administration fees
property management fees
information technology (IT) consulting and service fees (purchased)
architectural fees
engineering fees
scientific and technical service fees
other consulting fees (management, technical and scientific)
veterinary fees
fees for human health services
payroll preparation fees
all other professional and business service fees.
Exclude service fees paid to Head Office (report at All other costs and expenses).
f. Utilities
Utility expenses related to operating your business unit such as water, electricity, gas, heating and hydro.
Include:
diesel, fuel wood, natural gas, oil and propane
sewage.
Exclude:
energy expenses covered in your rental and leasing contracts
telephone, Internet and other telecommunications
vehicle fuel (report at All other costs and expenses).
g. Office and computer related expenses
Include:
office stationery and supplies, paper and other supplies for photocopiers, printers and fax machines
postage and courier (used in the day to day office business activity)
computer and peripherals upgrade expenses
data processing.
Exclude telephone, Internet and other telecommunication expenses (report at Telephone, Internet and other telecommunication).
h. Telephone, Internet and other telecommunication
Include:
internet
telephone and telecommunications
cellular telephone
fax machine
pager.
i. Business taxes, licenses and permits
Include:
property taxes paid directly and property transfer taxes
vehicle license fees
beverage taxes and business taxes
trade license fees
membership fees and professional license fees
provincial capital tax.
j. Royalties, franchise fees and memberships
Include:
amounts paid to holders of patents, copyrights, performing rights and trademarks
gross overriding royalty expenses and direct royalty costs
resident and non-resident royalty expenses
franchise fees.
Exclude Crown royalties
k. Crown charges
Federal or Provincial royalty, tax, lease or rental payments made in relation to the acquisition, development or ownership of Canadian resource properties.
Include:
Crown royalties
Crown leases and rentals
oil sand leases
stumpage fees.
l. Rental and leasing
Include:
lease rental expenses, real estate rental expenses, condominium fees and equipment rental expenses
motor vehicle rental and leasing expenses
studio lighting and scaffolding
machinery and equipment rental expenses
storage expenses
road and construction equipment rental
fuel and other utility costs covered in your rental and leasing contracts.
m. Repair and maintenance
Include:
buildings and structures
machinery and equipment
security equipment
vehicles
costs related to materials, parts and external labour associated with these expenses
janitorial and cleaning services and garbage removal.
n. Amortization and depreciation
Include:
direct cost depreciation of tangible assets and amortization of leasehold improvements
amortization of intangible assets (e.g., amortization of goodwill, patents, franchises, copyrights, trademarks, deferred charges, organizational costs).
o. Insurance
Insurance recovery income should be deducted from insurance expenses.
Include:
professional and other liability insurance
motor vehicle and property insurance
executive life insurance
bonding, business interruption insurance and fire insurance.
p. Advertising, marketing, promotion, meals and entertainment
Include:
newspaper advertising and media expenses
catalogues, presentations and displays
tickets for theatre, concerts and sporting events for business promotion
fundraising expenses
meals, entertainment and hospitality purchases for clients.
exploration and development (including prospect/geological, well abandonment & dry holes, exploration expenses, development expenses)
amounts not included in sub-questions a. to t. above.
Total expenses
The sum of sub-questions a. to u.
Total Expenses - Table
Table summary
This table contains no data. It is an example of an empty data table used by respondents to provide data to Statistics Canada.
CAN$ '000
Cost of goods sold
Opening inventories
Purchases
Closing inventories
Cost of goods sold
Employment costs and expenses
Salaries, wages and commissions
Employee benefits
Subcontracts
Research and development fees
Professional and business fees
Utilities
Office and computer related expenses
Telephone, Internet and other telecommunication
Business taxes, licenses and permits
Royalties, franchise fees and memberships
Crown charges
Rental and leasing
Repair and maintenance
Amortization and depreciation
Insurance
Advertising, marketing, promotion, meals and entertainment
Travel, meetings and conventions
Financial services
Interest expense
Other non-production-related costs and expenses
Other
Total expenses
1. In order to reduce future follow-up, please select one of the following options.
The value for total expenses $ ###### is significantly different than the $ ###### reported last reporting period.
I confirm that all values are correct.
I am unable to confirm that all values are correct.
I confirm that all values are correct.
I am unable to confirm that all values are correct.
I confirm that all values are correct.
I am unable to confirm that all values are correct.
Industry characteristics
1. What were this business's sales for each of the following goods and services?
Exclude royalties and license fees.
Report in thousands of Canadian dollars.
What were this business's sales for each of the following goods and services - table
Table summary
This table contains no data. It is an example of an empty data table used by respondents to provide data to Statistics Canada.
CAN$ '000
Motion picture film laboratory services
Editing services for audiovisual works
Transfer services
Colour correction and digital restoration services
Virtual Reality and augmented reality services
3D visual effects and animation services for audiovisual works
Visual effects and animation services for audiovisual works
Subtitling, titling and captioning services
DVD and Blu-ray authoring services
Format conversion services, digital encoding and conversion
Duplication and copying services, except large run, for audiovisual works, digital and video
Sound editing and design services for sound elements of audiovisual works
Total post-production sales
Contract production of audiovisual works
All other sales
Total sales of goods and services
In order to reduce future follow-up, please select one of the following options.
The total sales of $ ###### is significantly different than the $ ###### reported last reporting period.
I confirm that all values are correct.
I am unable to confirm that all values are correct.
Industry characteristics
2. Of the total sales of goods and services reported in question 1, provide a breakdown for the domestic and foreign total sales.
Exclude royalties and license fees.
Report in thousands of Canadian dollars.
Industry characteristics - table
Table summary
This table contains no data. It is an example of an empty data table used by respondents to provide data to Statistics Canada.
CAN$ '000
Total sales domestic
Total sales foreign
Total sales domestic and foreign
3. Of the total post-production sales reported in question 1, provide a breakdown of the total post-production sales by type of client (first point of sale).
Exclude royalties and license fees.
Report in thousands of Canadian dollars.
Of the total post-production sales reported in question 1, provide a breakdown of the total post-production sales by type of client (first point of sale) - table
Table summary
This table contains no data. It is an example of an empty data table used by respondents to provide data to Statistics Canada.
CAN$ '000
Advertising agencies and public relations firms
Production companies
Broadcasters
Distributors and wholesalers
All other post-production sales
Total post-production sales
Sales by type of client
1. What was this business's breakdown of sales by the following types of client?
Sales by type of client
This section is designed to measure which sector of the economy purchases your services.
Please provide a percentage breakdown of your sales by type of client.
Please ensure that the sum of percentages reported in this section equals 100%.
a. to c. Clients in Canada
a. Individuals and households
Please report the percentage of sales to individuals and households who do not represent the business or government sector.
b. Businesses
Percentage of sales sold to the business sector should be reported here.
Include sales to Crown corporations.
c. Governments, not-for-profit organizations and public institutions (e.g., hospitals, schools)
Percentage of sales to federal, provincial, territorial and municipal governments should be reported here.
Include: sales to hospitals, schools, universities and public utilities.
d. Clients outside Canada
Please report the percentage of total sales to customers or clients located outside Canada including foreign businesses, foreign individuals, foreign institutions and/or governments.
Include sales to foreign subsidiaries and affiliates.
Clients outside Canada - table
Table summary
This table contains no data. It is an example of an empty data table used by respondents to provide data to Statistics Canada.
Percentage
Clients in Canada — individuals and households
Clients in Canada — businesses
Clients in Canada — governments, not-for-profit organizations and public institutions
Clients outside of Canada
Total percentage
Sales by consumer location
1. What was the percentage breakdown of this business's sales by consumer location?
Consumer location is the location where the goods or services will ultimately be used.
If ultimate consumer location is not known, the following are acceptable substitutes:
shipping destination
client's billing address
location of this business's retail customers
location of this business's warehouses/distribution centres.
What was the percentage breakdown of this business's sales by consumer location? - table
Table summary
This table contains no data. It is an example of an empty data table used by respondents to provide data to Statistics Canada.
Percentage
Newfoundland and Labrador
Prince Edward Island
Nova Scotia
New Brunswick
Quebec
Ontario
Manitoba
Saskatchewan
Alberta
British Columbia
Yukon
Northwest Territories
Nunavut
United States
All other countries
Total percentage
Sales by consumer location
International transactions - Revenue received from exports
1. During the reporting period of YYYY-MM-DD to YYYY-MM-DD , did this business receive revenue from clients outside Canada for the sale of products, services, royalties, rights, licensing or franchise fees?
International transactions
This section is intended to measure the value of international transactions on goods, services, royalties and licenses fees. It covers imported services and goods purchased outside Canada as well as the value of exported services and goods to clients/customers outside Canada. Please report also royalties, rights, licensing and franchise fees paid to and/or received from outside Canada. Services cover a variety of industrial, professional, trade and business services.
Yes
No
2. What was the revenue received from clients outside Canada?
International transactions
This section is intended to measure the value of international transactions on goods, services, royalties and licenses fees. It covers imported services and goods purchased outside Canada as well as the value of exported services and goods to clients/customers outside Canada. Please report also royalties, rights, licensing and franchise fees paid to and/or received from outside Canada. Services cover a variety of industrial, professional, trade and business services.
Revenue received ( CAN$ '000 )
3. What was the percentage breakdown of revenue received from clients outside Canada by goods, services and royalties?
International transactions
This section is intended to measure the value of international transactions on goods, services, royalties and licenses fees. It covers imported services and goods purchased outside Canada as well as the value of exported services and goods to clients/customers outside Canada. Please report also royalties, rights, licensing and franchise fees paid to and/or received from outside Canada. Services cover a variety of industrial, professional, trade and business services.
International transactions - table
Table summary
This table contains no data. It is an example of an empty data table used by respondents to provide data to Statistics Canada.
Percentage
Goods
Services
Royalties, rights, licensing and franchise fees
Total percentage
4. What was the percentage breakdown of revenue received from clients outside Canada by country?
International transactions
This section is intended to measure the value of international transactions on goods, services, royalties and licenses fees. It covers imported services and goods purchased outside Canada as well as the value of exported services and goods to clients/customers outside Canada. Please report also royalties, rights, licensing and franchise fees paid to and/or received from outside Canada. Services cover a variety of industrial, professional, trade and business services.
International transactions - table
Table summary
This table contains no data. It is an example of an empty data table used by respondents to provide data to Statistics Canada.
Percentage
United States
Mexico
Provide the percentage of revenue received from any other countries - top 4 clients only
Other 1 - specify
Other 2 - specify
Other 3 - specify
Other 4 - specify
Total percentage
List of countries
Aruba
Afghanistan
Angola
Anguilla
Åland Islands
Albania
Andorra
United Arab Emirates
Argentina
Armenia
American Samoa
Antarctica
French Southern Territories
Antigua and Barbuda
Australia
Austria
Azerbaijan
Burundi
Belgium
Benin
Bonaire, Saint Eustatius and Saba
Burkina Faso
Bangladesh
Bulgaria
Bahrain
Bahamas
Bosnia and Herzegovina
Saint Barthélemy
Belarus
Belize
Bermuda
Bolivia
Brazil
Barbados
Brunei Darussalam
Bhutan
Bouvet Island
Botswana
Central African Republic
Cocos (Keeling) Islands
Switzerland
Chile
China
Côte d'Ivoire
Cameroon
Congo, The Democratic Republic of the
Congo, Republic of the
Cook Islands
Colombia
Comoros
Cape Verde
Costa Rica
Cuba
Curaçao
Christmas Island
Cayman Islands
Cyprus
Czech Republic
Germany
Djibouti
Dominica
Denmark
Dominican Republic
Algeria
Ecuador
Egypt
Eritrea
Western Sahara
Spain
Estonia
Ethiopia
Finland
Fiji
Falkland Islands (Malvinas)
France
Faroe Islands
Micronesia, Federated States of
Gabon
United Kingdom
Georgia
Guernsey
Ghana
Gibraltar
Guinea
Guadeloupe
Gambia
Guinea-Bissau
Equatorial Guinea
Greece
Grenada
Greenland
Guatemala
French Guiana
Guam
Guyana
Hong Kong Special Administrative Region
Heard Island and McDonald Islands
Honduras
Croatia
Haiti
Hungary
Indonesia
Isle of Man
India
British Indian Ocean Territory
Ireland, Republic of
Iran
Iraq
Iceland
Israel
Italy
Jamaica
Jersey
Jordan
Japan
Kazakhstan
Kenya
Kyrgyzstan
Cambodia
Kiribati
Saint Kitts and Nevis
Korea, South
Kuwait
Laos
Lebanon
Liberia
Libya
Saint Lucia
Liechtenstein
Sri Lanka
Lesotho
Lithuania
Luxembourg
Latvia
Macao Special Administrative Region
Saint Martin (French part)
Morocco
Monaco
Moldova
Madagascar
Maldives
Marshall Islands
Macedonia, Republic of
Mali
Malta
Burma (Myanmar)
Montenegro
Mongolia
Northern Mariana Islands
Mozambique
Mauritania
Montserrat
Martinique
Mauritius
Malawi
Malaysia
Mayotte
Namibia
New Caledonia
Niger
Norfolk Island
Nigeria
Nicaragua
Niue
Netherlands
Norway
Nepal
Nauru
New Zealand
Oman
Pakistan
Panama
Pitcairn
Peru
Philippines
Palau
Papua New Guinea
Poland
Puerto Rico
Korea, North
Portugal
Paraguay
West Bank and Gaza Strip (Palestine)
French Polynesia
Qatar
Réunion
Romania
Russian Federation
Rwanda
Saudi Arabia
Sudan
Senegal
Singapore
South Georgia and the South Sandwich Islands
Saint Helena
Svalbard and Jan Mayen
Solomon Islands
Sierra Leone
El Salvador
San Marino
Somalia
Saint Pierre and Miquelon
Serbia
Sao Tome and Principe
Suriname
Slovakia
Slovenia
Sweden
Swaziland
Sint Maarten (Dutch part)
Seychelles
Syria
Turks and Caicos Islands
Chad
Togo
Thailand
Tajikistan
Tokelau
Turkmenistan
Timor-Leste
Tonga
Trinidad and Tobago
Tunisia
Turkey
Tuvalu
Taiwan
Tanzania
Uganda
Ukraine
United States Minor Outlying Islands
Uruguay
Uzbekistan
Holy See (Vatican City State)
Saint Vincent and the Grenadines
Venezuela
Virgin Islands, British
Virgin Islands, United States
Viet Nam
Vanuatu
Wallis and Futuna
Samoa
Kosovo
Yemen
South Africa, Republic of
Zambia
Zimbabwe
International transactions - Purchases from outside Canada (Imports)
5. During the reporting period of YYYY-MM-DD to YYYY-MM-DD , did this business make payments to suppliers outside Canada for the purchase of products, services, royalties, rights, licensing or franchise fees?
International transactions
This section is intended to measure the value of international transactions on goods, services, royalties and licenses fees. It covers imported services and goods purchased outside Canada as well as the value of exported services and goods to clients/customers outside Canada. Please report also royalties, rights, licensing and franchise fees paid to and/or received from outside Canada. Services cover a variety of industrial, professional, trade and business services.
Yes
No
6. What were the payments made to suppliers outside Canada?
International transactions
This section is intended to measure the value of international transactions on goods, services, royalties and licenses fees. It covers imported services and goods purchased outside Canada as well as the value of exported services and goods to clients/customers outside Canada. Please report also royalties, rights, licensing and franchise fees paid to and/or received from outside Canada. Services cover a variety of industrial, professional, trade and business services.
Payments made ( CAN$ '000 )
7. What was the percentage breakdown of payments made to suppliers outside Canada by goods, services and royalties?
International transactions
This section is intended to measure the value of international transactions on goods, services, royalties and licenses fees. It covers imported services and goods purchased outside Canada as well as the value of exported services and goods to clients/customers outside Canada. Please report also royalties, rights, licensing and franchise fees paid to and/or received from outside Canada. Services cover a variety of industrial, professional, trade and business services.
International transactions - table
Table summary
This table contains no data. It is an example of an empty data table used by respondents to provide data to Statistics Canada.
Percentage
Goods
Services
Royalties, rights, licensing and franchise fees
Total percentage
8. What was the percentage breakdown of payments made to suppliers outside Canada by country?
International transactions
This section is intended to measure the value of international transactions on goods, services, royalties and licenses fees. It covers imported services and goods purchased outside Canada as well as the value of exported services and goods to clients/customers outside Canada. Please report also royalties, rights, licensing and franchise fees paid to and/or received from outside Canada. Services cover a variety of industrial, professional, trade and business services.
International transactions - table
Table summary
This table contains no data. It is an example of an empty data table used by respondents to provide data to Statistics Canada.
Percentage
United States
Mexico
Provide the percentage of payments made to any other countries - top 4 clients only
Other 1 - specify
Other 2 - specify
Other 3 - specify
Other 4 - specify
Total percentage
List of countries
Aruba
Afghanistan
Angola
Anguilla
Åland Islands
Albania
Andorra
United Arab Emirates
Argentina
Armenia
American Samoa
Antarctica
French Southern Territories
Antigua and Barbuda
Australia
Austria
Azerbaijan
Burundi
Belgium
Benin
Bonaire, Saint Eustatius and Saba
Burkina Faso
Bangladesh
Bulgaria
Bahrain
Bahamas
Bosnia and Herzegovina
Saint Barthélemy
Belarus
Belize
Bermuda
Bolivia
Brazil
Barbados
Brunei Darussalam
Bhutan
Bouvet Island
Botswana
Central African Republic
Cocos (Keeling) Islands
Switzerland
Chile
China
Côte d'Ivoire
Cameroon
Congo, The Democratic Republic of the
Congo, Republic of the
Cook Islands
Colombia
Comoros
Cape Verde
Costa Rica
Cuba
Curaçao
Christmas Island
Cayman Islands
Cyprus
Czech Republic
Germany
Djibouti
Dominica
Denmark
Dominican Republic
Algeria
Ecuador
Egypt
Eritrea
Western Sahara
Spain
Estonia
Ethiopia
Finland
Fiji
Falkland Islands (Malvinas)
France
Faroe Islands
Micronesia, Federated States of
Gabon
United Kingdom
Georgia
Guernsey
Ghana
Gibraltar
Guinea
Guadeloupe
Gambia
Guinea-Bissau
Equatorial Guinea
Greece
Grenada
Greenland
Guatemala
French Guiana
Guam
Guyana
Hong Kong Special Administrative Region
Heard Island and McDonald Islands
Honduras
Croatia
Haiti
Hungary
Indonesia
Isle of Man
India
British Indian Ocean Territory
Ireland, Republic of
Iran
Iraq
Iceland
Israel
Italy
Jamaica
Jersey
Jordan
Japan
Kazakhstan
Kenya
Kyrgyzstan
Cambodia
Kiribati
Saint Kitts and Nevis
Korea, South
Kuwait
Laos
Lebanon
Liberia
Libya
Saint Lucia
Liechtenstein
Sri Lanka
Lesotho
Lithuania
Luxembourg
Latvia
Macao Special Administrative Region
Saint Martin (French part)
Morocco
Monaco
Moldova
Madagascar
Maldives
Marshall Islands
Macedonia, Republic of
Mali
Malta
Burma (Myanmar)
Montenegro
Mongolia
Northern Mariana Islands
Mozambique
Mauritania
Montserrat
Martinique
Mauritius
Malawi
Malaysia
Mayotte
Namibia
New Caledonia
Niger
Norfolk Island
Nigeria
Nicaragua
Niue
Netherlands
Norway
Nepal
Nauru
New Zealand
Oman
Pakistan
Panama
Pitcairn
Peru
Philippines
Palau
Papua New Guinea
Poland
Puerto Rico
Korea, North
Portugal
Paraguay
West Bank and Gaza Strip (Palestine)
French Polynesia
Qatar
Réunion
Romania
Russian Federation
Rwanda
Saudi Arabia
Sudan
Senegal
Singapore
South Georgia and the South Sandwich Islands
Saint Helena
Svalbard and Jan Mayen
Solomon Islands
Sierra Leone
El Salvador
San Marino
Somalia
Saint Pierre and Miquelon
Serbia
Sao Tome and Principe
Suriname
Slovakia
Slovenia
Sweden
Swaziland
Sint Maarten (Dutch part)
Seychelles
Syria
Turks and Caicos Islands
Chad
Togo
Thailand
Tajikistan
Tokelau
Turkmenistan
Timor-Leste
Tonga
Trinidad and Tobago
Tunisia
Turkey
Tuvalu
Taiwan
Tanzania
Uganda
Ukraine
United States Minor Outlying Islands
Uruguay
Uzbekistan
Holy See (Vatican City State)
Saint Vincent and the Grenadines
Venezuela
Virgin Islands, British
Virgin Islands, United States
Viet Nam
Vanuatu
Wallis and Futuna
Samoa
Kosovo
Yemen
South Africa, Republic of
Zambia
Zimbabwe
Changes or events
1. Indicate any changes or events that affected the reported values for this business or organization, compared with the last reporting period.
Select all that apply.
Strike or lock-out
Exchange rate impact
Price changes in goods or services sold
Contracting out
Organisational change
Price changes in labour or raw materials
Natural disaster
Recession
Change in product line
Sold business units
Expansion
New or lost contract
Plant closures
Acquisition of business units
Other
Specify the other changes or events
No changes or events
Contact person
1. Statistics Canada may need to contact the person who completed this questionnaire for further information.
Is Provided Given Names Provided Family Name the best person to contact?
Yes
No
Who is the best person to contact about this questionnaire?
First name
Last name
Title
Email address
Telephone number (including area code)
Extension number (if applicable) The maximum number of characters is 5.
Fax number (including area code)
Feedback
1. How long did it take to complete this questionnaire?
Include the time spent gathering the necessary information.
Hours
Minutes
2. We invite your comments about this questionnaire.