Health Data Webinar Series - Session #5: An Overview of the Canadian Community Health Survey

The Health Statistics Program at Statistics Canada is pleased to continue its webinar series tailored for health data users. These 1-hour sessions held every 2–3 months, will be customized based on your feedback to reflect your needs and interests.

Webinar details

Date: October 28, 2026
French session: 11:00 a.m. (EDT)
English session: 1:00 p.m. (EDT)

Registration

Complete the registration form to secure your spot.

What you'll learn

  • Through the overview of the Canadian Community Health Survey (CCHS), there will be a focus on:
    • What are the population health indicators covered by the survey
    • Who does the survey cover and what populations can be analyzed with the data
    • How CCHS data can be linked to administrative health information
  • Also discover where to go to find the most recent data and how to tailor it to your needs

Presenters

  • Shawn Brule, Unit Head, Centre for Population Health Data
  • Sarah Wickert, Analyst, Centre for Population Health Data

Who should attend

Researchers, analysts, policymakers, and health professionals interested in leveraging Statistics Canada's health data for research and decision-making.

Contact us

For questions, contact statcan.hspoutreach-sensibilisationpss.statcan@statcan.gc.ca
 

Wholesale Trade Survey (monthly): CVs for total sales by geography - August 2026

Wholesale Trade Survey (monthly): CVs for total sales by geography - August 2026

Geography

Month

202508

202509

202510

202511

202512

202601

202602

202603

202604

202605

202606

202607

202608

percentage

Canada

0.4

0.5

0.5

0.5

0.5

0.5

0.5

0.4

0.4

0.4

0.4

0.5

0.5

Newfoundland and Labrador

0.3

0.3

0.7

0.3

0.4

1.1

0.3

0.4

0.7

0.8

1.3

1.1

0.6

Prince Edward Island

0.0

0.0

0.0

0.0

0.0

0.0

0.0

0.0

0.0

0.0

0.0

0.0

0.0

Nova Scotia

1.6

1.2

1.1

4.8

1.4

1.6

2.2

1.9

2.8

3.1

4.8

2.2

2.1

New Brunswick

1.0

0.7

0.7

1.4

0.5

0.8

0.5

0.9

1.8

0.7

0.7

0.8

1.2

Quebec

1.3

2.0

1.7

1.9

2.0

1.8

2.2

1.4

1.8

1.3

1.4

1.7

1.4

Ontario

0.8

0.9

1.0

0.9

0.9

1.0

1.0

0.9

0.9

0.9

0.8

1.0

1.0

Manitoba

1.1

0.4

0.3

0.8

0.4

0.6

0.4

0.5

0.5

0.7

0.7

0.6

0.4

Saskatchewan

0.6

1.0

0.3

0.2

0.5

0.6

0.2

0.4

0.7

0.4

0.2

0.4

0.3

Alberta

0.5

0.5

0.5

0.4

0.7

0.6

0.4

0.3

0.2

0.3

0.4

0.5

0.2

British Columbia

1.6

1.8

2.7

1.8

1.4

1.7

1.5

1.1

1.1

0.8

1.1

2.0

1.6

Yukon Territory

0.0

0.0

0.0

0.0

0.0

0.0

0.0

0.0

0.0

0.0

0.0

0.0

0.0

Northwest Territories

0.0

0.0

0.0

0.0

0.0

0.0

0.0

0.0

0.0

0.0

0.0

0.0

0.0

Nunavut

0.0

0.0

0.0

0.0

0.0

0.0

0.0

0.0

0.0

0.0

0.0

0.0

0.0

National Level CVs by Characteristic - August 2026

National Level CVs by Characteristic, August 2026
Table summary
This table displays the results of Monthly Survey of Manufacturing: National Level CVs by Characteristic. The information is grouped by Month (appearing as row headers), and Sales of goods manufactured, Raw materials and components inventories, Goods / work in process inventories, Finished goods manufactured inventories and Unfilled Orders, calculated in percentage (appearing as column headers).

Month

Sales of goods manufactured

Raw materials and components inventories

Goods / work in process inventories

Finished goods manufactured inventories

Unfilled Orders

%

August 2025

0.77

1.24

1.87

1.38

1.43

September 2025

0.78

1.25

1.83

1.42

1.29

October 2025

0.74

1.23

1.81

1.46

1.38

November 2025

0.70

1.27

1.88

1.43

1.52

December 2025

0.68

1.26

1.94

1.52

1.41

January 2026

0.75

1.20

1.89

1.47

1.37

February 2026

0.76

1.25

2.10

1.53

1.42

March 2026

0.73

1.23

2.04

1.44

1.43

April 2026

0.74

1.23

2.00

1.42

1.48

May 2026

0.79

1.25

2.01

1.43

1.33

June 2026

0.78

1.18

1.94

1.44

1.29

July 2026

0.79

1.21

1.90

1.44

1.32

August 2026

0.80

1.26

1.96

1.43

1.36

Retail Commodity Survey: CVs for Total Sales (July 2026)

Retail Commodity Survey: CVs for Total Sales (July 2026)
Table summary
This table displays the results of Retail Commodity Survey: CVs for Total Sales (June 2026). The information is grouped by NAPCS-CANADA (appearing as row headers), and Month (appearing as column headers).

NAPCS-CANADA

Month

202606

202607

Total commodities, retail trade commissions and miscellaneous services

0.63

0.60

Retail Services (except commissions) [561]

0.63

0.61

Food and beverages at retail [56111]

1.65

1.54

Cannabis products, at retail [56113]

0.00

0.00

Clothing at retail [56121]

0.70

1.05

Jewellery and watches, luggage and briefcases, at retail [56123]

3.63

3.31

Footwear at retail [56124]

1.11

1.07

Home furniture, furnishings, housewares, appliances and electronics, at retail [56131]

0.83

0.71

Sporting and leisure products (except publications, audio and video recordings, and game software), at retail [56141]

2.52

2.69

Publications at retail [56142]

8.32

9.86

Audio and video recordings, and game software, at retail [56143]

4.22

9.28

Motor vehicles at retail [56151]

1.58

1.50

Recreational vehicles at retail [56152]

4.10

3.85

Motor vehicle parts, accessories and supplies, at retail [56153]

1.47

1.52

Automotive and household fuels, at retail [56161]

1.35

1.26

Home health products at retail [56171]

2.59

2.60

Infant care, personal and beauty products, at retail [56172]

3.59

3.00

Hardware, tools, renovation and lawn and garden products, at retail [56181]

1.96

1.94

Miscellaneous products at retail [56191]

3.48

3.27

Retail trade commissions [562]

1.58

1.58

Retail Commodity Survey: CVs for Total Sales (Second Quarter 2026)

Retail Commodity Survey: CVs for Total Sales (Second Quarter 2026)
Table summary
This table displays the results of Retail Commodity Survey: CVs for Total Sales (Second Quarter 2026). The information is grouped by NAPCS-CANADA (appearing as row headers), and Quarter (appearing as column headers).

NAPCS-CANADA

Quarter

2026Q2

Total commodities, retail trade commissions and miscellaneous services

0.47

Retail Services (except commissions) [561]

0.47

Food and beverages at retail [56111]

0.65

Cannabis products, at retail [56113]

0.00

Clothing at retail [56121]

0.66

Jewellery and watches, luggage and briefcases, at retail [56123]

2.86

Footwear at retail [56124]

1.01

Home furniture, furnishings, housewares, appliances and electronics, at retail [56131]

0.77

Sporting and leisure products (except publications, audio and video recordings, and game software), at retail [56141]

2.47

Publications at retail [56142]

7.66

Audio and video recordings, and game software, at retail [56143]

5.67

Motor vehicles at retail [56151]

1.30

Recreational vehicles at retail [56152]

2.67

Motor vehicle parts, accessories and supplies, at retail [56153]

1.23

Automotive and household fuels, at retail [56161]

1.27

Home health products at retail [56171]

2.67

Infant care, personal and beauty products, at retail [56172]

3.81

Hardware, tools, renovation and lawn and garden products, at retail [56181]

1.77

Miscellaneous products at retail [56191]

3.30

Retail trade commissions [562]

1.43

Post-production and other motion picture and video industries: CVs for operating revenue - 2025

Post-production and other motion picture and video industries: CVs for operating revenue - 2025
Table summary
This table displays the results of CVs for operating revenue - Post-production and other motion picture and video industries. The information is grouped by Regions (appearing as row headers), CVs for operating revenue, calculated using percent units of measure (appearing as column headers).

Geography

CVs for operating revenue

percent

Canada

0.02

Newfoundland and Labrador

0.00

Prince Edward Island

0.00

Nova Scotia

0.10

New Brunswick

0.11

Quebec

0.01

Ontario

0.06

Manitoba

0.00

Saskatchewan

0.00

Alberta

0.08

British Columbia

0.03

Territories

0.00

Modelling March and July Ending Stocks Using Survey and Administrative Data

1. Introduction

This report provides the background, general methods and results of the model used to produce estimates for on-stocks of principal field crops in March and July. The work was completed by the Agriculture Division and the Economic Statistics Methods Division at Statistics Canada.

The general methodology for the model – which lists the targeted crop-province combinations - is outlined in Section 2. In Section 3, the data sources used to build the predictor set are listed. Section 4 contains the modelling methods and evaluation metrics used, while the fifth section outlines the results.

2. General methodology for ending stock modelling

A methodology for modelling on-farm stocks of principal field crops was developed and tested on the crop-province combinations that are typically published from the Field Crop Reporting Series, as shown in Table 1. These crop-province combinations account for nearly the entirety of field crops stored on Canadian farms.

Table 1. On-farm stocks of principal field crops typically published in the results of the March and July Farm Surveys, by province

Crop type

Province

Quebec

Ontario

Manitoba

Saskatchewan

Alberta

Barley

Yes

Yes

Yes

Yes

Yes

Canola

Yes

Yes

Yes

Yes

Yes

Corn for grain

Yes

Yes

Yes

No

Yes

Oats

Yes

Yes

Yes

Yes

Yes

Rye

Yes

Yes

Yes

Yes

Yes

Dry peas

No

No

Yes

Yes

Yes

Flaxseed

No

No

Yes

Yes

Yes

Lentils

No

No

Yes

Yes

Yes

Soybeans

Yes

Yes

Yes

Yes

No

Wheat, durum

No

No

No

Yes

Yes

Wheat, all excluding durum wheat

Yes

Yes

Yes

Yes

Yes

Canary seedFootnote 1

No

No

No

No

No

ChickpeasFootnote 1

No

No

No

No

No

Mustard seedFootnote 1

No

No

No

No

No

Sunflower seedFootnote 1

No

No

No

No

No

Footnote 1

available only at a national level

Return to the first footnote 1 referrer

Note: On-farm stocks were modelled in the Maritimes and/or British Columbia for select crops (oats, canola, soybeans, corn, barley, dry peas, and wheat) when data was available.

The goal of the model is to produce official and accurate estimates of March and July ending on-farm stocks for select crop-province combinations using information from existing data sources. The quality of model estimates will be discussed further in sub-section 4.3 and Section 6.

3. Data sources used in the model

The modelling methodology used three data sources: 1) Statistics Canada's Field Crop Reporting Series data, 2) Statistics Canada's Farm Product Price Index and 3) alternative data from the Canadian Grain Commission.

3.1 Crop Reporting Series data

Statistics Canada's Field Crop Reporting Series obtains information on the Canadian grain industry (for details regarding the methodology of the Field Crop Reporting Series, please visit Field Crop Reporting Series). The surveys collecting on-farm stocks have historically been run each year in March (cancelled in 2023), July (June, starting in 2020 onward), September (cancelled in 2016), November, and December. As the crop year progresses, different aspects of the grain industry are collected. Some of these measures were used directly (e.g., seeding intentions, on-farm ending stocks, the production of field crops), and some of them were used to derive new predictors (e.g., the percentage of supplies which were produced, the percentage of disposition which was delivered).

3.2 Farm Product Price Index data

The Farm Product Price Index publishes estimates on the price of many different agricultural products, including nearly every grain and field crop for which ending stocks are published. Prices are published on a monthly basis for each province. Since the analysis spans more than 15 years, inflation would obfuscate the relationship between price and ending stocks. Therefore, price in its raw form was not a suitable predictor. Raw monthly provincial prices for each grain and field crops were transformed into two predictors (year over year percentage difference, quarter over year percentage difference) which better suited the model.

3.3 Alternative data from the Canadian Grain Commission

The Canadian Grain Commission (CGC) collects data concerning many aspects of the grain industry in Canada. Among these are field crops deliveries from farms to elevators. Deliveries are disseminated each week as part of the CGC's Grain Stats Weekly program at the provincial level.

Given the release frequency of CGC data, five predictors were derived: total deliveries and total feed deliveries during both the December-March and March-July Field Crop Reporting Series survey periods, alongside cumulative feed deliveries since the start of the crop year.

3.4 Larger predictor pool in July relative to March

Because July model inputs exhibit higher variability than those in March, the July model requires additional predictors to achieve strong predictive power. Testing confirmed that these extra predictors did not improve the March model's performance; therefore, they were excluded from the March model to avoid unnecessary complexity. These different predictor pools were found to produce the optimal results for each model.

While the March model uses the percentage of leftover supply (ending stocks plus feed, waste, and dockage) that was ending stocks during the previous survey period, the July model uses that value for the previous three survey periods.

The models also differ in their feed delivery predictors. Both models include total feed deliveries since the previous survey period. The July model expands on this by incorporating the proportion of deliveries that are feed deliveries over that same time frame as well as two lagged predictors: total feed deliveries and the proportion of deliveries that are feed deliveries from two survey periods prior. In contrast, the March model includes total feed deliveries and the proportion of deliveries that are feed deliveries since the beginning of the crop year.

4. Modelling March and July ending stocks

4.1 Modelling methods

The model is constructed using the historical relationships between the published estimate of on-farm stocks of grain and various characteristics of the crops and grain industries. Data from 2006 onward are used in deriving the model.

The on-farm stocks of grains are estimated using the statistical programming language R. Two learning algorithms are employed: Elastic Net from the glmnet package for feature selection and robust regression from the MASS package for prediction.

The Elastic Net procedure selected optimal model parameters using leave-one-out cross-validation to balance model fit and predictive performance. Predictors which haven't been shrunk to zero from the Elastic Net are passed into the robust regression. The robust regression uses the MM-estimator.

4.2 Defining the Target

The highest quality estimate of on-farm stocks of grains is the published estimate. Historically, the published estimate was derived from the Field Crop Reporting Series survey estimate which had been adjusted using the Supply and Disposition equation and alternative data sources as reference. This process is outlined in greater detail here: Supply and Disposition of Grains in Canada.

The supply and disposition equation is:

DISPOSITION = DELIVERIES + SEED + ENDING STOCK + FEED, WASTE, DOCKAGE

and

SUPPLY = BEGINNING STOCKS + PRODUCTION

where

SUPPLY = DISPOSITION

DELIVERIES  estimates are taken from administrative data from the CGC.

PRODUCTION  estimates are taken from the November Field Crop Survey for the March and July models.

BEGINNING STOCKS  are taken as the ending stocks of the December Field Crop Survey and the March Field Crop Survey for the March and July models, respectively.

ENDING STOCKS  estimates had been derived from the March Field Crop Survey and the July Field Crop Survey for the March and July models, respectively.

SEED USE  estimates are derived from the November Field Crop Survey and the March Field Crop Survey, for the March and July models, respectively.

FEED , WASTE and DOCKAGE  estimates are the residual of the equation outlined above.

When it comes time to estimate on-farm stocks of grain, the estimates for all variables but feed, waste and dockage are available. Therefore, the equation can be re-written as:

DISPOSITION - DELIVERIES - SEED = ENDING STOCK + FEED,WASTE,DOCKAGE

or

LEFTOVER = ENDING STOCK + FEED,WASTE,DOCKAGE

The model is ultimately built to replace the March and July on-farm ending stocks estimates, however, given the leftover amount is known, it is used to stabilize the target. The model target is the percentage of leftover which are ending stocks.

Like the survey estimate, the modelled estimate is subject to adjustments using the Supply and Disposition equation and alternative data sources as reference.

4.3 Model evaluation methods

During the research phase of this project, many model parameters were considered. This included the learning algorithms used for prediction, the size of the predictor pool, and the shape of the target.

Evaluating the success of the model was done by measuring the accuracy and bias of different parameter selections by comparing the predictions to the published March and July ending on-farm stock estimates at both the crop and province-crop levels. In both cases, the weighted mean absolute percent error (wMAPE) was used as the accuracy metric and the relative mean error (ME) as the bias metric. Assessing both metrics ensures predictions are not only close to the actual values on average, but also free from systematic directional errors that could distort estimates.

The formula for the weighted mean absolute percent error is below:

wMAPE = ∑ i = 1 n | published i - prediction i | ∑ i = 1 n published i

The formula for the relative mean error is below:

Relative ME = ∑ i = 1 n published i - prediction i ∑ i = 1 n published i

where  prediction is the model prediction,  published is the published estimate,  i is a given observation and  n is the total number of observations in a crop or province-crop group.

5. Results

Overall, the model compares favourably to the results of the March and July surveys.

For the March period, in all but two crops – barley and corn – the model outperforms the survey. The survey only minimally outperforms the model in barley and corn. Further analysis for barley was conducted (feed deliveries published by the CGC were explored, subject matter experts were consulted), but nothing adequately explained the discrepancy.

For the July period, in all crops the model outperforms the survey. The improvements are even more significant than those in the March period. The bias distribution across all crops sees a drastic improvement in March and July, becoming more tightly clustered and centered around zero.

6. Data Quality Indicators

6.1 Confidence Interval (CI)

All predictive models are subject to errors; therefore, it is important to measure the degree of uncertainty in model estimates. This is done with the use of the confidence interval.

The following is a concise guide to the bootstrap estimation of variance for the March and July ending stocks models. The main goal of this estimate is to capture the variance of the entire modelling process. Consequently, the key element of the bootstrap – sampling with replacement – occurs at the beginning of the modelling process.

Step 1: Stratified Random Sampling with Replacement

The training set, which contains all the observations the original model is built from, is stratified by province and then randomly sampled with replacement at the observation level. If there were 10 observations initially, then the new bootstrap set will also have 10 observations, but there may be recurrences of the same observation due to the stratified random sampling with replacement.

Step 2: Elastic Net Regression to find Optimal Penalty Size

An Elastic Net regression is cross-validated (at 4 folds, trying 100 different penalty sizes) on the bootstrap modelling set to find the optimal penalty size. This optimal penalty size is then used in the next step.

Step 3: Elastic Net Regression to Create Reduced Pool of Predictors

The Elastic Net is retrained, using the optimal penalty size derived in Step 2. The resulting optimal model may shrink some predictor coefficients to zero. In this case, the predictors would be removed from the initial pool of predictors, creating a reduced pool of predictors.

Step 4: Robust Regression with Reduced Pool of Predictors

The bootstrap modelling set is cut down to the reduced pool of predictors and then fitted with a robust regression. This robust regression is the model which provides the final estimate.

Step 5: Prediction is Made using the Robust Regression Model

The trained robust regression is applied to the prediction set.

Step 6: Repeat Steps 1-5 1000 times

Steps 1-5 are repeated 1000 times, with each new stratified random sample providing a different mutation of the initial modelling set.

Step 7: Calculate CI using Percentile Method

After the 1000 predictions have been saved, the final output is created like this:

  • Order the 1000 replicates
  • Save values of 2.5 and 97.5 percentiles (25th and 975th largest replicates).

Step 8: Repeat Steps 1-7 for each crop

All previous steps must be repeated for each crop.

We can build a confidence interval using the 1000 bootstrap replication. We use the percentile method again and remove the bottom 25 and top 25 bootstrap replicates, which gives us the 95% confidence interval.

These intervals can be used by Subject Matter in their validation process and during the Supply and Disposition process.

6.2 Robust Coefficient of Variation (CV)

Consistent with our confidence interval approach, we use a robust measure of variability to reduce the influence of extreme bootstrap estimates, which may disproportionately inflate estimated variability for province-crop combinations with small sample sizes. The robust coefficient of variation (CV) for each province-crop is defined as:

Robust CV = MAD(bootstrap estimates) * 1 Φ -1 (0.75) prediction

where,  MAD() denotes the median absolute deviation of the bootstrap estimates from their median,  Φ -1 (0.75) is the third quartile of the standard normal distribution, and  prediction is the estimate obtained from the robust regression. The product in the numerator yields a consistent estimator of the standard deviation under the assumption of an approximately normal bootstrap distribution. Dividing this quantity by the predicted estimate produces a robust coefficient of variation.

7. Release Criteria

A set of rules based on the robust coefficients of variation for each province-crop were established to determine which modelled ending stocks are of an acceptable level of quality to publish. Based on these rules, estimates that do not meet quality standards may not be published.

Archived - Evaluation of the Canadian Centre for Justice Statistics Program - Information Sheet

Evaluation of the Canadian Centre for Justice Statistics Program - Information Sheet
Description - Evaluation of the Canadian Centre for Justice Statistics Program - Information Sheet

1: About the evaluation

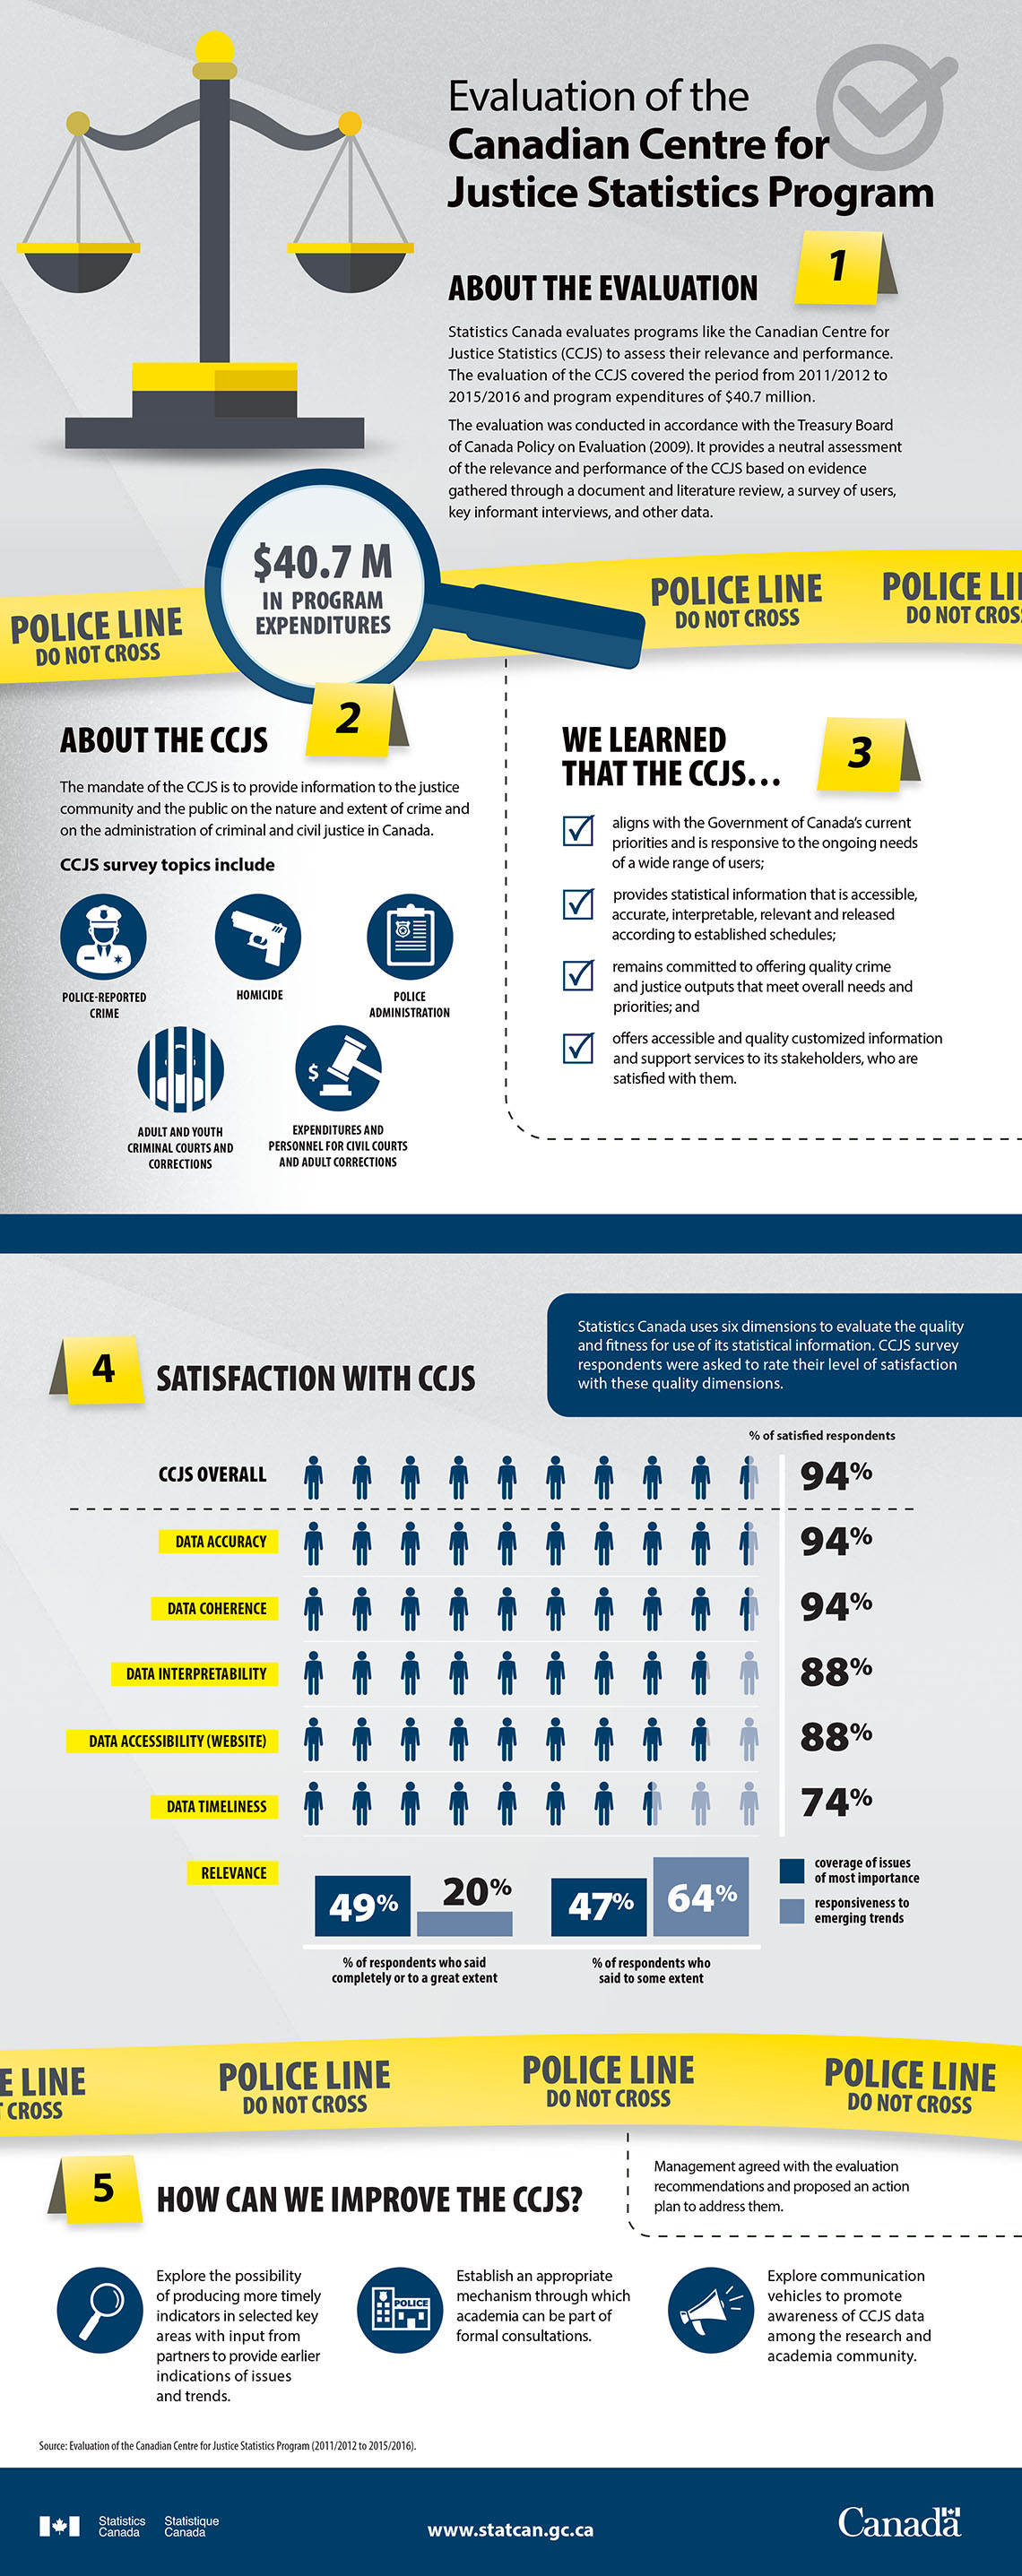
Statistics Canada evaluates programs like the Canadian Centre for Justice Statistics (CCJS) to assess their relevance and performance. The evaluation of the CCJS covered the period from 2011/2012 to 2015/2016 and program expenditures of $40.7 million.

The evaluation was conducted in accordance with the Treasury Board of Canada Policy on Evaluation (2009). It provides a neutral assessment of the relevance and performance of the CCJS based on evidence gathered through a document and literature review, a survey of users, key informant interviews, and other data.

A yellow ribbon crosses the page with the text: "Police Line Do Not Cross"

A magnifying glass appears on the yellow ribbon with the text: $40.7 M in program expenditures

2: About the CCJS

The mandate of the CCJS is to provide information to the justice community and the public on the nature and extent of crime and on the administration of criminal and civil justice in Canada.

CCJS survey topics include

  • police-reported crime
  • homicide
  • police administration
  • adult and youth criminal courts and corrections
  • expenditures and personnel for civil courts and adult corrections.

3: We learned that the CCJS…

  • aligns with the Government of Canada's current priorities and is responsive to the ongoing needs of a wide range of users.
  • provides statistical information that is accessible, accurate, interpretable, relevant and released according to established schedules.
  • remains committed to offering quality crime and justice outputs that meet overall needs and priorities.
  • offers accessibility and quality of customized information and support services to its stakeholders, who are satisfied with them.

4: Satisfaction with CCJS

Statistics Canada uses six dimensions to evaluate the quality and fitness for use of its statistical information. CCJS survey respondents were asked to rate their level of satisfaction with these quality dimensions.

  • CCJS overall: 94% of satisfied respondents
  • Data accuracy: 94% of satisfied respondents
  • Data coherence: 94% of satisfied respondents
  • Data interpretability: 88% of satisfied respondents
  • Data accessibility (website): 88% of satisfied respondents
  • Data timeliness: 74% of satisfied respondents
  • Relevance - coverage of issues of most importance: 49% of respondents who said completely or to a great extent and 47% of respondents who said to some extent
  • Relevance - responsiveness to emerging trends: 20% of respondents who said completely or to a great extent and 64% of respondents who said to some extent

A yellow ribbon crosses the page with the text: "Police Line Do Not Cross"

5: How can we improve the CCJS?

  • Explore the possibility of producing more timely indicators in key selected areas with input from partners to provide earlier indications of issues and trends.
  • Establish an appropriate mechanism through which academia can be part of formal consultations.
  • Explore communication vehicles to promote awareness of CCJS data among the research and academia community.

Management agreed with the evaluation recommendations and proposed an action plan to address them.

Source: Evaluation of the Canadian Centre for Justice Statistics Program (2011/2012 to 2015/2016).

2026 Field Crop Survey - November

Introduction

Purpose

The purpose of the field crop surveys is to obtain information on seeded and harvested field crop areas, average yields, production and on-farm stocks at strategic times over the course of a typical crop cycle, which ranges from spring to late fall. Therefore, the field crop surveys are conducted in June, November and December. Model-based estimates are used for March on-farm stocks and model-based estimates of yields and production, obtained from satellite imagery, are produced in July and August. Seeding intentions are collected in December.

Additional information

Your information may also be used by Statistics Canada for other statistical and research purposes.

Authority

This information is collected under the authority of the Statistics Act, Revised Statutes of Canada, 1985, Chapter S-19.

Completion of this questionnaire is a legal requirement under this act.

Purpose

The purpose of the field crop surveys is to obtain information on seeded and harvested field crop areas, average yields, production and on-farm stocks at strategic times over the course of a typical crop cycle, which ranges from spring to late fall. Therefore, the field crop surveys are conducted in June, November and December. Your information may also be used by Statistics Canada for other statistical and research purposes.

Confidentiality

By law, Statistics Canada is prohibited from releasing any information it collects that could identify any person, business, or organization, unless consent has been given by the respondent, or as permitted by the Statistics Act. Statistics Canada will use the information from this survey for statistical purposes only.

Data-sharing agreements

To reduce respondent burden, Statistics Canada has entered into data-sharing agreements with provincial and territorial statistical agencies and other government organizations, which have agreed to keep the data confidential and use them only for statistical purposes. Statistics Canada will only share data from this survey with those organizations that have demonstrated a requirement to use the data.

Section 11 of the Statistics Act provides for the sharing of information with provincial and territorial statistical agencies that meet certain conditions. These agencies must have the legislative authority to collect the same information, on a mandatory basis, and the legislation must provide substantially the same provisions for confidentiality and penalties for disclosure of confidential information as the Statistics Act. Because these agencies have the legal authority to compel businesses to provide the same information, consent is not requested and businesses may not object to the sharing of the data.

For this survey, there are Section 11 agreements with the provincial statistical agencies of Newfoundland and Labrador, Nova Scotia, New Brunswick, Quebec, Ontario, Manitoba, Saskatchewan, Alberta and British Columbia. The shared data will be limited to information pertaining to business establishments located within the jurisdiction of the respective province.

Section 12 of the Statistics Act provides for the sharing of information with federal, provincial or territorial government organizations. Under Section 12, you may refuse to share your information with any of these organizations by writing a letter of objection to the Chief Statistician and returning it with the completed questionnaire. Please specify the organizations with which you do not want to share your data.

For this survey, there are Section 12 agreements with provincial and territorial ministries of agriculture and with the Prince Edward Island Statistical agency.

For agreements with provincial and territorial government organizations, the shared data will be limited to information pertaining to business establishments located within the jurisdiction of the respective province or territory.

Record linkage

To enhance the data from this survey and to minimize the reporting burden, Statistics Canada may combine it with information from other surveys or from administrative sources.

Security of emails and faxes

Statistics Canada advises you that there could be a risk of disclosure during facsimile or email. However upon receipt, Statistics Canada will provide the guaranteed level of protection afforded all information collected under the authority of the Statistics Act.

Note: Our online questionnaires are secure, there is no risk of data interception when responding to Statistics Canada online surveys.

Reporting instructions

Business or organization and contact information

1. Please verify or provide the business or organization's legal and operating name and correct where needed. Note: Legal name modifications should only be done to correct a spelling error or typo.

  • Legal name
  • Operating name (if applicable)

2. Please verify or provide the contact information of the designated business or organization contact person for this questionnaire and correct where needed.

Note: The designated contact person is the person who should receive this questionnaire. The designated contact person may not always be the one who actually completes the questionnaire.

  • First name
  • Last name
  • Title
  • Preferred language of communication
  • Mailing address (number and street)
  • City
  • Province, territory or state
  • Postal code or ZIP code
  • Country
  • Email address
  • Telephone number (including area code)
  • Extension number (if applicable)
  • Fax number (including area code)

3. Please verify or provide the current operational status of the business or organization identified by the legal and operating name above.

  1. Operational
  2. Not currently operational e.g., temporarily or permanently closed, change of ownership
    • Why is this business or organization not currently operational?
      1. Seasonal operations
      2. Ceased operations
      3. Sold operations
      4. Amalgamated with (an) other business(es) or organization(s)
      5. Temporarily inactive but will re-open
      6. No longer operating due to other reason(s)
    • Business or organization and contact information - Question identifier: 3a
      • Seasonal operations
      • When did this business or organization close for the season?
        Date:
      • When does this business or organization expect to resume operations?
        Date:
    • Business or organization and contact information - Question identifier: 3b
      • Ceased operations
        • When did this business or organization cease operations?
          Date:
        • Why did this business or organization cease operations?
          1. Bankruptcy
          2. Liquidation
          3. Dissolution
          4. Other reasons - specify: 
        • Why did this business or organization cease operations?
          Other reasons - specify:
    • Business or organization and contact information - Question identifier: 3c
      • Sold operations
        • When was this business or organization sold?
          Date:
        • What is the legal name of the buyer?
    • Business or organization and contact information - Question identifier: 3d
      • Amalgamated with (an) other business(es) or organization(s)
        • When did this business or organization amalgamate?
          Date:
        • What is the legal name of the resulting or continuing business or organization?
        • What is (are) the legal name(s) of the other amalgamated business(es) or organization(s)?
    • Business or organization and contact information - Question identifier: 3e
      • Temporarily inactive but will re-open
        • When did this business or organization become temporarily inactive?
          Date:
        • When does this business or organization expect to resume operations?
          Date:
        • Why is this business or organization temporarily inactive?
    • Business or organization and contact information - Question identifier: 3f
      • No longer operating due to other reason(s)
        • When did this business or organization cease operations?
          Date:
        • Why did this business or organization cease operations?

Main activity

4. Please verify or provide the current main activity of the business or organization identified by the legal and operating name.

Note: The described activity was assigned using the North American Industry Classification System (NAICS).

  1. This is the current main activity. - Go to next section
  2. This is not the current main activity.
    Please provide a brief but precise description of this business or organization's main activity.
    e.g., breakfast cereal manufacturing, shoe store, software development

5. Was this business or organization's main activity ever classified as:

  1. Yes
  2. No - Go to next section

6. When did the main activity change?

Date:

All land operated

The following questions deal with all land operated.

Include land rented from other operations and Crown or public land used for agricultural purposes.
Exclude land rented to other operations.

Unit of measure

1. For the following questions, what unit of measure will be used to report land areas?

  1. Acres
  2. Hectares
  3. Arpents (for Québec only)

Fall rye and winter wheat seeded in previous year

2. In the fall of 2025, did you seed any fall rye and/or winter wheat?

  1. Yes - Go to question 3
  2. No - Go to question 7

3. For the following crops, indicate the area seeded in the fall of 2025 and the area harvested as grain.

  1. Fall rye
  2. Winter wheat

4. For the harvested area of fall rye and winter wheat, do you prefer to report the average yield or the total production?

  1. Average yield - Go to question 5
  2. Total production - Go to question 6

5. For the fall rye and winter wheat, indicate the average yield you obtained in 2026.

Go to question 7

6. For the fall rye and winter wheat, indicate the total production you obtained in 2026.

Total production: Unit of measure
(select per crop)

  1. Bushels
  2. Metric tonnes
  3. Imperial tons
  4. Kilograms
  5. Pounds
  6. Hundredweights
    1. Fall rye
    2. Winter wheat

Fall rye and winter wheat seeded this year

7. Did you or do you intend to seed any fall rye or winter wheat in the fall of 2026?

  1. Yes - Go to question 8
  2. No - Go to question 9

8. For the fall rye and/or winter wheat, what is the area you seeded or intend to seed in the fall of 2026?

  1. Fall rye
  2. Winter wheat

Crops seeded 2026

9. Did you seed any crops in 2026?

  1. Yes - Go to question 10
  2. No - Go to question 30

Areas seeded and harvested in 2026

10. For the following crops, what is the seeded area and the area harvested or expected to be harvested as grain in 2026?

Area harvested or expected to be harvested as grain excludes areas of crops to be baled, used for green feed, lost to natural causes (e.g., flooding) or abandoned (due to poor quality).

  1. Barley
  2. Buckwheat
  3. Canary seed, hairless (canario)
  4. Canary seed, regular
  5. Canola (rapeseed)
  6. Chickpeas, desi
  7. Chickpeas, kabuli
  8. Chickpeas, other and unknown
  9. Corn for grain
    Include seed corn.
    Exclude sweet corn and corn for silage.
  10. Corn for silage
  11. Dry beans, black - black turtle, preto
  12. Dry beans, cranberry - romano
  13. Dry beans, dark red kidney
  14. Dry beans, great northern
  15. Dry beans, light red kidney
  16. Dry beans, pinto
  17. Dry beans, small red (red Mexican)
  18. Dry beans, white pea (Navy)
  19. Dry beans, other and unknown
  20. Dry field peas - green
    Exclude green peas for processing or fresh market
  21. Dry field peas - yellow
  22. Dry field peas - other and unknown
  23. Faba beans (fava, broad)
  24. Flaxseed
  25. Hemp
  26. Lentils - large green
  27. Lentils - red
  28. Lentils - small green
  29. Lentils - other and unknown
  30. Mixed grains 
    i.e., two or more grains sown together
  31. Mustard seed - brown
  32. Mustard seed - oriental
  33. Mustard seed - yellow
  34. Mustard seed - other and unknown
  35. Oats
  36. Potatoes
  37. Soybeans
  38. Spring rye
  39. Sugar beets
  40. Sunflower seed
  41. Triticale
  42. Tobacco
  43. Wheat, durum
  44. Wheat, spring - Canada Western Red Spring (CWRS)
  45. Wheat, spring - Canada Northern Hard Red (CNHR)
  46. Wheat, spring - Canada Prairie Spring Red (CPSR)
    Include semi-dwarf varieties
  47. Wheat, spring - Canada Prairie Spring White (CPSW)
    Include semi-dwarf varieties.
    Exclude soft white spring wheat.
  48. Wheat, spring - Canada Western Extra Strong (CWES)
    Include utility.
  49. Wheat, spring - Canada Western Hard White Spring (CWHWS)
  50. Wheat, spring - Canada Western Soft White Spring (CWSWS)
  51. Wheat, spring — Canada Eastern Red Spring (CERS)
    Include Eastern Hard Red spring
  52. Wheat, spring - other
    Include all other varieties not listed above.
  53. Other - Specify other field crops
    Exclude:
    • Alfalfa, hay and forage seed. These crops will be reported later in the questionnaire.
    • Vegetables, such as pumpkins, green peas, onions, cucumbers, tomatoes, etc.

Average yields or total production in 2026

11. For the crop(s) seeded in 2026 (excluding corn for silage), do you prefer to report the average yield or the total production?

  1. Average yield - Go to question 12
  2. Total production - Go to question 13

12. For the following crops, what is the average yield you obtained or expect to obtain in 2026?

Average yield: Unit of measure per acre, hectare or arpent as selected in question 1
(select per crop)

  1. Bushels
  2. Metric tonnes
  3. Imperial tons
  4. Kilograms
  5. Pounds
  6. Hundredweights
    per acre / per hectare / per arpent


  1. Barley
  2. Buckwheat
  3. Canary seed, hairless (canario)
  4. Canary seed, regular
  5. Canola (rapeseed)
  6. Chickpeas, desi
  7. Chickpeas, kabuli
  8. Chickpeas, other and unknown
  9. Corn for grain
    Include seed corn.
    Exclude sweet corn and corn for silage.
  10. Corn for silage
  11. Dry beans, black - black turtle, preto
  12. Dry beans, cranberry - romano
  13. Dry beans, dark red kidney
  14. Dry beans, great northern
  15. Dry beans, light red kidney
  16. Dry beans, pinto
  17. Dry beans, small red (red Mexican)
  18. Dry beans, white pea (Navy)
  19. Dry beans, other and unknown
  20. Dry field peas - green
    Exclude green peas for processing or fresh market
  21. Dry field peas - yellow
  22. Dry field peas - other and unknown
  23. Faba beans (fava, broad)
  24. Flaxseed
  25. Hemp
  26. Lentils - large green
  27. Lentils - red
  28. Lentils - small green
  29. Lentils - other and unknown
  30. Mixed grains 
    i.e., two or more grains sown together
  31. Mustard seed - brown
  32. Mustard seed - oriental
  33. Mustard seed - yellow
  34. Mustard seed - other and unknown
  35. Oats
  36. Potatoes
  37. Soybeans
  38. Spring rye
  39. Sugar beets
  40. Sunflower seed
  41. Triticale
  42. Tobacco
  43. Wheat, durum
  44. Wheat, spring - Canada Western Red Spring (CWRS)
  45. Wheat, spring - Canada Northern Hard Red (CNHR)
  46. Wheat, spring - Canada Prairie Spring Red (CPSR)
    Include semi-dwarf varieties
  47. Wheat, spring - Canada Prairie Spring White (CPSW)
    Include semi-dwarf varieties.
    Exclude soft white spring wheat.
  48. Wheat, spring - Canada Western Extra Strong (CWES)
    Include utility.
  49. Wheat, spring - Canada Western Hard White Spring (CWHWS)
  50. Wheat, spring - Canada Western Soft White Spring (CWSWS)
  51. Wheat, spring — Canada Eastern Red Spring (CERS)
    Include Eastern Hard Red spring
  52. Wheat, spring - other
    Include all other varieties not listed above.
  53. Other - Specify other field crops
    Exclude:
    • Alfalfa, hay and forage seed. These crops will be reported later in the questionnaire.
    • Vegetables, such as pumpkins, green peas, onions, cucumbers, tomatoes, etc.

Go to question 14

13. For the following crops, what is the total production you obtained or expect to obtain in 2026?

Total production: Unit of measure
(select per crop)

  1. Bushels
  2. Metric tonnes
  3. Imperial tons
  4. Kilograms
  5. Pounds
  6. Hundredweights


  1. Barley
  2. Buckwheat
  3. Canary seed, hairless (canario)
  4. Canary seed, regular
  5. Canola (rapeseed)
  6. Chickpeas, desi
  7. Chickpeas, kabuli
  8. Chickpeas, other and unknown
  9. Corn for grain
    Include seed corn.
    Exclude sweet corn and corn for silage.
  10. Corn for silage
  11. Dry beans, black - black turtle, preto
  12. Dry beans, cranberry - romano
  13. Dry beans, dark red kidney
  14. Dry beans, great northern
  15. Dry beans, light red kidney
  16. Dry beans, pinto
  17. Dry beans, small red (red Mexican)
  18. Dry beans, white pea (Navy)
  19. Dry beans, other and unknown
  20. Dry field peas - green
    Exclude green peas for processing or fresh market
  21. Dry field peas - yellow
  22. Dry field peas - other and unknown
  23. Faba beans (fava, broad)
  24. Flaxseed
  25. Hemp
  26. Lentils - large green
  27. Lentils - red
  28. Lentils - small green
  29. Lentils - other and unknown
  30. Mixed grains 
    i.e., two or more grains sown together
  31. Mustard seed - brown
  32. Mustard seed - oriental
  33. Mustard seed - yellow
  34. Mustard seed - other and unknown
  35. Oats
  36. Potatoes
  37. Soybeans
  38. Spring rye
  39. Sugar beets
  40. Sunflower seed
  41. Triticale
  42. Tobacco
  43. Wheat, durum
  44. Wheat, spring - Canada Western Red Spring (CWRS)
  45. Wheat, spring - Canada Northern Hard Red (CNHR)
  46. Wheat, spring - Canada Prairie Spring Red (CPSR)
    Include semi-dwarf varieties
  47. Wheat, spring - Canada Prairie Spring White (CPSW)
    Include semi-dwarf varieties.
    Exclude soft white spring wheat.
  48. Wheat, spring - Canada Western Extra Strong (CWES)
    Include utility.
  49. Wheat, spring - Canada Western Hard White Spring (CWHWS)
  50. Wheat, spring - Canada Western Soft White Spring (CWSWS)
  51. Wheat, spring — Canada Eastern Red Spring (CERS)
    Include Eastern Hard Red spring
  52. Wheat, spring - other
    Include all other varieties not listed above.
  53. Other - Specify other field crops
    Exclude:
    • Alfalfa, hay and forage seed. These crops will be reported later in the questionnaire.
    • Vegetables, such as pumpkins, green peas, onions, cucumbers, tomatoes, etc.

If corn for silage was reported in question 10, go to question 14, otherwise, go to question 18.

14. For the corn for silage seeded in 2026, do you prefer to report the average yield or the total production?

  1. Average yield - Go to question 15
  2. Total production - bushels, metric tonnes, etc. - Go to question 16
  3. Total production - using silo dimensions - Go to question 17

If corn for silage was reported in question 10, go to question 14, otherwise, go to question 18.

15. For the corn for silage, what is the average yield you obtained or expect to obtain in 2026?

Average yield: Unit of measure per acre, hectare or arpent as selected in question 1

  1. Bushels
  2. Metric tonnes
  3. Imperial tons
  4. Kilograms
  5. Pounds
  6. Hundredweights
    per acre / per hectare / per arpent
    1. Corn for silage

Go to question 18

If corn for silage was reported in question 10, go to question 14, otherwise, go to question 18.

16. For the corn for silage, what is the total production you obtained or expect to obtain in 2026?

Total production: Unit of measure

  1. Bushels
  2. Metric tonnes
  3. Imperial tons
  4. Kilograms
  5. Pounds
  6. Hundredweights
    1. Corn for silage

Go to question 18

Silo storage for corn for silage

17. What are the silos dimensions and percentage filled for the corn for silage stored in vertical and/or horizontal silos and/or in silo bags?

1 metre = 3 feet approximately

Vertical silos: Diameter (in feet) / Height (in feet) / % full

  1. Silo 1
  2. Silo 2
  3. Silo 3

Horizontal silos: Length (in feet) / Width (in feet) / Height (in feet) / % full

  1. Silo 1
  2. Silo 2
  3. Silo 3

Silos bags: Diameter (in feet) / Length (in feet)

  1. Silo 1
  2. Silo 2
  3. Silo 3

Percentage moisture of harvested corn

18. What is the percent moisture content of the corn for grain when harvested, if applicable?

Include seed corn.
Exclude sweet corn and corn silage.

Percentage from 1.0% to 40.0%

19. What is the percent moisture content of the corn for silage when harvested, if applicable?

Percentage from 45.0% to 90.0%

Areas with genetically modified seed (corn for grain)

If corn for grain was reported in question 10, go to question 20, otherwise, go to question 25.

20. Of the corn for grain area reported in question 10, was any seeded with genetically modified seed?

Exclude varieties produced by traditional cross-breeding techniques.

21. Of the area you reported in question 10, how much of it was seeded and harvested with genetically modified seed?

  1. Genetically modified corn for grain
    Area seeded
  2. Genetically modified corn for grain
    Area harvested or expected to be harvested as grain

22. For the genetically modified corn for grain, do you prefer to report the average yield or the total production?

  1. Average yield - Go to question 23
  2. Total production - Go to question 24

23. For the genetically modified corn for grain, what is the average yield you obtained or expect to obtain in 2026?

Go to question 25

24. For the genetically modified corn for grain, what is the total production you obtained or expect to obtain in 2026?

Areas with genetically modified seed (soybeans)

If soybeans were reported in question 10, go to question 25, otherwise, go to question 30.

25. Of the soybeans area reported in question 10, was any seeded with genetically modified seed?

Exclude varieties produced by traditional cross-breeding techniques.

26. Of the area you reported in question 10, how much of it was seeded and harvested with genetically modified seed?

  1. Genetically modified soybeans
    Area seeded
  2. Genetically modified soybeans
    Area harvested or expected to be harvested as grain

27. For the genetically modified soybeans, do you prefer to report the average yield or the total production?

28. For the genetically modified soybeans, what is the average yield you obtained or expect to obtain in 2026?

Average yield: Unit of measure per acre, hectare or arpent as selected in question 1

  1. Bushels
  2. Metric tonnes
  3. Imperial tons
  4. Kilograms
  5. Pounds
  6. Hundredweights
    per acre / per hectare / per arpent 

Go to question 30

29. For the genetically modified soybeans, what is the total production you obtained or expect to obtain in 2026?

  1. Bushels
  2. Metric tonnes
  3. Imperial tons
  4. Kilograms
  5. Pounds
  6. Hundredweights

Tame hay and forage seed

30. Did you grow any alfalfa, other tame hay or forage seed in 2026?

Include hay grown on land rented from other operations and Crown or public land.

  1. Yes - Go to question 31
  2. No - Go to question 36

31. For the following crops, what was your total area and harvested area in 2026?

Exclude under-seeded areas.

Note: The harvested area remains the same despite multiple cuts (e.g., 3 cuts of 50 acres should be reported as 50 acres of harvested area).

  1. Alfalfa and alfalfa mixtures
  2. Other tame hay
  3. Forage seed

32. For the following types of hay, what is the number of bales you produced and the average weight?

Alfalfa cut as dry hay

  1. Round bales
    • Number of bales
    • Average weight
    • Unit of measure
      1. Pounds
      2. Kilograms
  2. Square or rectangular bales
    • Number of bales
    • Average weight
    • Unit of measure
      1. Pounds
      2. Kilograms

Alfalfa cut for silage

  1. Round bales
    • Number of bales
    • Average weight
    • Unit of measure
      1. Pounds
      2. Kilograms
  2. Square or rectangular bales
    • Number of bales
    • Average weight
    • Unit of measure
      1. Pounds
      2. Kilograms

Other tame hay cut as dry hay

  1. Round bales
    • Number of bales
    • Average weight
    • Unit of measure
      1. Pounds
      2. Kilograms
  2. Square or rectangular bales
    • Number of bales
    • Average weight
    • Unit of measure
      1. Pounds
      2. Kilograms

Other tame hay cut for silage

  1. Round bales
    • Number of bales
    • Average weight
    • Unit of measure
      1. Pounds
      2. Kilograms
  2. Square or rectangular bales
    • Number of bales
    • Average weight
    • Unit of measure
      1. Pounds
      2. Kilograms

Alfalfa and other tame hay harvested for silage

33. Do you store alfalfa or other tame hay cut for silage in silos?

  1. Yes - Go to question 34
  2. No - Go to question 35

34. What are the silos dimensions and percentage filled content of the silos?

1 metre = 3 feet approximately

Vertical silos: Diameter (in feet) / Height (in feet) / % full

  1. Silo 1
  2. Silo 2
  3. Silo 3

Horizontal silos: Length (in feet) / Width (in feet) / Height (in feet) / % full

  1. Silo 1
  2. Silo 2
  3. Silo 3

Silos bags: Diameter (in feet) / Length (in feet)

  1. Silo 1
  2. Silo 2
  3. Silo 3

35. What is the percent moisture content of the alfalfa and other tame hay harvested for silage, if applicable?

Percentage from 30.0% to 75.0%

Other land areas

36. Please report your areas in 2026 for the following:

  1. Summerfallow
    Include chemfallow areas, winterkilled areas (i.e., fall crop areas ploughed under but not reseeded) etc.
  2. Land for pasture or grazing
    Exclude areas to be harvested as dry hay, silage or forage seed, community pastures, co-operative
    grazing associations or grazing reserves.
    Note: If a field is used the same year for harvesting tame hay and as pasture, count it only once as a tame hay field.
  3. Other land
    e.g., farm buildings and farmyard , vegetable gardens, roads, woodland, swamp

Area in crops

38. What area of this operation is used for the following crops?

Unit of measure:

  1. Acres
  2. Hectares
  3. Arpents


  1. Field crops
  2. Hay
  3. Summerfallow
  4. Potatoes
  5. Fruit, berries and nuts
  6. Vegetables
  7. Sod
  8. Nursery products

Greenhouse area

39. What is the total area under glass, plastic or other protection used for growing plants?

Total area:

  1. Square feet
  2. Square metres 

Livestock - excluding birds

40. How many of the following animals are on this operation?

Report all animals on this operation, regardless of ownership, including those that are boarded,custom-fed or fed under contract.
Include all animals kept by this operation, regardless of ownership, that are pastured on a community pasture, grazing co-op or public land.
Exclude animals owned but kept on a farm, ranch or feedlot operated by someone else.

  1. Cattle and calves
  2. Pigs
  3. Sheep and lambs
  4. Mink
  5. Fox

Birds

41. How many of the following birds are on this operation?

Report all poultry on this operation, regardless of ownership, including those grown under contract.
Include poultry for sale and poultry for personal use.
Exclude poultry owned but kept on an operation operated by someone else.

  1. Hens and chickens
  2. Turkeys

Maple taps

42. What was the total number of taps made on maple trees last spring?

  1. Total number of taps

Honey bees

43. How many live colonies of honey bees (used for honey production or pollination) are owned by this operation?

Include bees owned, regardless of location.

  1. Number of colonies

Mushrooms

44. What is the total growing area (standing footage) for mushrooms?

Include mushrooms grown using beds, trays, tunnels or logs.

Total area:

  1. Square feet
  2. Square metres

Changes or events

45. Please indicate below, any changes or events that may have affected the reported values for this business or organization compared to the last reporting period

Mark all that apply:

  • Price changes in goods or services sold
  • Price changes in labour or raw materials
  • Natural disaster
  • Sold business units
  • Expansion
  • Other change or event - please specify:
    OR
  • No change or event

Contact person

Statistics Canada may need to contact the person who completed this questionnaire for further information.

If the contact person is the same as on cover page, please check [] and Go to " Feedback "

Otherwise, who is the best person to contact about this questionnaire?

  • First name
  • Last name
  • Title
  • Email address (example: user@example.gov.ca)
  • Telephone number (including area code)
  • Extension number (if applicable)
  • Fax number (including area code)

Feedback

How long did it take to complete this questionnaire?

Include the time spent gathering the necessary information.

  • Hours:
  • Minutes:

We invite your comments about this questionnaire.