
Archived - Evaluation of the Canadian Centre for Justice Statistics Program
(2011/2012 to 2015/2016)
Evaluation Report
July 2017
- Context
- Findings: Relevance
- 2.1 Continued need for the Canadian Centre for Justice Statistics program
- 2.2 Alignment with government and key partners' priorities
- 2.3 Consistency with federal roles and responsibilities
- Findings: Performance—Achievement of Expected Outcomes
- 3.1 Accuracy
- 3.2 Timeliness
- 3.3 Accessibility
- 3.4 Coherence
- 3.5 Interpretability
- 3.6 Relevance
- 3.7 Use of the statistical information
- Findings: Performance—Demonstration of Efficiency and Economy
- Conclusions and Recommendations
- 5.1 Conclusions
- 5.2 Recommendations
- Management Response and Action Plan
- Appendix 1: References
- Appendix 2: National Justice Statistics Initiative (NJSI) Governance
- Appendix 3: Canadian Centre for Justice Statistics Key Surveys and Data Products
- Appendix 4: Canadian Centre for Justice Statistics Logic Model
- Appendix 5: Evaluation Issues and Questions
- Appendix 6: Evaluation Strategy
- Appendix 7: Mandate Letter Priorities
List of figures
- Figure 1 Factors contributing to data delays
- Figure 2 Canadian Centre for Justice Statistics program expenditures from 2011/2012 to 2015/2016
- Figure 3 Canadian Centre for Justice Statistics logic model
List of tables
- Table 1 Evaluation limitations and mitigation strategies
- Table 2 Online access to Canadian Centre for Justice Statistics products, number of page views from 2012/2013 to 2015/2016
- Table 3 Comparative analysis of metadata as of April 2015
- Table 4 Top Canadian Centre for Justice Statistics products that are linked on the Internet
- Table 5 Canadian Centre for Justice Statistics program expenditures ($)
- Table 6 Core evaluation questions
- Table 7 Key informant interviewees, by category
List of Acronyms and Abbreviations
- ACS
- Adult Correctional Services
- CACP
- Canadian Association of Chiefs of Police
- CCJS
- Canadian Centre for Justice Statistics
- CKIR
- Corrections Key Indicator Report for Adults and Youth
- CORIS
- Corrections Information and Statistics Sub-committee to the Heads of Corrections
- CRDCN
- Canadian Research Data Centres Network
- CSC
- Correctional Service Canada
- CSI
- Crime Severity Index
- CVs
- Coefficients of variation
- DQS
- Data Quality Secretariat
- EPPD
- Evaluation and Professional Practices Division
- FPT
- Federal, provincial and territorial
- FRS
- Financial Request System
- GSS
- General Social Survey
- ICCS
- Integrated Criminal Court Survey
- ICSS
- Integrated Correctional Services Survey
- INAC
- Indigenous and Northern Affairs Canada
- IRCC
- Immigration, Refugees and Citizenship Canada
- JIR
- Justice Information Roadmap
- LOC
- Liaison Officers Committee
- LOCNJSI
- Liaison Officers Committee of the National Justice Statistics Initiative
- MES
- Maintenance Enforcement Survey
- MOU
- Memorandum of understanding
- NGO
- Non-governmental organization
- NJSI
- National Justice Statistics Initiative
- OAG
- Office of the Auditor General
- OECD
- Organisation for Economic Co-operation and Development
- OID
- Operations and Integration Division
- OSCE
- Organization for Security and Co-operation in Europe
- PCH
- Canadian Heritage
- PNP
- Private non-profit
- POLIS
- Police Information and Statistics Committee
- P/T
- Provincial/Territorial
- PUMF
- Public use microdata file
- QAF
- Statistics Canada's Quality Assurance Framework
- UNODC
- United Nations Office on Drugs and Crime
- WIP
- Work-in-progress (review process)
Executive Summary
The Evaluation and Professional Practices Division (EPPD) of the Audit and Evaluation Branch of Statistics Canada conducted an independent assessment of the Canadian Centre for Justice Statistics (CCJS) program. The results provide objective information and recommendations to support program improvement and inform future decisions by Statistics Canada and Parliament with respect to the government's management of resources and programs.
The evaluation was designed and conducted in accordance with the Treasury Board Policy on Evaluation (2009)Footnote 1 and the associated directive and standards, and fulfills an accountability commitment set out in Statistics Canada's Risk-based Audit and Evaluation Plan (2013/2014 to 2015/2016). The objective is to provide credible and neutral information about the ongoing relevance and performance (effectiveness, efficiency and economy) of the program.
The Canadian Centre for Justice Statistics program
The Canadian Centre for Justice Statistics program is the operational arm of a federal–provincial–territorial partnership, the National Justice Statistics Initiative (NJSI), whose mandate is to provide information to the justice community and the public on the nature and extent of crime and on the administration of criminal and civil justice in Canada. The CCJS administers several surveysFootnote 2 on police-reported crime, homicide, police administration, adult criminal courts, youth courts, civil courts and adult corrections, as well as surveys on police personnel and expenditures, and key indicator reports on adult and youth. The CCJS fulfills its mandate in partnership with national, provincial, and territorial authorities, whereby all jurisdictions share responsibility for developing and achieving common objectives.
Evaluation scope and methodology
The evaluation looked at the CCJS's performance over the past five years with a special focus on the last three years (2013/2014 to 2015/2016), as these represented the most recent period of the new direction towards modernization taken by the CCJS. Data for the evaluation were collected from multiple sources of evidence, including a literature review; a document review; a review of financial and administrative data; interviews with representatives of the public sector, the private sector, non-governmental organizations and academia; a survey of data users; and a bibliometric and webometric study. The evaluation strategy relied on qualitative and quantitative evidence. Data from these sources were analyzed and triangulated to arrive at the findings and to generate the recommendations based on the conclusions.
Conclusions
The CCJS responds to an ongoing need for criminal justice information from a wide range of users. The continued need for the CCJS is evident from the fulfillment of its mandate as the operational arm of the federal–provincial–territorial partnership known as the National Justice Statistics Initiative. In addition to producing standard data products, the CCJS also supports federal government priorities by providing information to various House of Commons and Senate committees as well as providing information to support numerous ministerial mandate letter priorities. The evaluation findings confirm that CCJS statistical information is accurate, interpretable, accessible, relevant and generally released according to established schedules. There is an interest in increasing the accessibility of data for researchers and academics and in receiving data in a more timely fashion for policy and program decisions. Overall, the CCJS provides access to high-quality, relevant statistical information, which is used to support public debate, decision making and research.
Relevance: The evaluation evidence demonstrates a continued need for the program. The program is responsive to the ongoing needs of a wide range of users such as federal departments; provincial, territorial and municipal governments; academic communities; individuals from the general public, including the media; and international organizations such as the United Nations, and the Organization for Security and Co-operation in Europe.
The need for the program is further demonstrated by the fulfillment of its legislative mandate as the operational arm of the cross-jurisdictional NJSI partnership. Stakeholders perceive that the impact of not having justice statistics from the CCJS would be substantially negative due to the absence of valid, reliable, and comparable national data, and would negatively impact the ability to conduct interjurisdictional comparisons. The CCJS is the only national provider of crime and justice information and its mandate outlines its unique role. Due to its expertise, the CCJS is considered the best organization to fulfill this role.
The program is also aligned with the Government of Canada's current priorities. As a subject-matter expert, the CCJS is often called upon by Senate and House of Commons committees to present information on justice and public safety to advance the work of government. Furthermore, the CCJS will provide information to support 15 ministerial mandate letter priorities,Footnote 3 including the National Inquiry into Missing and Murdered Indigenous Women and Girls, and a review of the changes in the criminal justice system and sentencing reforms. The CCJS is also the point of contact to fulfill information-sharing commitments with the Organization for Security and Co-operation in Europe for hate crimes, and the United Nations Office on Drugs and Crime for the UN's annual Survey of Crime Trends and Operations of Criminal Justice Systems.
Performance: The potential impact of the program is directly correlated with the quality and relevance of the statistical information made available.
- Accuracy: The evaluation findings confirm that CCJS statistical information is accurate. Of the products released by the CCJS program since 2011/2012, there was only one post-release correction due to accuracy. The CCJS has rigorous data processing systems and well-established processes for data verification, including a work-in-progress review process for the Liaison Officers Committee of the National Justice Statistics Initiative, which allows stakeholders to review Juristat articles for accuracy prior to release.
- Timeliness: Although CCJS data are generally released according to schedule, there is an interest in receiving data in a more timely fashion for making policy and program decisions. However, there is also recognition that timeliness is related, at least in part, to the administrative nature of the data and reliance on data providers. Timeliness was also linked to data relevance, as the most recent data reflected trends occurring more than a year ago.
- Accessibility: The evaluation findings confirmed that CCJS products are generally accessible, in terms of availability of products and means of access. Between 2012/2013 and 2015/2016, 4.7 million pages on crime and justice statistics (CANSIM tables, publications and summary tables) were viewed. Juristat was by far the most popular publication, representing 78% of all CCJS publication page views and 9% of all Statistics Canada publication page views for the 2012/2013 to 2015/2016 period.
Most key informants were generally satisfied with the accessibility of CCJS information. However, some issues were raised related to accessibility, including findability of information on Statistics Canada's website, better communication and notification regarding CCJS releases (such as use of social media or push notifications), and product design (such as more effective use of visual data representations). It was suggested that accessibility of data through research data centres (RDCs) could be improved by providing more up-to-date data, increasing access to types of data not currently available in RDCs and increasing awareness about CCJS products in RDCs. - Coherence: CCJS information is generally coherent. Most key informants reported that the CCJS effectively applied common methodologies to the data, which allowed for comparability and the clear identification of methodological changes. The CCJS is also involved in several activities and working groups to maintain and enhance coherence of CCJS statistical information. In 2014, the CCJS established an internal Data Quality Secretariat (DQS) to ensure high data quality. The CCJS also has a work-in-progress (WIP) review process for the Liaison Officers Committee of the National Justice Statistics Initiative (LOCNJSI), which allows the stakeholders to review Juristat articles for accuracy, coherence and interpretability.
- Interpretability: The evaluation findings confirm that the interpretability of CCJS statistical information is considered adequate. Although there were some minor deficiencies with CCJS metadata, most stakeholders were satisfied with the interpretability of CCJS data.
- Data relevance: The analysis of data collected through the evaluation process demonstrated that the CCJS consults with its stakeholders to identify the changing or emerging needs and requirements of users, as well as potential information gaps. Key informants reported that the CCJS supports effective collaboration by building strong relationships and establishing processes that promote collaboration between the CCJS and jurisdictional partners (e.g., use of committees). However, some stakeholders identified a need for better communication, particularly related to survey methodologies or processes.
The evaluation found that the CCJS is able to provide justice statistical information that meets stakeholders' information needs and priorities. However, some gaps in alignment with needs were identified. Some of the needs most commonly identified by stakeholders included
- data linking between different datasets to understand how people are flowing through the justice system
- more information on justice system costs to better understand the cost of individuals going through the various components of the justice system
- police data, including data on different types of police activities as well as CCJS national data by police jurisdiction
- better data from courts, including various types and levels of courts
- civil/family law data
- organized crime data
- victimization data
- data on Aboriginal representation in the justice system
- release and remand data.
Use of statistical information: CCJS data are used by various levels of government to fulfill their mandates and responsibilities; by non-governmental organizations, including the media; and by some international organizations. CCJS data are used for a variety of purposes, including conducting research and policy analysis, informing program and service delivery, performing jurisdictional comparisons, understanding national trends, producing internal publications and responding to media questions. Among the most commonly used CCJS products are publications, particularly Juristat.
Efficiency and economy: The evaluation findings support evidence that CCJS management remains committed to offering quality crime and justice outputs that meet overall needs and priorities despite decreasing expenditures and a reduction in FTEs between 2013/2014 and 2015/2016. Key informants reported additional pressure on Statistics Canada's human resources due to increased information needs and the transition to common tools and shared infrastructure.
In addition to activities related directly to survey analysis and dissemination, the CCJS responds to other requests for information to support governmental priorities, which represent an additional workload in the context of existing resources. The CCJS may provide information to support various committees and priorities such as
- representation by the CCJS on federal–provincial–territorial committees that are specific to certain subject-matter areas like victims or crime (the CCJS is often invited to such committees to provide feedback on emerging issues or to respond to specific information needs)
- provision of information by the CCJS for Senate and House of Commons committees on issues related to justice and public safety
- provision of information by the CCJS for 15 ministerial mandate letter priorities.
Recommendations
The evaluation findings demonstrate that CCJS data are generally accurate, coherent, interpretable and used for a variety of purposes by a wide range of stakeholders. Stakeholders expressed a desire for more timely data, which was also perceived to impact the relevance of CCJS data. Stakeholders also identified several areas of emerging needs related to data linkages and relationships between different datasets, as well as a need to increase accessibility of data for research (e.g., through RDCs).
Recommendation 1:
Performance (timeliness)
While the evaluation found that the CCJS program delivers high-quality statistical data that are generally timely, the relevance of justice statistics could be increased by providing earlier indications of justice information changes or trends to facilitate program and policy decisions.
Recognizing that a complete analysis of justice statistics requires time to produce accurate results and that the production of justice statistical data occurs in a context of shared responsibilities, it is recommended that the CCJS explore with partners the possibility of producing more timely indicators in key selected areas to provide earlier indications of issues and trends.
Recommendation 2:
Performance (accessibility)
Currently, academia is not part of the formal governance of the CCJS program. Researchers are informed about CCJS data in RDCs through notifications from RDCs sent to distribution lists at local universities. It is unclear to what extent that information is communicated effectively to targeted faculty and students. Academic researchers are key CCJS data users whose needs are not fully considered given their limited participation in decision making.
Recognizing the value added of the contribution of researchers to CCJS analytical products, it is recommended that the CCJS program
- establish an appropriate mechanism through which academia can be part of formal consultations
- explore communication alternatives to ensure the awareness of CCJS data among the research/academia community.
1. Context
As Canada's national statistical agency, Statistics Canada plays a fundamental role in generating information on Canada's socioeconomic conditions. Statistical data are used to support government decision making at all levels by describing changing events, enabling analysis of policies and programs, and monitoring program outcomes. Some data produced by Statistics Canada are required by legislation.
The Canadian Centre for Justice Statistics
In Canada, federal, provincial and territorial deputy ministers responsible for the justice system work together, along with the Chief Statistician of Canada, in a partnership known as the National Justice Statistics Initiative (NJSI).Footnote 4 Its mandate is to provide information to the justice community and the public on the nature and extent of crime and the administration of criminal and civil justice in Canada. The Canadian Centre for Justice Statistics, a division within Statistics Canada, is the operational arm of the NJSI. The Chief Statistician of Canada is responsible for the national statistical system, and, as a division of Statistics Canada, the CCJS is responsible for fulfilling this responsibility, which includes the development of sound statistical standards and practices to achieve nationally comparable justice statistics. At the same time, the CCJS must abide by the legislation and policies that are fundamental to maintaining the integrity of the national statistical system.Footnote 5
The CCJS, in collaboration with NJSI partners, develops and implements national surveys and special studies covering the major sectors of the justice system: policing, prosecutions, legal aid, courts and corrections. Information for these surveys and special studies is usually extracted from operational or management reporting systems in the jurisdictions, pursuant to an agreed-upon set of national data requirements. The focus of the program's activities is the development, collection, integration, analysis and dissemination of official justice statistics that reflect trends in Canada, as well as the development of national and jurisdictional-level indicators on various aspects of crime and justice.
CCJS program activities are divided into three main areas, each with key surveys and data products:Footnote 6
- Policing Services Program (PSP)
- Uniform Crime Reporting (UCR) Survey
- Homicide Survey
- Police Administration Survey (PAS)
- Transition Home Survey (THS)
- Victim Services Survey (VSS)
- Courts Program
- Integrated Criminal Court Survey (ICCS)
- Survey of Maintenance Enforcement Programs (SMEP)
- Civil Court Survey (CCS)
- Legal Aid Survey (LAS)
- Correctional Services Program
- Adult Correctional Services (ACS) Survey
- Youth Custody and Community Services Survey (YCCS)
- Corrections Key Indicator Report for Adults and Youth (CKIR)
- Integrated Correctional Services Survey (ICSS).
In addition to these surveys, the CCJS provides expert advice on the content of the General Social Survey (GSS) on victimization. The main objective of the GSS on Canadians' Safety (Victimization) is to better understand how Canadians perceive crime and the justice system and to capture information on their experiences of victimization.Footnote 7
In addition to these core activities, the CCJS conducts in-depth analysis on a variety of justice-related topics and issues, and provides subject-matter advice to external and internal partners on the topics of crime, victimization and the justice system. For example, in response to requests from House of Commons and Senate committees, the CCJS frequently prepares presentations on specific topics that support policy discussions. Results of analysis are presented in Statistics Canada's flagship publications Juristat or Juristat Bulletin, which highlight results from the courts, corrections and policing surveys. The CCJS also releases an annual report on family violence as part of its contribution to the Family Violence Initiative (FVI).
The total program expenditure was $40.7 million over the period from 2011/2012 to 2015/2016.Footnote 8
About the evaluation
An evaluation was conducted as a neutral assessment of the relevance and performance of the Canadian Centre for Justice Statistics program, in accordance with the requirements of the Treasury Board's Policy on Evaluation (2009).Footnote 9 The objective of this evaluation was to assess whether the CCJS provides quality key statistical information that is being generated efficiently and that responds to user needs.Footnote 10
The evaluation covered the period from April 1, 2011, to March 31, 2016, focusing on CCJS activities and associated custom products and services. A mixed-method approach, integrating quantitative and qualitative evidence, was used with 12 evaluation questions as part of the strategy to assess the core issues related to the relevance and performance of the program.Footnote 11 Multiple lines of evidence were employed, including
- document and literature reviews
- an administrative data review
- key informant interviews with 47 internal and external stakeholders, including the public sector (federal, provincial and municipal), the private sector, non-governmental organizations and academia
- a survey of 156 data users knowledgeable about the program and its products
- a bibliometric and webometric study.
Logical and statistical analysis was used, and findings were correlated to identify trends and patterns. Data from these sources were analyzed and triangulated to develop the conclusions and recommendations.
The evaluation encountered limitations which were mitigated by the strategies outlined in Table 1.
| Limitations | Mitigation strategies |
|---|---|
| Scheduling of external stakeholders became a challenge during the fieldwork phase, as many external stakeholders who were originally suggested as primary or back-up interviewees declined to participate. |
|
| There was a 16% response rate to the survey (156 out of 967 valid cases identified for the CCJS sample). |
|
| The assessment of efficiency was challenging because financial data were not linked to specific activities, outputs and outcomes. |
|
2. Findings: Relevance
This section summarizes evaluation findings that emerged from the data collection process. It focuses specifically on the relevance of the Canadian Centre for Justice Statistics program, by exploring the demonstrable need for the program, its alignment with government priorities, and its consistency with the roles and responsibilities of the federal government.
2.1 Continued need for the Canadian Centre for Justice Statistics program
Summary
Findings from various sources demonstrate a clear need for the CCJS program. The continued need is evident from the fulfillment of its mandate as the operational arm of the federal–provincial–territorial partnership known as the National Justice Statistics Initiative. The CCJS supports Canada's criminal justice system and Statistics Canada in meeting legislative responsibilities for criminal statistics.
The program is responsive to the ongoing needs of a wide range of users such as federal departments; provincial, territorial and municipal governments; academic communities; individuals from the general public, including the media; and international organizations such as the United Nations, and the Organization for Security and Co-operation in Europe and its Office for Democratic Institutions and Human Rights. Key informant interviews confirm the relevance of justice statistics in providing much-needed, highly valued information about the justice system in Canada.
Canada's criminal justice system is highly complex: federal, provincial, territorial and municipal agencies and organizations all play a part, but no agency or jurisdiction has control or ownership of the entire system. Through the CCJS, the efforts of the NJSI are directed toward the production of justice statistical data to inform the legislative, policy, management and research agendas of federal, provincial and territorial partners, and to inform the public.
"Building and maintaining an effective criminal justice system requires reliable national information on the nature of crime, on crime trends, and on what actions work" (Auditor General of Canada 2002).Footnote 12 Findings from the document and literature reviews indicate that integration of data and information sharing are essential to maintaining the Canadian justice system, given the independence of criminal justice agencies. Meeting these needs aligns with Statistics Canada's broad mandate to collect, compile, analyze and ultimately publish statistical information on all dimensions of Canada's economy, society and environment, and particularly with sections 26 to 29 of the Statistics Act regarding responsibilities for "criminal statistics."Footnote 13
Evaluation findings demonstrate that the CCJS produces data that are used by a wide range of users such as federal departments; provincial, territorial and municipal governments; academic communities; individuals from the general public, including the media; and international organizations such as the Organization for Security and Co-operation in Europe (OSCE) for hate crimes and the United Nations Office on Drugs and Crime (UNODC).
User needs are also varied. For example, the Department of Justice and Public Safety Canada, together with provincial and territorial jurisdictions in policing, courts and corrections, use CCJS information to draft legislation; to develop policies, programs and services for Canadians in the areas of justice and public safety; and to prepare statistical reports such as the Trafficking in Persons annual report. Other federal departments that work closely with the CCJS include Status of Women Canada, particularly on issues related to victimization, and the Department of Canadian Heritage (PCH), on issues related to hate crime.
CCJS data are also used by consortia of different partners and stakeholders who have policy interests in particular justice and public safety areas. For example, the Family Violence Initiative, led by the Public Health Agency of Canada (PHAC), brings together 15 partner departments and agencies to respond to and prevent family violence. The CCJS provides statistical advice and analysis to produce an annual statistical profile that integrates different data sources (police-reported data, homicide data and victimization survey data), which helps to understand the nature and extent of family violence in Canada. Also as part of the Family Violence Initiative, the biennial Transition Home Survey provides information on the shelter services available to abused women and their children, as well as a profile of the individuals whom these facilities serve.Footnote 14
Furthermore, as a subject-matter expert, the CCJS is often called upon by House of Commons and Senate committees to present information on justice and public safety to advance the work of government. In the five years covered by the evaluation, the CCJS provided information to four Senate or House of Commons committees, including three committees that required information from the CCJS in the last two fiscal years examined (2014/2015 and 2015/2016):
- In November 2014, the CCJS provided information to the House of Commons Standing Committee on the Status of Women to begin its study Promising Practices to Prevent Violence Against Women.
- In February 2016, the CCJS provided information to the Standing Senate Committee on Legal and Constitutional Affairs related to court delays in Canada.
- In April 2016, the CCJS provided information for a presentation to the House of Commons Standing Committee on the Status of Women related to violence against young women and girls in Canada.Footnote 15
National and community-level information produced by the CCJS on crime and justice is reported regularly in the media. CCJS survey results were cited 1,141 times in the media between April 1, 2012, and March 31, 2016.Footnote 16 This included information related to the crime rate and the Crime Severity Index (CSI), adult and youth court caseloads and sentencing, the correctional population, and incarceration rates, as well as victims and victimization.
The Government of Canada is committed through different international agreements to fighting crime and ensuring human rights. Because of the CCJS's expertise and the nature of its activities, the program contributes to different international initiatives. For instance, the CCJS is a point of contact to fulfill information-sharing commitments with the Organization for Security and Co-operation in Europe for hate crimes, and the United Nations Office on Drugs and Crime for the UN's annual Survey of Crime Trends and Operations of Criminal Justice Systems.
Almost all key informants believed that there would be a substantial negative impact with the absence of justice statistics from the CCJS. They emphasized the loss of an evidence base that is used to understand the justice system in Canada and to inform decision making related to policies and programs. Without the CCJS, almost all key informants believed that valid, reliable and comparable national data would not be available.
Impact of not having justice statistical information from Statistics Canada:
"In light of what we've discussed [it] would be tantamount to flying without a compass. In so many respects, we look to the information CCJS provides as justice system diagnostics. If we don't have that information coming in at regular intervals, how are we going to identify where we're at within a specific segment of the criminal justice system and how are we tracking?"
About half of key informants reported that without justice statistics from the CCJS, comparisons between jurisdictions would be very challenging. This information is critical to understanding how a certain jurisdiction is performing relative to others, or how a jurisdiction is performing over time in specific areas (e.g., types of crime, court cases). Also, cross-jurisdictional data help jurisdictions understand whether certain trends are regional in nature or are part of a national trend. This allows provinces to explore whether there are lessons to be learned from other jurisdictions. Without cross-jurisdictional data, key informants expressed concerns that the system would become "parochial," and that "our vision would become very limited and narrow."
Some key informants also commented that the ability of government, non-governmental organizations and academics to conduct research would be impacted if CCJS data were not available. Such research benefits government and the justice system by identifying trends, impacts of legislation or policies, or potential issues of concern.
If CCJS data were unavailable, some key informants believed their organizations would try to fill the gap themselves, but would have limited ability to do so with current staff or financial resources. While certain statistics that are derived from centralized sources (e.g., corrections data) might be easy to produce, data that are compiled from many different agencies (e.g., national, provincial and municipal police forces) would be very difficult or impossible to reproduce. A few key informants reported trying to obtain data from provincial jurisdictions or hiring contractors to collect the data. However, they indicated that data from provincial jurisdictions were difficult to obtain, had numerous gaps, and were variable in terms of quality, and that hiring contractors was an expensive alternative.
2.2 Alignment with government and key partners' priorities
Summary
Evidence indicates that the CCJS program is aligned with the Government of Canada's priorities. It supports the priorities and strategic outcomes of Statistics Canada, federal departments and other jurisdiction partners.
There is a long-standing federal commitment to address crime and ensure that the justice system is fair, efficient and accessible to all Canadians. Speeches from the Throne during the evaluation period and recent budgets highlight some of these commitments:
- In the 2015 federal budget, the Government took further steps through additional funding to ensure that victims of crime are at the heart of Canada's judicial system, to assist Canadians in getting the information they need to protect themselves and their families online, and to strengthen the ability of law enforcement agencies to combat cybercrime.Footnote 17
- In the 2016 federal budget, the Government remained committed to ongoing work with provinces and territories on a number of important initiatives, including supporting them in their efforts to take illegal guns off the streets and reduce gang-related violence.Footnote 18
- In the coming years, the CCJS may provide information to support 15 current ministerial mandate letter priorities, including the National Inquiry into Missing and Murdered Indigenous Women and Girls, and a review of the changes in the criminal justice system and sentencing reforms.Footnote 19
All these initiatives contribute to the Whole-of-Government Framework outcome area "A safe and secure Canada," which includes program activities that aim to maintain the safety and security of Canada and its citizens through crime prevention, law enforcement, the securing of Canadian borders, and emergency preparedness.Footnote 20
The governing body of the NJSI is comprised of the federal, provincial and territorial (FPT) deputy ministers responsible for justice. The Chief Statistician of Canada or the Assistant Chief Statistician responsible for the CCJS program attends deputy minister meetings when required.Footnote 21 As the operational arm of the NJSI, the CCJS is continually working to provide information that aligns with government priorities. The CCJS annual operational and strategic plans are determined jointly and approved by the deputy ministers.Footnote 22 The CCJS promotes initiatives with its partners to build and maintain a statistical system flexible enough to respond to new, specific and relevant justice-related topics for all levels of government.
The evaluation found a number of strategic priorities of Statistics Canada in which the CCJS is directly involved detailed in various agency documents. The following are some of the CCJS key initiatives that support the agency's priority of responding to the emerging and evolving information needs of data users and stakeholders:Footnote 23
- Expertise in linking justice and crime-related data: To understand the extent of the re-contact of individuals with the Canadian criminal justice system and their pathways through it, the CCJS is analyzing administrative data from police, courts and corrections facilities. The program is able to add new content to existing surveys, and steps are in place to collect sufficient information to allow data linkages (e.g., linking information such as personal identifiers of names, date of birth) and help evaluate the sociodemographic characteristics of people who have come in contact with the justice system.
- Police performance metrics: Collaborative work is ongoing in this pilot project, which examines opportunities and challenges in collecting national-level data on calls for service. In 2016/2017, key indicators of police performance will be identified, and a framework will be developed for police performance metrics. In 2017/2018, pending funding, systems will be built to extract and collect data on police calls for service.
- New National Fire Information Database: Statistics Canada, in collaboration with the Canadian Association of Fire Chiefs, will be collecting, for the first time, national fire incident and loss data. The CCJS will aggregate, map and model 10 years of provincial and territorial fire data, leading to the first national-level analysis of fire incidents in Canada. This will assist fire services in making timely and critical operational decisions, help guide policy and prevention measures in the development of appropriate and efficient methods of fire response, and help promote community safety through greater public awareness about the dangers of fire.
2.3 Consistency with federal roles and responsibilities
Summary
The CCJS program is aligned with the roles and responsibilities of the federal government and, specifically, the legislative mandate of Statistics Canada. The CCJS program is the only national provider of crime and justice information, and its mandate outlines its unique role. The CCJS is considered the best organization to fulfill this role, due to its expertise.
Justice in Canada is a shared responsibility between the federal government and the provinces and territories. However, the compilation of justice-related statistics for Canada is a federal responsibility and is specifically delineated under sections 22, 26, 27, 28 and 29 of the Statistics Act.Footnote 24 While Statistics Canada has a duty to collect, compile, analyze, abstract and publish statistics in relation to law enforcement and the administration of justice and corrections, it also has the responsibility to collect information on criminal statistics and offences. Under the direction of the NJSI, Statistics Canada has a long history of producing key statistics on the three main CCJS justice domains—policing, courts and corrections—and also information on victims.
About half of key informants did not perceive any issues regarding areas of ambiguity, areas of overlap, gaps in responsibility or conflicting priorities between the CCJS's mandate and the mandate of other statistical programs or institutions, either public or private. Although a few explained that there are other organizations that produce data—such as provinces—there are no other data "integrators" that compile data from across Canada to produce data that allow for comparisons across jurisdictions. Some of the remaining key informants believed that there are areas of ambiguity or gaps in how the CCJS fulfills its mandate, but their comments did not reflect a desire that these areas be handled by other statistical programs or institutions. Rather, key informants commented on particular gaps or ambiguities in the CCJS mandate or collaborations. For example, stakeholders suggested that justice statistics should be more cross-sectoral, or that there should be greater linkages between the CCJS and local statistical agencies or partnering departments, or that the CCJS should provide more or better information in certain areas (e.g., courts or corrections).
When asked whether the mandate of the CCJS could be fulfilled more effectively and efficiently by another organization within or outside the federal government, almost all respondents believed that the CCJS is the most appropriate to fulfill this role. Their comments provided a clear sense of their level of respect and the confidence they have in the CCJS fulfilling this mandate:
- Expertise and authority: Some of these key informants focused on the CCJS's experience and expertise, which come from its involvement in creating the program and building extensive relationships across multiple jurisdictions. The CCJS, as part of Statistics Canada, has credibility (the agency is renowned for rigorous data quality and security) and the authority it needs—via the Statistics Act—to collect data from jurisdictions across Canada. There is doubt that an external agency could be given the sort of access needed to collect this kind of data, and such a move would likely require legislative changes.
- Effective and efficient: Some key informants suggested that other organizations would be less effective and efficient in fulfilling this mandate. There is a perception that the current CCJS executive is forward-thinking in planning and experienced in collaborating, and this would be lost if the program were moved to another organization. Additionally, it is felt that having the responsibility for justice statistics be within Statistics Canada is efficient, because program staff can consult with other statistical experts within the agency.
Because of its mandate, the CCJS is also considered to be the only national provider of justice statistics, as it is the focal point of a federal–provincial–territorial partnership for the collection of information on the nature and extent of crime and the administration of civil and criminal justice in Canada.
Document and literature reviews indicated that Statistics Canada is, for some government programs, the only source of justice information. For instance, in an evaluation report completed in 2010, Citizenship and Immigration Canada (now IRCC) mentioned that "there are no other sources of national, police-reported data on hate crime in Canada. There was wide support for CCJS delivering the Data Collection Strategy and no strong evidence of viable delivery alternatives."Footnote 25 Also, at the department now called Indigenous and Northern Affairs Canada (INAC), the Social Development Program's performance measurement strategy mentions that "Canada has two main sources of national data on crime: the Uniform Crime Reporting (UCR) Survey, and the General Social Survey (GSS) on Victimization (…) The Program relies on this data as its primary source of 'violence' information and does not collect rates of family violence on reserve."Footnote 26
3. Findings: Performance—Achievement of Expected Outcomes
This section summarizes the evaluation findings related to the achievement of the program's expected outcomes. It covers questions related to performance and focuses on the extent to which quality statistical information and support are accessible, and the extent to which information is relevant and used. It is important to note that Statistics Canada's Quality Assurance Framework (QAF)Footnote 27 and quality guidelines define quality as encompassing six related dimensions: accuracy, timeliness, accessibility, coherence, relevance and interpretability. These elements are consistent with internationally accepted standards for assessing the effectiveness of statistical programs.
To manage quality, the agency must balance these quality elements against the constraints of financial and human resources, the goodwill of respondents in providing source data, and competing demands for information in greater quantities and in greater detail. The potential impact of the program (i.e., the extent to which the information is used in the decision-making sphere) is directly correlated with the quality and relevance of the statistical information that is available. In this regard, the evaluation report outlines each dimension of quality of the statistical information available, from the accuracy of information to the extent of its use.
3.1 Accuracy
Summary
Overall, the evaluation evidence points to the high accuracy of CCJS statistical information. The CCJS also works collaboratively with data providers through existing NJSI governance structures to address data quality issues.
The accuracy of statistical information is the degree to which the information correctly describes the phenomena it was designed to measure. It is usually characterized in terms of error in statistical estimates and is traditionally decomposed into bias (systematic error) and variance (random error) components. It may also be described in terms of the major sources of error that potentially cause inaccuracy (e.g., coverage, sampling, nonresponse, response).
According to the agency's 2009 quality guidelines,Footnote 28 for a data product to be accurate, appropriate methods and tools must be used to produce the results. These include choosing sampling methods, encouraging accurate responses, following up on nonresponse to surveys, dealing with missing data, and measuring response rates and sampling error.
In the case of the CCJS, most of the surveys are administrative and mandatory. Therefore, typical measures such as coefficients of variation (CVs) or response rates were not used to assess accuracy. For the CCJS, post-release corrections were examined as an indication of accuracy. Of the 90 products released by the CCJS from 2011/2012 to 2015/2016, there was one post-release correction due to accuracy (1%). It pertained to the Adult Correctional Services (ACS) Survey of the Correctional Services Program and occurred in December 2012. The error was a result of revised data received from a jurisdiction post-release and the subsequent identification of a data capture error.Footnote 29
CCJS accuracy was:
"on par with university academics."
The program areas within the CCJS have rigorous data processing systems and well-established processes for data verification and sign-off for their surveys. Many verifications and certification points occur during the data production process, and it is through these processes that issues related to data quality and accuracy are addressed.Footnote 30
"I much appreciate that they are able to flag those statistics where the data might not be entirely accurate. They have superscript saying be careful using it, but can still apply it somewhat. No issues with quality of data."
Most key informants interviewed were satisfied with the accuracy of the CCJS's statistical information. They expressed their appreciation for the review and verification process and the use of footnotes to indicate where caution should be exercised when using certain statistics. Most respondents to the user survey were also satisfied with the accuracy of the data (118/125; 94%).
Evaluation findings also show that the CCJS has an effective work-in-progress (WIP) review process for the Liaison Officers Committee of the National Justice Statistics Initiative (LOCNJSI) that allows stakeholders to review Juristat articles prior to release for accuracy, coherence and interpretability.
3.2 Timeliness
Summary
Although most of the CCJS's products are timely, there is a desire among data users to have more up-to-date information for making policy and program decisions. However, there is also recognition that timeliness is related at least in part to the administrative nature of the data. The release of information in a timely manner is dependent on the timeliness of the inputs received from jurisdictions and data providers who do not all have the same capabilities.
The timeliness of statistical information refers to the delay between the reference point (or the end of the reference period) to which the information pertains, and the date on which the information becomes available. It is typically involved in a trade-off against accuracy. The timeliness of information will influence its relevance.
Most CCJS products were released as scheduled. Of the 90 products released by the CCJS over the fiscal years 2011/2012 to 2015/2016, most products (80/90; 89%) met the release dates established by the program. Those that did not meet the pre-established release dates were related to policing surveys (5), courts (2), corrections (1), and GSS analysis (2). Of the releases that did not meet the program-established release dates, most (8/10) were released in 2011/2012 or 2012/2013, demonstrating an increase in the rate of meeting established release dates in more recent years.
Results from key informants interviewed and respondents to the user survey regarding timeliness were mixed. Respondents to the user survey were largely satisfied with the timeliness of the data (105/141; 74%). However, only a minority of key informants interviewed were satisfied with the timeliness of the CCJS information.
Overall, key informants want the CCJS data in a more timely manner. Jurisdictions desire the most up-to-date information possible to make appropriate decisions on programs and policy and to respond to immediate issues in the media.
"The standard today is almost having things in real time. When you are thinking about something that's over one fiscal year old and if people want to make decisions, if they didn't have their own data they're trying to evaluate programs or use that data to inform decision making, it's a bit behind."
Some key informants also connected the timeliness of data to the relevance of data. It was noted that the data released, particularly in the area of courts and corrections, reflected trends occurring up to a year ago, or more. A few of these key informants reported that data that were over six months to a year old were less relevant for making policy and program decisions and planning.
It was also mentioned that timeliness may be contingent on certain survey cycles (e.g., the GSS on Victimization, which is conducted only every five years). There is also an interest at the international level in Canada releasing victimization information more frequently. For instance, some countries study victimization on a shorter time frame (yearly or every two years).Footnote 31
Unlike the UCR Survey, the GSS on Victimization collects data on criminal incidents whether or not they have been brought to the attention of the police. This survey is the only national survey of self-reported victimization and is collected in all provinces and territories. It allows for estimates of the numbers and characteristics of victims and criminal incidents. As not all crimes are reported to the police, the survey provides an important complement to officially recorded crime rates. It measures both crime incidents that come to the attention of the police and those that are unreported. It also helps with understanding the reasons behind whether or not people report a crime to the police.Footnote 32
Challenges to timeliness
"I can complain about timeliness, but I also know that my own jurisdiction is late in providing their data to CCJS. I feel they do as good a job as they can, but I would love to see things come out more quickly. We want it faster but we understand why we can't have it faster most of the time."
Key informants spoke about the issues contributing to challenges with timeliness. A few attributed these to the jurisdictions providing data, while others mentioned that it takes time to properly aggregate and analyze data from across the country. It was also recognized that timeliness may be tied to the slow pace at which the justice system operates, which makes it difficult to stay on top of immediate or emerging issues.
Internal key informants also acknowledged that the release of information in a timely manner is dependent on the timeliness of the inputs received from jurisdictions. They noted that some jurisdictions may not be able to respond as quickly as needed. This may be due to conflicting priorities, the fact that not all jurisdictions have adequate systems in place (e.g., technology) to provide timely information, or a lack of financial resources. It was noted that, previously, there had been funding to help jurisdictions develop capabilities, but that such funding is no longer available.
There is a heavy reliance in the CCJS on data providers, and, in that context, data collection is mostly out of the statistical agency's control. Receiving data on time is critical for key releases. This can have an impact on relevance, since the data may be well out of date by the time they are released.
"Their timeliness is based on other jurisdictions responding. I'm not saying that they are slow, but how the information is gathered is slow, and I'm not sure they can do anything about that. I think CCJS should be an advocate for that kind of stuff (i.e. creating a universal platform for sharing data) and explain why it would be beneficial to Canadians."
The timeliness issue aligns well with the literature on the use of administrative data and their limitations. It indicates that many factors during the process of collection can hinder a provider from making the data available in a timely manner. They can be classified in three categories, as depicted in Figure 1: the financial aspect (funds), the human aspect (training and knowledge) and the political aspect (willingness of jurisdictions). Solutions to enhance timeliness rely on a good understanding of the elements at play: actors (effectiveness and buy-in), the system in place (only as fast as the slowest provider) and the data themselves (completeness, amount and policies in place).Footnote 33
Figure 1 Factors contributing to data delays
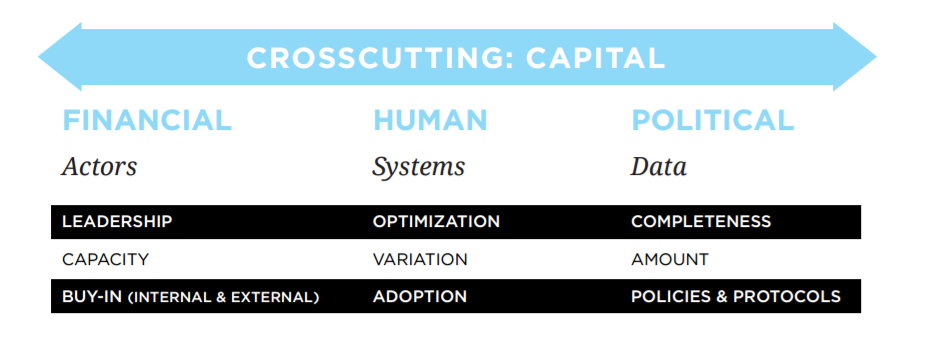
Source: National Association for Public Health Statistics and Information Systems (NAPHSIS), 2013.
Description: Figure 1 Factors contributing to data delays
This figure depicts the categories of factors which contribute to data delays:
- The first category "financial" is identified in the left hand column
- in the first category: financial, "actors" are considered the main contributor to delay with leadership, capacity and buy-in of external and internal actors as being key in explaining delay
- The second category "human" is idenfied in the centre column
- in the second category: human, "systems" are considered the main contributor to delay with optimization, variation and adoption as being key in explaining delay
- The third category "political" is identified in the right hand column
- in the third category: political, "data" are considered the main contributor to delay with completeness, amount and policies and protocols as being key in explaining delay
The figure also identifies a factor which is common to all three categories: "capital": this factor is depicted above the three columns.
Despite these challenges with timeliness, key informants appreciated that the CCJS is upfront about why proposed deadlines are not possible and reported that when the CCJS commits to providing data, the organization respects this commitment.
3.3 Accessibility
Summary
CCJS products are generally accessible. However, some suggestions were made for improvement, particularly related to the accessibility of products on the website, notifications of releases, and the accessibility to data for research and analysis (e.g., through RDCs).
The CCJS produces and disseminates close to 120 CANSIM data tables annually and releases related products, such as Daily releases, summary tables, publications, and information for analysts and researchers, to promote and facilitate access to crime and justice information. The CCJS also prepares custom data on a cost-recovery basis for various clients, including government departments, NGOs, academia and the media.
The accessibility of statistical information refers to the ease with which it can be obtained from the agency. This includes the ease with which the existence of information can be ascertained, as well as the suitability of the form or medium through which the information can be accessed. The cost of the information may also be an aspect of accessibility for some users.
A client service email and phone number are set up to respond to public enquiries on data availability and access, and on data concepts, definitions and usage. Furthermore, the CCJS provides opportunities for work-in-progress reviews and data validation of CCJS analytical products to NJSI partners. Access to pre-release information is given via the agency's Electronic File Transfer Service.
Statistics on access (i.e., visiting the website, viewing products, and downloading and accessing data) show that there is interest in CCJS statistical products (see Table 2, below). Between 2012/2013 and 2015/2016, crime and justice statistics pages (CANSIM tables, publications and summary tables) were viewed 4.7 million times, compared with 64.8 million page views for Statistics Canada as a whole. Juristat was by far the most popular publication, representing 78% of all CCJS publication page views and 9% of all Statistics Canada publication page views for the 2012/2013-to-2015/2016 period.
| Fiscal year | CANSIM | Publications | Summary tables | Total | ||||
|---|---|---|---|---|---|---|---|---|
| CCJS | STC | CCJS | STC | CCJS | STC | CCJS | STC | |
| Source: Statistics Canada, administrative database Webtrends. | ||||||||
| 2012/2013 | 38,302 | 2,064,332 | 854,842 | 8,039,339 | 140,198 | 4,841,279 | 1,033,342 | 14,944,950 |
| 2013/2014 | 73,570 | 2,674,085 | 1,074,008 | 8,828,800 | 158,617 | 6,133,670 | 1,306,195 | 17,636,555 |
| 2014/2015 | 46,876 | 2,003,137 | 975,079 | 8,284,146 | 174,004 | 5,655,093 | 1,195,959 | 15,942,376 |
| 2015/2016 | 42,533 | 1,982,879 | 989,258 | 8,777,626 | 178,427 | 5,500,363 | 1,210,218 | 16,260,868 |
| Total | 201,281 | 8,724,433 | 3,893,187 | 33,929,911 | 651,246 | 22,130,405 | 4,745,714 | 64,784,749 |
Over the same period, the number of downloads of CANSIM tables and publications for the CCJS and Statistics Canada totalled 0.871 million and 13.6 million, respectively. Of the various publications, Juristat was the most downloaded, followed by Family Violence in Canada: A Statistical Profile, the Crime and Justice Research Paper Series, and the Canadian Centre for Justice Statistics Profile Series.
Almost all key informants agreed that CCJS information is functional, innovative and user-friendly. Some key informants specified that CANSIM tables and Juristat are helpful and easy to use, that the products are available in multiple formats (e.g., HTML, PDF and Excel), that CANSIM tables can be customized to address many different questions, and that email notifications were useful for providing information about new material uploaded to the website.
The user survey confirmed the generally high level of satisfaction with most methods of accessing CCJS products. The majority of survey respondents (88% or more) were satisfied with access to common sources of CCJS information on the website, such as The Daily, CANSIM tables, publications and reference documents, as well as the ease of retrieval from electronic sources and the convenience of output formats.
Only a minority of the 156 survey respondents reported that they had accessed data through other means, such as public use microdata files (PUMFs) (n=32), research data centres (RDCs) (n=37), Real Time Remote Access (RTRA) (n=10), or the Data Liberation Initiative (n=4). Among survey respondents who had accessed CCJS information through these means, satisfaction was generally high (70% or more).
Customized information and support services
From 2011/2012 to 2015/2016, a total of 282 contracts for customized products were delivered on, for total revenue of $9,198,325.
Federal government departments and agencies represented almost half of the custom data users (49%), followed by postsecondary institutions (30%) and provincial governments (8%). The remaining custom data users included municipal governments (3%); the media (3%); and other users, such as non-governmental organizations, the private sector and private individuals (7%).Footnote 34
Survey respondents generally reported that they were satisfied with the accessibility of custom data tabulations that had been adapted to their needs (74/84; 88%). Among the survey respondents who had contacted Statistics Canada for additional services (e.g., customized data, support or training), 35% (25/71) paid for the services. Among those who paid for the services, most were satisfied with the services received (24/25; 96%).
Some of the external key informants also reported that they had contacted the CCJS for additional services, support, or customized data tabulations or analysis. All reported that they were satisfied with the services provided, although a few mentioned that it had taken a long time to fulfill the request for customized information.
Comparison with other data providers
"The statistical information generated by CCJS is accessible and user friendly compared to other data providers."
About half of key informants did not have experience with other data providers, suggesting that CCJS data are a key source of justice-related information. Among the remaining key informants interviewed, most reported that dissemination and access were very good, and that the CCJS was a source of advanced national data with cross-jurisdictional information that was accessible to the public free of charge.
However, it was also noted that it was necessary to rely on provincial and territorial information for jurisdiction-specific information because the CCJS does not collect that level of detail.
A few key informants mentioned that other international jurisdictions, such as Australia, the United Kingdom, the United States and New Zealand, provide more user-friendly access to online information and effectively use data visualization techniques.
Challenges to accessibility
Some external key informants reported challenges with the accessibility of CCJS information, such as difficulty finding information or products (such as Juristat) on the website. A few key informants also specifically mentioned having difficulties using the search function on the Statistics Canada website, or downloading and using online CANSIM tables. Most respondents also provided suggestions to improve dissemination.
- Website: Suggestions were related to improving the search feature to increase the findability of information and to provide more information on the website about the types of data that are available.
- Notification and communication: Key informants suggested more communication about CCJS products. Specifically, it was suggested that the CCJS raise awareness of its data products, possibly through social media or by using push notifications. Although the CCJS has a notification service, it appears that not all key informants are aware of, or have access to, this service.
- Products: Improvements to CCJS products were suggested, including more effective use of visual representations of data, more timely release of court data and a more user-friendly design for CANSIM tables.
- Data-sharing mechanisms: Suggestions were made to improve the accessibility of data through RDCs. They included
- increasing access to some types of data not currently available to researchers (e.g., certain details within the UCR Survey data)
- promoting knowledge about CCJS products in RDCs (e.g., by providing information about RDCs at conferences)
- improving access to RDCs through initiatives such as implementing RDCs within each provincial government
- promoting use of a common information technology platform within all jurisdictions.
Internal key informants reported that researchers are notified of CCJS data in the RDCs through notifications sent to distribution lists at local universities, although it was unclear to what degree that information was communicated to faculty and students from there. Information on RDC data is also promoted through the Canadian Research Data Centres Network (CRDCN), through information posted on its website and during annual CRDCN conferences. Key informants acknowledged that improvements could be made to reach more academics and increase awareness of RDC information. It was also noted that researchers had expressed interest in having access to more information through RDCs, such as more geographic information available in CCJS RDC files, information on trends over time and record linkages that would provide the capacity to study recidivism outcomes.
Initiatives to improve accessibility
To further increase the access to and in-depth analyses of justice data by the academic community, the CCJS piloted several surveys through the RDC Program, an initiative by Statistics Canada, the Social Sciences and Humanities Research Council, and university consortia to help strengthen Canada's social research capacity and to support the policy research community.
Surveys available in the RDCs (as of March 2017)Footnote 35 include the following:
- UCR Survey: An update to the RDC data for the UCR Survey in January 2017 includes data up until 2015.
- UCR Survey Hate Crime Module: The hate crime module data are available through a pilot project from 2015 to 2017. To date, only one research proposal has been received and approved for access.
- Homicide Survey: The one-year pilot for the Homicide Survey was intended to end on March 31, 2015. However, there was less research activity than anticipated from the five approved research projects. The pilot was extended to March 2017, and new proposals will be accepted under Phase 2 of the pilot.
- Integrated Criminal Courts Survey: Six years of ICCS data files (2005/2006 to 2011/2012) will be available through an RDC pilot project.
Furthermore, some CCJS data are available through the Real Time Remote Access (RTRA) tool, including the UCR and Homicide surveys. The RTRA allows academic, federal, provincial and territorial researchers to securely work with microdata remotely from their desktops while preserving the security of confidential information.
3.4 Coherence
Summary
CCJS program information is coherent. The CCJS is involved in several activities and working groups to maintain and enhance coherence of CCJS statistical information.
Statistics Canada is tasked with leading the national statistical system, and working collaboratively with other federal departments and other levels of government to avoid duplication of effort and to promote coherence of statistical information.Footnote 36
The coherence of statistical information reflects the degree to which it can be successfully brought together with other statistical information within a broad analytic framework and over time. The use of standard concepts, classifications and target populations promotes coherence, as does the use of common methodology across surveys. Coherence does not necessarily imply full numerical consistency.
Coherence:
CCJS "...gets high marks in this area."
Most key informants indicated that they were satisfied with the coherence of CCJS statistical information. They reported that the CCJS effectively applied common methodologies to the data, which allowed for comparability and the clear identification of methodological changes. A few other key informants mentioned that coherence has been improving over time. Satisfaction with data coherence was also high among respondents to the user survey (120/127; 94%).
Coherence:
"It is something that they achieve excellence in, as a matter of fact, which is why I am so complimentary of them as opposed to other organizations."
The CCJS is involved in several activities and working groups to maintain and enhance coherence of CCJS statistical information. In 2014, the CCJS established an internal Data Quality Secretariat to ensure high data quality, as a result of the high volume of products released by the CCJS and the increasing demand for detailed information from stakeholders. The objective of the secretariat is to identify any data quality vulnerabilities (including coherence) of existing surveys, develop action steps to address any risks, and identify best practices.Footnote 37
The CCJS also has a work-in-progress review process for the Liaison Officers Committee of the National Justice Statistics Initiative (LOCNJSI), which allows the stakeholders to review Juristat articles for accuracy, coherence and interpretability.
The CCJS is also engaged in other initiatives with NJSI partners to improve data quality and coherence, such asFootnote 38
- Police performance metrics: In partnership with Public Safety Canada, the CCJS is leading the development of a national framework around police performance metrics.
- UCR Survey data quality and comparability: The CCJS supported the work of the POLIS Working Group on Data Quality to identify areas of over-scoring, and led the work of POLIS's Organized Crime Working Group aimed at improving quality of reporting on the UCR organized crime flag.
3.5 Interpretability
Summary
CCJS stakeholders and users are satisfied with the interpretability of CCJS data. There are no major deficiencies in CCJS metadata, although CCJS metadata had a higher percentage of minor deficiencies than Statistics Canada metadata overall.
The document and literature review showed that CCJS statistical information is complex, robust and relevant and that program information is available to assist users in interpreting the data. CCJS products meet the requirements of the Policy on Informing Users of Data Quality and Methodology, and are documented within Statistics Canada's Integrated Metadatabase.
The interpretability of statistical information reflects the availability of the supplementary information and metadata necessary to interpret and utilize it appropriately. This information normally includes the underlying concepts, variables and classifications used; the methodology of data collection and processing; and indications or measures of the accuracy of the statistical information.
For CCJS statistical products, the user can find descriptions of data sources and methodology, definitions of the concepts and variables that are measured, and indicators of data quality. The information on the status, frequency, record number, data release, reference period, collection period and subjects covered by the CCJS is generally up to date and accessible.
Interpretability:
"This is good. Lots of footnotes in order to guide you. Have cautions on how to use information. Carefully explained and definitions are there."
The administrative data review indicated that the metadata were generally up to date. In 2015, most CCJS metadata were fully compliant or had only minor deficiencies (see Table 3). However, the relative percentage of minor deficiencies was higher for the CCJS (69%) than the average across Statistics Canada overall (20%). Two of the CCJS surveys also had medium deficiencies in 2015: the Youth Court Survey and the Homicide Survey.
| Analysis of metadata | CCJS | Statistics Canada | ||
|---|---|---|---|---|
| number | % | number | % | |
| Source: Administrative data analysis. | ||||
| Fully compliant | 2 | 15 | 302 | 78 |
| Minor deficiencies | 9 | 69 | 79 | 20 |
| Medium deficiencies | 2 | 15 | 4 | 1 |
| Major deficiencies | 0 | 0 | 5 | 1 |
| Total | 13 | 100 | 390 | 100 |
The majority of survey respondents were satisfied with the interpretability of the data (122/138; 88%). Most key informants also indicated that they were satisfied with the interpretability of CCJS statistical information. They reported that information regarding definitions and explanations was available through various sources on the website, such as data dictionaries, and footnotes in CCJS documents. A few key informants commented that if they could not find an explanation or definition within a publication, they were able to find that information on the Statistics Canada website or by calling the CCJS's staff. However, some also commented that they were not sure whether the general public would find the material equally interpretable.
3.6 RelevanceFootnote 39
Summary
The CCJS program provides justice information to address current and evolving needs for crime and justice statistics. Although continued efforts are made to meet stakeholders' information needs, some information gaps still exist and emerging needs were identified. The CCJS responds to the needs of the federal, provincial and territorial governments through an effective consultation process, although some stakeholders identified a need for better communication, primarily related to survey methodologies or processes.
The relevance of statistical information reflects the degree to which it meets the real needs of clients. It is concerned with whether the available information sheds light on the issues that are important to users. Assessing relevance is subjective and depends upon the varying needs of users. The agency's challenge is to weigh and balance the conflicting needs of current and potential users to produce a program that goes as far as possible in satisfying the most important needs within given resource constraints.
Engagement and consultation process
The CCJS responds to the needs of federal, provincial and territorial governments through an effective consultation process, which is supported by a clear governance structure, including several committees and working groups. Some improvement would be required, such as involving other groups during consultations.
Some key informants—when asked about the extent to which CCJS justice statistics met current and emerging needs—responded by sharing positive observations about how the CCJS consults with jurisdictions to understand data needs, the CCJS's flexibility and active role in identifying and addressing data gaps, and the chance to review CCJS material prior to its being published. Internal interviewees also highlighted that the CCJS governance model is considered within Statistics Canada one of the best and should be applied to other programs.
Through the collaborative work between NJSI partners and the CCJS, needs and opportunities are better identified so that the stakeholders have access to the data they need, in a form that facilitates their effective use. Consultation roadmaps and operational plans are developed to set the priorities and initiatives to ensure the relevance of the program.
Key informants who referred to collaborative and consultative aspects of their partnership with the CCJS frequently referred to the formal governance structure, such as roles in specific committees (e.g., POLIS), subcommittees (e.g., CORIS) or working groups, and the role of liaison officers in connecting ministries with the CCJS. The consultative aspects of these collaborative relationships include sharing advice, developing analytical measures and approaches to ensure consistent reporting, voting on the selection of specialized studies, and having jurisdictions agree to pilot methodologies or identify alternative analytical approaches.
"I pretty much know every member of the CCJS team … We are constantly communicating. They're always helpful, they always get back to me when I have a question. No question is ever silly."
Key informants reported that the CCJS supports effective collaboration by building strong relationships and being inclusive, helpful and responsive. For example, the CCJS assists provincial and territorial jurisdictions in understanding changes to data collection, provides the opportunity (if applicable) to contribute to new pilot projects, provides information to better understand CCJS datasets or jurisdictional data quality issues, and provides opportunities to suggest possible research areas for further investigation.
Some key informants referred to the establishment of processes that promote collaboration between the CCJS and jurisdictional partners, such as the use of committees to communicate with the CCJS about various issues (e.g., types of information available, potential to customize a data product). A few national-jurisdiction key informants referred to the successful use of "deemed employees" from Justice Canada who were assigned to the CCJS (via an MOU). This arrangement was praised because it allowed the Justice Canada personnel to learn more about what data are available through the CCJS, while providing CCJS staff with additional resources and expertise in the criminal justice system.
Although most key informants spoke positively about the collaboration between the CCJS and their organization, they also identified some challenges or issues related to collaboration:
- Communication: The need for improved communications between the CCJS and partner jurisdictions was raised. Some key informants reported requiring more consultation to improve survey responses and methodologies in their jurisdiction, more time to review and consult on materials, more communication with senior-level provincial and territorial staff (e.g., deputy ministers), or more alignment between provincial and federal processes to ensure that deadlines are coordinated. A few key informants also desired more frequent communications via teleconference between the biannual face-to-face meetings. This approach would help reduce the demand to "address issues all at once" during the biannual meetings.
- Provincial and territorial resource limitations: Limited resources among provincial and territorial data providers are a challenge that affects collaboration. This includes limited human and budget resources, information technology, and statistical expertise to implement the changes needed to provide data to the CCJS.
- Liaison Officers Committee (LOC): More senior-level staff, specifically those who report directly to deputy ministers, should be involved in the LOC to better articulate deputy ministers' priorities to the CCJS. A few key informants also noted that the LOC would benefit from having a representative from Correctional Service Canada (CSC).Footnote 40
Key informants also suggested the possibility of engaging with a broader range of stakeholders, either through formal engagement in NJSI governance or through general consultation on issues of interest to the CCJS.
- Some external key informants suggested more inclusion of family/civil justice representatives on the LOCNJSI. A few key informants supported the idea of involving academics from a variety of fields, including criminology, sociology and psychology, or others specializing in criminal justice issues.
- Other external key informants supported the idea of engaging in consultations with a broader range of stakeholders outside the governance model, such as think tanks, municipalities, academia, non-governmental or community organizations, and local statistics organizations. Specifically, a few key informants believed it was too early for these groups to be included in governance, but suggested that there might be beneficial aspects to consulting these groups about issues of interest and the use of CCJS data, and providing assistance in the use of the data.
- Some internal interviewees also suggested that the involvement of some groups, such as academics, should be encouraged. Extensive consultation through RDCs and pilot projects, where academics could provide their advice on quality control, was suggested.
Responsiveness to stakeholders' current and emerging needs
Overall, the CCJS is fulfilling jurisdictional needs and priorities for crime and justice statistics, although some gaps were identified. The results of the user survey indicate that 49% of respondents (71 out of 144) believed that the CCJS completely or to a great extent covers the issues of most importance, while 47% (68 out of 144) indicated it does so to some extent.
Key informants noted that CCJS data play a key role in developing policies, planning for programs and services, understanding how provinces and territories compare with each other and nationally in terms of crime statistics and trends (for research and performance measurement purposes), conducting research for internal or external briefings, and fulfilling government needs to keep the public informed on justice issues.
The majority of respondents to the user survey believed that justice statistical information responds to emerging trends, with 20% (18/90) of survey respondents indicating that it responds completely or to a great extent, and 64% (58/90) indicating that it responds to some extent.
Key informants identified several gaps in current or emerging information needs:
- Data linking and relationships: Some key informants would like more linking or connectivity between criminal and family/civil justice datasets (including police, courts and corrections) to understand how people are flowing through the justice system. Additionally, these key informants believed that linking justice data to non-justice datasets—such as health or hospital data—would enable studies of the interaction between social issues and justice system involvement, and outcomes for individuals.
- Costing and justice system resources: Some key informants wanted more data on justice system costs, which would allow jurisdictions to better understand the financial cost of an individual going through the various components of the justice system. This could include costs of police activities, resources, expenditures and personnel for the Crown prosecutor service, such as the information previously collected through the Courts Resources, Expenditures and Personnel Survey, or downstream costs related to maintenance enforcement. Justice system spending was also identified as an emerging issue by survey respondents.
- Police data: Some key informants reported that there are gaps in data on police because certain police activities (e.g., calls for service that do not involve criminal charges) are not tracked through the Uniform Crime Reporting (UCR) Survey, even though these types of calls for service may represent the majority of police activity. As a result, there is a lack of data on police early intervention activities and an underreporting of police workloads. Respondents also wanted more information on CCJS national data by police jurisdiction (e.g., municipal or provincial police or RCMP), information on the outcomes of police diversion/cautioning activities, and national Crown counsel data on police charges received and charges approved.
- Better data from courts: Some key informants expressed a desire for improved data from various types and levels of courts, including mental health courts, domestic violence courts, drug treatment courts, civil courts and superior courts.
A few respondents also reported gaps in the following areas:
- Civil/family law: Key informants mentioned themes related to maintenance enforcement, custodial outcomes for children and self-represented litigants.
- Organized crime: A few key informants indicated that there is a gap in data for organized crime, which is described as complex and multilayered.
- Victimization: Victimization data should be available more frequently (other than the current five-year cycle), and more information should be available for smaller geographic areas and for vulnerable populations, such as Aboriginal communities.
- Aboriginal representation in the justice system: Aboriginal identity is not available in CCJS data, although the CCJS is working with partners to resolve these gaps. These data are needed to better understand the issue of overrepresentation in the justice system; to support research being undertaken by Justice Canada; and, more generally, to support the mandate of the current federal government.
- Release (bail) and remand: A few key informants reported that there is a lack of data on bail, remand and release to better understand trends in admission, length of time spent in remand, turnover rates and conditions imposed on bail.
A few other key informants identified gaps in information on cybercrime (fraud, victimization and underreporting), legal representation (use of legal aid, counsel or self-representation) and youth justice, and the need for an improved corrections survey and increased analytical capacity for corrections data. Some survey respondents also reported emerging needs related to data on crimes and offences as well as better information on demographic, geographic and social trends. In fact, 38% (51/135) of respondents to the user survey also reported dissatisfaction with the level of disaggregation of observations.
Evidence from the document review shows that stakeholders consulted a number of justice-related data and research topics they considered important through the Justice Information Roadmap (JIR) 2015Footnote 41 processes, with the most commonly mentioned including justice-related information on mental health, re-contact with the justice system, and family violence and victimization.
Canadian Centre for Justice Statistics initiatives to enhance data relevance
The CCJS has been taking action to fill some data gaps. The following emerging issues were considered in planning CCJS operations for 2014/2015 and 2015/2016:
- changes to legislation (Criminal Code updates)
- Canadian Association of Chiefs of Police (CACP) resolution to conduct data quality audits with police services
- economics of policing (including cost of services)
- access to justice
- data gaps (e.g., mental health, re-contact with the justice system).
Further, the CCJS is working on the following initiatives:
- Collaborative work has been underway on a pilot police performance metrics project. In 2015/2016, a feasibility study was launched to examine opportunities and challenges in collecting national-level data on calls for service.
- To understand the extent of the re-contact of individuals with the Canadian criminal justice system and their pathways through it, the CCJS is analyzing administrative data from police, courts and corrections facilities, and will be integrating these data with other sources under the Social Data Linkage Environment to help evaluate the sociodemographic characteristics of people who come into contact with the justice system. In 2016/2017, the agency will study new jurisdictions and will produce a set of standardized indicators and products on the topic of re-contact by 2017/2018.
- The CCJS launched a pilot project whereby participating police services focused on the quality of the organized crime data for a select number of UCR Survey violations. The goal of the pilot was to identify obstacles in processes or systems to increase data quality and to identify best practices in data reporting. As a result of that pilot project and subsequent consultations with selected police services, a number of best practices were identified for collecting and verifying police service data on organized crime. Recommendations were proposed to enhance data quality, such as raising the priority of collecting organized crime data, performing ongoing quality control, and identifying dedicated personnel with appropriate access to be responsible for incident reporting on an ongoing basis. Recommendations were endorsed by the Canadian Association of Chiefs of Police Board of Directors in 2016.Footnote 42
- Over the course of the next two years, the agency will be redesigning various justice-related surveys to improve their relevance and to meet new priorities in the area of policing and the administration of justice (the Integrated Criminal Court Survey, the Uniform Crime Reporting Survey, the Police Administration Survey, the Homicide Survey, the Transition Home Survey, the Integrated Correctional Services Survey, and the Legal Aid Survey).Footnote 43
Some key informants also indicated that the CCJS is fulfilling emerging needs by being innovative; exploring ways to improve data on specific justice issues, such as organized crime, calls for police service (non-criminal), and Aboriginal victims and offenders; and developing a better understanding of the relationships between mental health, addiction and substance abuse, and the criminal justice system. A few informants specifically praised the re-contact study in Saskatchewan for linking police, court and corrections data to better understand the nature, prevalence and frequency of re-contact among a cohort of individuals in this province.
3.7 Use of the statistical information
Summary
The evaluation found that justice statistical information is used by a range of departments and organizations, including federal, provincial, territorial and municipal governments; private non-profit organizations; and other private organizations, particularly the media. Organizations use this information primarily for research and policy analysis or development, but also for various purposes related to planning, management, or other internal or external analytical or reporting functions. A review of links to CCJS publications on the Web and citations in peer-reviewed scientific literature indicates that the most commonly used CCJS products are publications, particularly Juristat.
The evaluation explored the extent to which CCJS data are being used to inform debate, research and analysis, as well as decision making. The scope of issues covered by the program, combined with the fact that this information is readily available, free of charge, from the Statistics Canada website, creates numerous possibilities for data use. Consequently, while the evaluation findings shed some light on this matter, it is beyond the scope of this evaluation to capture the full range of potential uses of statistical information.
Who uses Canadian Centre for Justice Statistics program data, for what purpose, and how?
Based on the review of Statistics Canada's administrative databases, program documents and literature, the bibliometric and webometric assessments, surveys and interviews results, the evaluation identified a variety of uses and users in various areas of activity from the public and private sectors.
Findings suggest that the primary users of information produced by the CCJS are the Department of Justice and Public Safety Canada, together with provincial and territorial jurisdictions for policing, courts and corrections. These users draw on the information to draft legislation and to develop policies, programs and services for Canadians in the areas of justice and public safety, as well as to prepare statistical reports such as the Trafficking in Persons annual report. Other key federal departments include Status of Women (particularly on issues related to victimization) and Immigration, Refugees and Citizenship Canada (on issues related to hate crime).Footnote 44
Results of a webometric analysis of links to CCJS products also suggest that CCJS information is used by the private non-profit and private sectors, including media organizations, and some international organizations such as the Virtual Knowledge Centre to End Violence Against Women and Girls (a program of the United Nations Entity for Gender Equality and the Empowerment of Women), as well as the Organization for Security and Co-operation in Europe. According to the results of the interviews and a survey of users, justice data sources are used for a variety of purposes, including conducting research and policy analysis, informing program and service delivery, performing jurisdictional comparisons and understanding national trends, producing internal publications, and responding to media questions.
Research and policy analysis or development
Results from the user survey indicate that the most common uses of CCJS information include research (79%) and policy analysis or development (49%). Key informants interviewed for the evaluation reported using CCJS data to inform policy decisions, primarily as evidence for new or changed policy agendas, but also to determine whether there is a need to re-examine policy. For example, key informants mentioned using the data to support decisions in their business or action plans about what areas to target, to identify needs and gaps in policies, or to provide context for policy discussions.
Some key informants noted that they use CCJS data for jurisdictional comparisons. They reported using CCJS data to understand national trends and where their jurisdiction stands in relation to other jurisdictions over time. Key informants most often raised the importance of understanding trends in Criminal Code and Highway Safety Act violations. Academic key informants reported using CCJS data in their research to explore impacts of policy changes on crime rates and victimization.
Planning, management, reporting or evaluation
Results from the user survey indicate that about one-third of respondents used the information for planning, management or reporting (38%), or program or service planning, development or evaluation (33%). Some key informants mentioned their use of CCJS data to inform program or service delivery. They reported that CCJS data provide them with trends over time or comparisons with other jurisdictions that can provide contextual information to support program development and implementation. They mentioned using CCJS data to provide context for the evaluation of programs, to assist with planning, and to identify needs and gaps in programs and services.
Other uses
Users of CCJS data also mentioned using the data for education (28%), general interest (24%), modelling or forecasting (21%), or legislative requirements (12%). Some key informants stated they used CCJS data for internal documents, such as research briefs or briefing notes, as well as for publicly accessible information, such as fact sheets or presentations. Some key informants reported using CCJS data to respond to questions from the media, the public, other departments or officials within their own department.
World Wide Web
The private non-profit sector and private sector (including the media) are the main Canadian disseminators of CCJS products on the Web
The visibility of CCJS information on the Web was explored as part of the evaluation through a webometric assessment of uptake (hyperlinks to CCJS products).Footnote 45 The webometric analysis included an examination of web structure, which means clickable hyperlinks, as commonly found on all pages on the Internet. These links provide pathways for navigating around the Internet, and assessing these pathways can determine which organizations, sectors and countries, among others, feel that CCJS products are relevant enough to their work that providing a clickable link to a product would be of value to the users of their website. In this way, web structure analysis provides one facet of the total profile of the online uptake of CCJS documents. Websites hyperlinking to a document can increase its dissemination among readers; hence, organizations that link to Statistics Canada documents are referred to as "diffusers."
The analysis of diffusers on the Web indicates that links to CCJS products come most often from the private non-profit (PNP) sector, which accounts for 39% of all links to CCJS releases (730 links). The private sector follows next at 27%; about half of those links come from the news media (239 links, including blogs that focus specifically on releasing and discussing news). The public sector is next at around 20% of the total links, with about two-thirds coming from the federal level and the remaining third coming from the provincial level. Finally, approximately 6% of links come from the academic sector. A close look at the top PNP organizations that disseminate CCJS information indicates that they are dedicated to research, knowledge exchange and advocacy on justice-related themes (drugs, justice reform, etc.).
Publications are the most-used CCJS products on the Web, and Juristat and Policing Services Program outputs are the most cited
On the Web, the document types receiving the most links (by far) are publications, followed distantly by Daily releases. CANSIM tables and surveys received comparatively far fewer links, and summary tables from the CCJS did not receive any links (see Table 4). Looking at publications (i.e., releases filed under a catalogue number), it is clear that Juristat plays a central role in the portfolio of the CCJS. This publication received over 73% of all links to CCJS publications, and 64% of all links to CCJS releases in total across document types. Family Violence in Canada: A Statistical Profile was the next most frequently linked, with about 10% of the links to CCJS publications.
Juristat provides in-depth analysis and detailed statistics on a variety of topics and issues related to justice and public safety. Topics include crime; victimization; homicide; civil, family and criminal courts; and correctional services. Issues related to community safety and perceptions of safety are also covered. The publication is intended for readers with an interest in Canada's justice and public safety systems as well as those who plan, establish, administer and evaluate programs and projects related to justice and public safety. In addition to the web links for Juristat, many respondents to the user survey indicated that they had previously consulted articles from the publication (109/145; 75%), and an overwhelming majority (95%) reported that they were satisfied with the publication.
Citations in peer-reviewed scientific literature
According to the bibliometric assessment conducted as part of the evaluation, a total of 38,222 citations referring to Statistics Canada in peer-reviewed articles were found between 2000 and 2014, of which 936 (2%) refer to CCJS releases.
References to CCJS releases for the periods from 2000 to 2006 and from 2008 to 2014Footnote 46 grew more than fourfold. However, even this impressive rate of increase is still below the rate of growth for the number of citations to Statistics Canada documents overall (more than fivefold) for the same comparison period.
| CCJS product | Count |
|---|---|
| Source: Bibliometric and Webometric Performance Evaluation for the CCJS, technical report, 2016. | |
| Surveys | |
| Uniform Crime Reporting Survey | 7 |
| Violence Against Women Survey | 4 |
| Transition Home Survey | 4 |
| Other | 8 |
| Surveys total (1.0% of total CCJS products) | 23 |
| CANSIM tables | |
| Civil Court Survey, civil court cases (initiated, active and active with disposition) by level of court and type of case, annual (number), 2005/2006 to 2014/2015 | 13 |
| Civil Court Survey, number of inactive civil court cases, by level of court, type of case and number of fiscal years since case initiation, annual (number), 2006/2007 to 2014/2015 | 13 |
| Incident-based crime statistics, by detailed violations, annual (number), 1998 to 2014 | 8 |
| Other | 29 |
| CANSIM tables total (2.0% of total CCJS products) | 63 |
| Publications | |
| Juristat | 1,787 |
| Family Violence in Canada: A Statistical Profile | 255 |
| Crime and Justice Research Paper Series | 72 |
| Other | 328 |
| Publications total (88.0% of total CCJS products) | 2,442 |
| The Daily | |
| Homicide in Canada, 2014 | 50 |
| Violence against women, 2011 | 41 |
| Youth crime in Canada | 31 |
| Other | 129 |
| The Daily total (9.0% of total CCJS products) | 251 |
| Grand total | 2,779 |
The document types most cited for the CCJS are publications (788, or 84%), surveys (75, or 8%), The Daily (39, or 4%), CANSIM tables (29, or 3%), and summary tables (5, or 1%). The two most cited publications were Family Violence in Canada: A Statistical Profile (45%) and Juristat (30%).
Survey respondents were asked about the contribution of CCJS information to the understanding of justice issues and decision making. Most respondents agreed (131/156; 84%) that the information produced by the CCJS allowed them to better understand population justice trends and issues in Canada (7% disagreed; 9% didn't know). Evidence from the survey also confirmed the contribution of CCJS products to informed decision making; 72% (112/156) of CCJS users surveyed reported that CCJS products helped them make more informed decisions (10% disagreed; 18% didn't know).
Overall, CCJS products are used by a variety of users to meet their needs related to research, policy development, planning and reporting; to facilitate an understanding of justice issues; and to make informed decisions.
4. Findings: Performance—Demonstration of Efficiency and Economy
This section summarizes the assessment of economy and efficiency of the CCJS. The findings are based on the analysis of the program's resource utilization in relation to the production of its outputs and progress toward expected outcomes, and build on qualitative information from document reviews and interviews with program management.
As presented in the evaluation limitations section, the current structure of the financial information—on an operational basis rather than on a project basis—limits the analysis of the impact of issues and initiatives on survey activity costs and the total budget.
Summary
Evaluation findings support evidence that CCJS management remains committed to offering quality crime and justice outputs that meet overall needs and priorities despite financial pressures. Key informants reported additional pressure on human resources due to increased information needs for responding to emerging governmental priorities and the transition to common tools and shared infrastructure.
The CCJS operated during the five-year period with overall program spending of $40.7 million (as presented in Table 5). Expenditures fluctuated during the first three years, with the highest expenditures in 2013/2014 and decreasing expenditures over the last two years, closing at $7.5 million in 2015/2016.
| Expenditures | Fiscal years | Total | ||||
|---|---|---|---|---|---|---|
| 2011/2012 | 2012/2013 | 2013/2014 | 2014/2015 | 2015/2016 | ||
| Source: Statistics Canada, financial system and computed information. | ||||||
| Salary ($) | 5,527,653 | 5,177,883 | 6,460,329 | 6,102,641 | 5,321,653 | 28,590,159 |
| Non-salary ($) | 865,336 | 350,120 | 568,416 | 515,680 | 383,376 | 2,682,928 |
| Employee benefits and pension ($) | 1,105,531 | 1,035,577 | 1,292,066 | 1,220,528 | 1,064,331 | 5,718,033 |
| Accommodation ($) | 718,595 | 673,125 | 839,843 | 793,343 | 691,815 | 3,716,721 |
| Total ($) | 8,217,114 | 7,236,704 | 9,160,654 | 8,632,193 | 7,461,175 | 40,707,839 |
| Full-time equivalents | 72 | 68 | 90 | 77 | 65 | Annual average 74 |
The increase in 2013/2014 coincides with the highest external cost-recovery expenses and largest investment proposals during the period (see Figure 2). The expenditures on external cost recovery represented about 20% or more of annual salary and non-salary expenditures until 2015/2016, when external cost recovery was reduced to 11% of total salary and non-salary expenditures. This was related to reduced cost-recovery funding for two surveys during this period: the Survey of Emergency Preparedness and Resilience, and the sunsetting of the Hate Crime Survey in 2015/2016.
Figure 2 Canadian Centre for Justice Statistics program expenditures from 2011/2012 to 2015/2016
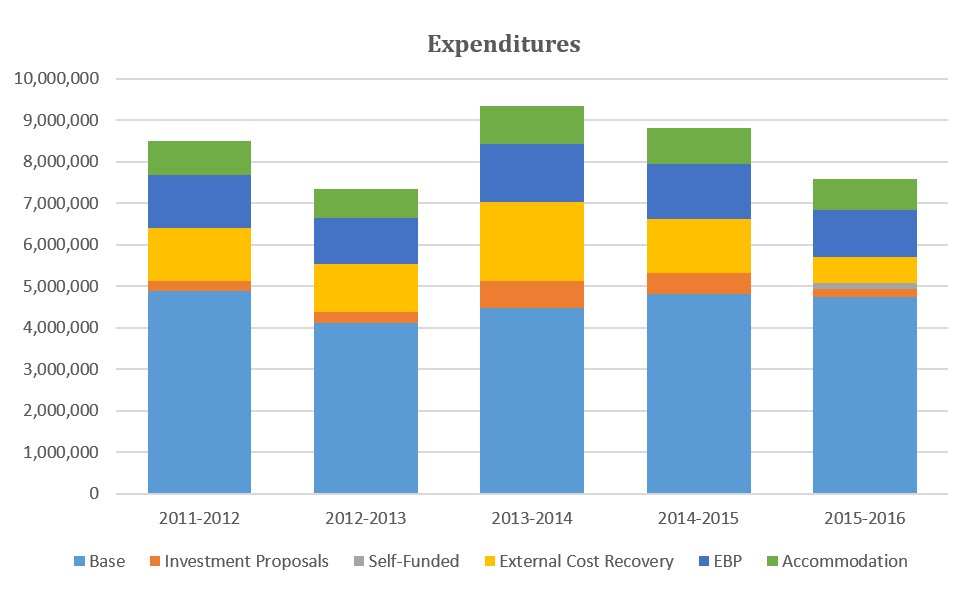
Source: Statistics Canada, financial system and computed information.
Description: Figure 2 Canadian Centre for Justice Statistics program expenditures from 2011/2012 to 2015/2016
| Items - Expenditures | 2011-2012 | 2012-2013 | 2013-2014 | 2014-2015 | 2015-2016 |
|---|---|---|---|---|---|
| Source: Statistics Canada, financial system and computed information. | |||||
| Base budget | 4.9 | 4.1 | 4.5 | 4.8 | 4.7 |
| Investment | 0.25 | 0.25 | 0.63 | 0.5 | 0.2 |
| Self-funded | 0 | 0 | 0 | 0 | 0.2 |
| External Cost Recovery | 1.3 | 1.2 | 2 | 1.3 | 0.6 |
| EBP | 1.3 | 1.1 | 1.4 | 1.3 | 1.1 |
| Accommodation | 0.8 | 0.8 | 0.9 | 0.9 | 0.7 |
| Total | 8.55 | 7.45 | 9.43 | 8.8 | 7.5 |
Financial evidence of the program's funding indicates that utilization of base funding resources in the delivery of the program was higher than originally planned for the last two years (2014/2015 and 2015/2016) of the evaluation period (+7.9% and +8.8%, respectively), but lower than originally planned for the first three years.
"(…) which means that they're stretched to a level that if someone falls sick or something happens, there's going to be some delays in production and they won't be able to be as timely (…) and quality could be at risk."
CCJS program operations required an average of 74 FTEs annually, including subject-matter (CCJS) and service-area personnel (e.g., collection, methodology, information technology, Operations and Integration Division). Salary expenditures represented 70% of all spending. The evaluation found that most staff have a specialized background in criminology or an area related to criminology and have a strong attachment to the subject matter, which is a very specific topic. This expertise facilitates survey processing and contributes to maintaining good relationships with partners.
Results from Table 5 show that the number of CCJS FTEs fell in the last two fiscal years, from 90 in 2013/2014 to 65 in 2015/2016. Internal key informants shared concerns about balancing production and responding to increasing information needs. For example, in addition to undertaking activities related directly to survey analysis and dissemination, the CCJS has other responsibilities and demands for information.
- There is representation by the CCJS on federal–provincial–territorial committees that are specific to certain subject-matter areas like victims or crime. The CCJS is often invited to such committees to provide feedback on emerging issues or to respond to specific information needs.
- As a subject-matter expert, the CCJS is required to provide information to Senate and House of Commons committees on issues related to justice and public safety. Preparation of information for these committees is time-consuming and generally represents additional work outside that normally required to prepare and analyze data necessary to respond to new and emerging information requests.
- The CCJS will provide information for 15 ministerial mandate letter priorities, which represents an additional workload requirement within the context of existing resources.
Despite a reduction in personnel since 2013/2014, the CCJS continues to provide standard data products in addition to responding to ongoing and emerging requests for justice statistics information to meet evolving governmental priorities and information needs.
Streamlining processes
Beginning in 2010/2011, Statistics Canada embarked on the implementation of the Corporate Business Architecture, which included a number of corporate initiatives designed to increase efficiency. The CCJS has undertaken streamlining processes to increase the efficiency of its program, including transitioning to corporate tools, redesigning surveys and centralizing the collection processing. The CCJS has reviewed its internal practices and organizational structures to ensure that its base budget allocation is being used in the most effective and efficient way possible.Footnote 47
The document review revealed that the CCJS program transitioned to Statistics Canada common tools for processing and disseminating data for some of its surveys, including the UCR Survey, Homicide Survey and ICSS. In particular, the CCJS has participated in adjusting the Social Survey Processing Environment (SSPE) to meet the needs of administrative data programs, and will be transitioning its microdata surveys to the SSPE over the coming years.Footnote 48 The program has undertaken the transition of collection and processing activities to the Operations and Integration Division (OID) to improve efficiency and use of the Electronic File Transfer.Footnote 49 The CCJS program has also completed the redesign of the Integrated Correctional Services Survey (ICSS).
Internal key informants acknowledged the increased efficiency of corporate initiatives in general. However, the impact of the transition to common tools and processing activities on program efficiency was perceived to vary depending on the survey characteristics (e.g., administrative data, or smaller surveys with fewer respondents). For example, some described the challenge of moving to a common tool such as the SSPE, which was built for household surveys, to process administrative data. For one of the court surveys, the reduced processing time was cited as a positive point. However, some challenges were also reported in the transition to the OID for collection processing, related to the knowledge of the specific subject matter, the relationship with users, and the small number of respondents for some surveys, which may be impacting the efficiency of this change.
Some internal key informants reported that the transition to electronic questionnaires (EQs) was less efficient for ongoing surveys with only a few respondents—such as the Legal Aid Survey—considering the resources required for the transition. It was noted that there are requests in place to exclude some smaller specialized surveys from the common tool applications due to the fact that the costs may outweigh the benefits.
The division received additional funding for the transition to common tools and for some redesigns, but reported devoting more time to these activities considering the specificity of administrative data and of the subject matter. Key informants experienced challenges in the transition to the centralized collection process, which required staff resources and sometimes created confusion among respondents.
To mitigate these issues, internal key informants reported sharing resources and collaborating, working overtime, and delaying data dissemination. Some additional possibilities for increasing efficiencies were noted through the Justice Information Roadmap (2015) consultations. For example, most partners consulted said they focused on the key findings or highlights of analytical articles in Juristat. The majority agreed that the Juristat Bulletin would be an acceptable format to accompany the release of annual survey results, with the exception of the Uniform Crime Reporting Survey statistics. Juristat Bulletin articles typically contain data tables, highlights and a short analysis of the key findings, and would require fewer resources to prepare and to produce than in-depth analytical articles. The efficiency gained by this approach would free up resources to respond to emerging issues and to pursue special topics.Footnote 50
5. Conclusions and Recommendations
5.1 Conclusions
The evaluation evidence demonstrates a continued need for the program. The program is responsive to the ongoing needs of a wide range of users such as federal departments; provincial, territorial and municipal governments; academic communities; individuals from the general public including the media; and international organizations such as the United Nations, and the Organization for Security and Co-operation in Europe.
The program is also aligned with the Government of Canada's current priorities. The CCJS will provide information to support 15 ministerial mandate letter priorities, including the National Inquiry into Missing and Murdered Indigenous Women and Girls, and a review of the changes in the Canadian criminal justice system and sentencing reforms.Footnote 51 As a subject-matter expert, the CCJS is often called upon by Senate and House of Commons committees to present information on justice and public safety to advance the work of government.
The potential impact of the program is directly correlated with the quality and relevance of the statistical information made available. The evaluation findings confirm that CCJS statistical information is accessible, accurate, interpretable, relevant and released according to established schedules. There is an interest in increasing the accessibility of data for researchers and academics and in receiving data in a more timely fashion for policy and program decisions. However, there is also recognition that timeliness is also related, at least in part, to the administrative nature of the data and the context of reliance on data providers.
The evaluation found that the CCJS is able to provide justice statistical information that meets stakeholders' information needs and priorities. Overall, CCJS data are used by various levels of government to fulfill their mandates and responsibilities; by non-governmental organizations, including the media; and by some international organizations. CCJS data are used for a variety of purposes, including conducting research and policy analysis, informing program and service delivery, performing jurisdictional comparisons and understanding national trends, producing internal publications, and responding to media questions. Among the most commonly used CCJS products are publications, particularly Juristat.
Evaluation findings support evidence that CCJS management remains committed to offering quality crime and justice outputs that meet overall needs and priorities despite decreasing expenditures over the last two fiscal years reviewed (2014/2015 and 2015/2016). Key informants reported additional pressure on human resources due to increased information needs and the transition to common tools and shared infrastructure.
5.2 Recommendations
The evaluation findings demonstrate that CCJS data are generally accurate, coherent, interpretable and used for a variety of purposes by a wide range of stakeholders. Stakeholders expressed a desire for more timely data, which was also perceived to impact on the relevance of CCJS data. Stakeholders also identified several areas of emerging needs related to data linkages and relationships between different datasets, as well as a need to increase accessibility of data for research (e.g., through RDCs).
Recommendation 1:
Performance (timeliness)
While the evaluation found that the CCJS program delivers high-quality statistical data that are generally timely, the relevance of justice statistics could be increased by providing earlier indications of justice information changes or trends to facilitate program and policy decisions.
Recognizing that a complete analysis of justice statistics requires time to produce accurate results and that the production of justice statistical data occurs in a context of shared responsibilities, it is recommended that the CCJS explore with partners the possibility of producing more timely indicators in key selected areas to provide earlier indications of issues and trends.
Recommendation 2:
Performance (accessibility)
Currently, academia is not part of the formal governance of the CCJS program. Researchers are informed about CCJS data in RDCs through notifications from RDCs sent to distribution lists at local universities. It is unclear to what extent that information is communicated effectively to targeted faculty and students. Academic researchers are key CCJS data users whose needs are not fully considered given their limited participation in decision making.
Recognizing the value added of the contribution of researchers to CCJS analytical products, it is recommended that the CCJS program
- establish an appropriate mechanism through which academia can be part of formal consultations
- explore communication alternatives to ensure the awareness of CCJS data among the research/academia community.
5. Management Response and Action Plan
Recommendation 1: Performance (timeliness)
While the evaluation found that the CCJS program delivers high-quality statistical data that are generally timely, the relevance of justice statistics could be increased by providing earlier indications of justice information changes or trends to facilitate program and policy decisions.
Recognizing that a complete analysis of justice statistics requires time to produce accurate results and that the production of justice statistical data occurs in a context of shared responsibilities, it is recommended that the CCJS explore with partners the possibility of producing more timely indicators in key selected areas to provide earlier indications of issues and trends.
Statement of agreement or disagreement
CCJS management agrees with the statement with respect to hate crime.
Management response
The repeated requests from central agencies to get more data on hate crime since the beginning of the year, combined with the recent release on June 13, 2015, of hate crime data, have brought public attention to the need to produce more timely indicators of hate crime. The CCJS recognizes this need. The CCJS has addressed the issue with police forces to sensitize them to the need to devote resources to the certification and sign-off of hate crime data to improve the timeliness of hate crime data production.
This issue was brought to the attention of POLIS members at their last meeting on April 5, 2017, and to the attention of LOC FPT members at the last LOCNJSI meeting on May 17 and 18.
The matter of producing more timely indicators has been raised only for hate crime thus far. The timeliness of other indicators pertaining to other areas of the criminal justice system has never been officially raised. Other indicators are generally produced in a period of less than a year, which compares favourably with other social statistics programs based on administrative data.
| Deliverable(s) | Timeline | Responsible party |
|---|---|---|
| Hate crime indicators: | ||
|
July 2017 | CCJS |
|
July 2017 | CCJS |
|
Current fiscal year (2017/2018)—prior to March 2018 Preliminary data release aimed for November 2017 |
CCJS |
Recommendation 2: Performance (accessibility)
Currently, academia is not part of the formal governance of the CCJS program. Researchers are informed about CCJS data in RDCs through notifications from RDCs sent to distribution lists at local universities. It is unclear to what extent that information is communicated effectively to targeted faculty and students. Academic researchers are key CCJS data users whose needs are not fully considered given their limited participation in decision making.
Recognizing the value added of the contribution of researchers to CCJS analytical products, it is recommended that the CCJS program
- establish an appropriate mechanism through which academia can be part of formal consultations
- explore communication alternatives to ensure the awareness of CCJS data among the research/academia community.
Statement of agreement or disagreement
CCJS management agrees..
Management response
The CCJS agrees to increase the involvement of academics in some areas of data development. It should be noted that academics are considered and consulted in the redesign phase of various surveys. Some of the proposed activities are already in motion.
| Deliverable(s) | Timeline | Responsible party |
|---|---|---|
| Engage academia in formal consultations: | ||
|
December 2017 | CCJS |
|
Already ongoing, with a formal consultation in the fall of 2017 and beyond, up to March 2018 | CCJS |
| Enhance awareness of justice data in RDCs through presentations about CCJS data in research forums or at academic conferences. The CCJS will participate in two events in the 2017/2018 fiscal year: | ||
|
May 2017 | CCJS and Microdata Access Division |
|
June 2017 | |
|
Throughout the year as opportunities arise (CRDCN conference) to increase the use of CCJS data in RDCs | |
Appendix 1: References
Aboriginal Affairs and Northern Development Canada (2014). Performance Measurement Strategy Developed for Social Development Program (2.2).
Auditor General of Canada (2002). April Report of the Auditor General of Canada. Chapter 4—The Criminal Justice System: Significant Challenges.
Canadian Research Data Centres Network website.
Citizenship and Immigration Canada (2010). Evaluation of the Nationally Standardized Data Collection Strategy on Hate-motivated Crime Report.
Government of Canada (2015). Budget 2015—Strong Leadership: A Balanced Budget, Low-tax Plan for Jobs, Growth and Security.
Government of Canada (2016). Budget 2016—Growing the Middle Class.
National Association for Public Health Statistics and Information Systems (2013). More. Better. Faster. Strategies for Improving the Timeliness of Vital Statistics. April.
National Justice Statistics Initiative (2010). Justice Information Roadmap. Internal document.
National Justice Statistics Initiative (2015a). Justice Information Roadmap. Internal document.
National Justice Statistics Initiative (2015b). Terms of Reference. Internal document.
Statistics Act (R.S.C., 1985, c. S-19). Criminal statistics.
Statistics Canada (2002). Statistics Canada's Quality Assurance Framework. Statistics Canada Catalogue no. 12-586-X. Ottawa.
Statistics Canada (2009a). Statistics Canada Quality Guidelines, 5th edition. Statistics Canada Catalogue no. 12-539-X. Ottawa.
Statistics Canada (2009b). Statistics Canada's Corporate Management Framework.
Statistics Canada (2010). Working Group on Funding of the Liaison Officers Committee on the National Justice Statistics Initiative, Justice Information Roadmap. December.
Statistics Canada (2012a) "Adult correctional statistics in Canada, 2010/2011." Juristat. Statistics Canada Catalogue no. 85-002-X.
Statistics Canada (2012b). Operational Plan of the Canadian Centre for Justice Statistics (CCJS) and the National Justice Statistics Initiative (NJSI) for 2013/14. November.
Statistics Canada (2013). Corporate Business Plan 2013-14 to 2015-16.
Statistics Canada (2014a). Evaluation of the Demography, Aboriginal and Other Social Statistics Program 2010-2011 to 2012-2013. Report.
Statistics Canada (2014b). Police Information and Statistics (POLIS) Committee Meeting Agenda, April 14 and 15, 2015. Internal document.
Statistics Canada (2014c). Canadian Centre for Justice Statistics Operational Plan 2014/2015.
Statistics Canada (2015a). National Justice Statistics Initiative. Terms of Reference. Internal document.
Statistics Canada (2015b). Audit of Justice Statistics.
Statistics Canada (2015c). Performance Measurement Strategy. Canadian Centre for Justice Statistics. Internal document.
Statistics Canada (2015d). Consultation Feedback Annual Report: Canadian Centre for Justice Statistics. Internal document.
Statistics Canada (2016a). Corporate Business Plan 2016/2017 to 2018/2019. Internal document.
Statistics Canada (2016b). Draft—Field 8 Working Document: Mandate Letters Cross Referenced to Social Theme. Internal working document.
Statistics Canada (2016c). 2016-2017 Report on Plans and Priorities.
Statistics Canada (2017a). The General Social Survey: An Overview.
Statistics Canada (2017b). "Measuring organized crime in Canada: Results of a pilot project." Juristat. Statistics Canada Catalogue no. 85-002-X.
Treasury Board of Canada (2015). Whole-of-government Framework.
Appendix 2: National Justice Statistics Initiative (NJSI) GovernanceFootnote 52
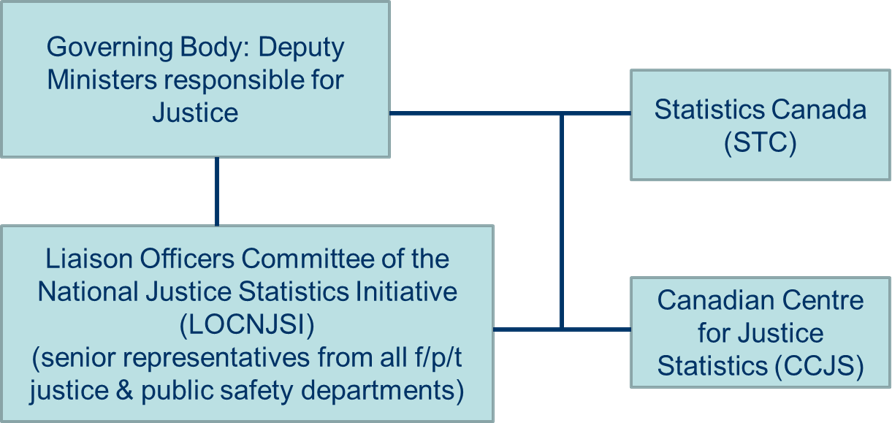
Description: Appendix 2: National Justice Statistics Initiative (NJSI) Governance
This figure describes the governance structure for the National Justice Statistics Initiative (NJSI) including the federal, provincial and territorial representatives
The NJSI is governed by the group of deputy ministers (F/P/T) responsible for justice
The Liaison Officers committee of the NJSI reports to the deputy ministers committee and consists of senior representatives of all F/P/T departments
CCJS works with the Liaison Officers Committee and reports to senior management at Statistics Canada
Senior Management at Statistics Canada interacts with the Deputy Ministers responsible for Justice Committee which governs the NJSI
Appendix 3: Canadian Centre for Justice Statistics Key Surveys and Data Products
Statistical programs
1. Policing Services Program:
Subject-matter lead for information related to the policing sector of the justice domain and responsible for the following surveys:
- Uniform Crime Reporting (UCR) Survey
- The UCR Survey is an annual administrative data survey collecting police-reported crime data from police services, who are the survey respondents, across Canada since 1962. The microdata version of the survey (UCR2), covering over 99% of police-reported criminal incidents in Canada, captures information on each incident (e.g., violation, location, weapons involved) and the victim and the accused (e.g., age, sex, victim–accused relationship, level of injury to the victim). A few small police services provide only aggregate information to theUCR Survey. Many statistical indicators are produced from the UCR Survey, including the annual crime rate, Crime Severity Index (CSI), trends of the rate and the CSI, number of clearances (i.e., number of criminal incidents solved by the police), number and rate of charges, and detailed information on violation types. Information on police-reported hate crime and cybercrime has been included in the UCR Survey data collection since 2004.
- Homicide Survey
- This annual administrative data survey has collected police-reported data on the characteristics of all murder incidents, victims and accused persons since 1961 and all homicides (including murder, manslaughter and infanticide) since 1974. The survey produces data on annual homicide rates, the methods through which the homicide was committed, the relationship between the accused and the victim(s), and some characteristics of the accused and victim(s).
- Police Administration Survey (PAS)
- The PAS is an annual survey. It collects summary, aggregated administrative data from each police service on the number of police officers and civilians by rank, sex and major function, as well as high-level operating expenditure data. Through funding from the Police Sector Council, a new, enhanced police personnel survey was developed and first implemented for collection of 2012 data. The new survey captures information such as years of service, number of officers by age and number eligible to retire.
- Transition Home Survey (THS)
- The THS is a biennial administrative data survey. Every two years, the survey collects information on all residential agencies providing services to abused women and their children across Canada. It provides information on residential services for abused women and their children during the previous 12 months, as well as a one-day snapshot of the clientele being served on a specific date.
- Victim Services Survey (VSS)
- The VSS was a biennial aggregate administrative data survey collected through a cost-recovery contract with the Policy Centre for Victim Issues. The purpose of this survey was to collect information on victim service agencies that provided services directly to primary or secondary victims of crime during the 12-month reference period, as well as to provide a one-day snapshot of the clientele being served on a specific date. Funding for the VSS ended in 2012. At present, discussions are underway with a focus on exploring a redesign.
2. Courts Program: Subject-matter lead for information on courts. The program collects and integrates data on courts and consists of the surveys below:
- Integrated Criminal Court Survey (ICCS)
- The ICCS is an annual administrative data survey. It collects detailed microdata on every appearance in adult criminal and youth court. The ICCS provides information on caseload (e.g., number of cases disposed by type of offence), case processing (e.g., time taken to complete cases), decision and sentencing (e.g., length of prison term) for all Criminal Code and other federal statute charges in Canada.
- Survey of Maintenance Enforcement Programs (SMEP)
- The SMEP collects detailed microdata on child and spousal support cases registered with a provincial or territorial maintenance enforcement program. Monthly data are collected on caseload (e.g., number of cases registered), case characteristics (e.g., arrears status) and client profiles (e.g., age and sex of recipient and payer), as well as financial and enforcement-related information (e.g., amount of support due and received, type of actions taken to enforce payment). Statistics generated from the SMEP are disseminated annually.
- Civil Court Survey (CCS)
- The CCS collects microdata on all events and cases in general civil and family courts. These include information on case characteristics (e.g., type of civil or family action), type and date of each event (e.g., document filed, discovery, motion, pre-trial hearing, trial hearing and adjournment), and type and nature of judgments (e.g., settled by parties, default judgment, abandoned, dismissed). Also available from the survey is caseload information (e.g., number of cases initiated, volume of civil court events) and data on case processing (e.g., elapsed time between events). Data from the CCS are collected quarterly in the month following the end of the quarter (i.e., July, October, January and April).
- Legal Aid Survey (LAS)
- The LAS is an annual survey that collects aggregate information from the 13 legal aid plans in Canada on funding (e.g., total revenues and expenditures), personnel (e.g., total lawyers and non-lawyers) and caseload statistics (e.g., total applications received and approved) associated with the provision of criminal and civil legal aid services.
3. Correctional Services Program: Subject-matter lead for information on correctional services in Canada. The program is responsible for a number of surveys on correctional services:
- Adult Correctional Services (ACS) Survey
- The ACS is an annual administrative data survey. It collects aggregate data on the number and case characteristics (e.g., sex, age groupings, Aboriginal identity, length of time served) of admissions to and releases from adult custodial and non-custodial correctional services. The survey also collects information on selected aspects of correctional services (e.g., number of facilities in operation at year-end, security level of facilities, number of bed spaces, number of inmate deaths by cause of death). The ACS has a resources, expenditure and personnel (REP) component that collects aggregate expenditure and personnel data for correctional services to permit the calculation of statistics on the cost of correctional services, such as per diem inmate costs.
- Youth Custody and Community Services (YCCS) Survey
- The YCCS Survey is an annual administrative data survey. It collects aggregate data on the number and case characteristics (e.g., sex, age groupings, Aboriginal identity, length of time served) of admissions to and releases from youth custodial and non-custodial correctional services.
- Corrections Key Indicator Report for Adults and Youth (CKIR)
- The CKIR is an annual administrative data survey. It collects aggregate data on average daily custody counts and month-end supervised community corrections counts in the youth and adult correctional systems. The information provides an overview of adult and youth corrections populations and serves as a basis for calculating incarceration rates.
- Integrated Correctional Services Survey (ICSS)
- The ICSS is an annual administrative data survey. It collects microdata on adults and youth under the responsibility of the federal, provincial and territorial correctional systems. Data include sociodemographic characteristics (e.g., age, sex, Aboriginal identity), as well as information pertaining to correctional supervision, including legal hold status (e.g., remand, sentenced, probation) and events (e.g., temporary absence, attend treatment). The ICSS is currently being redesigned. The new survey is entitled the Canadian Correctional Services Survey (CCSS). Once implemented, it will provide the admissions data collected via the Adult Correctional Services Survey and the Youth Custody and Community Services Survey. There is also potential for it replacing the average counts data collected via the CKIR survey. Data from the CCSS are expected to be available by March 2019.
Products and services
- Data access and dissemination
- To promote and facilitate access to crime and justice information, the CCJS produces and disseminates close to 120 CANSIM data tables annually and prepares cost-recovery custom data extractions for various clients, including government departments, NGOs, academia and the media. A client service email and phone number are set up to handle public enquiries on data availability and access, and on data concepts, definitions and usage. To further increase the access to justice data, remote access to microdata through Real Time Remote Access (RTRA) and microdata files of selected CCJS surveys (e.g., the UCR Survey, Homicide Survey and Hate Crime) in the Research Data Centres (RDC) Program are available for users. Furthermore, the CCJS provides opportunities for work-in-progress reviews and data validation of CCJS analytical products to NJSI partners. Access to pre-release information is given via the agency's Electronic File Transfer Service.
- Analysis and analytical products
- The CCJS is the agency's focal point and expert in crime and justice statistics. The centre conducts in-depth analysis on a variety of justice-related topics and issues, and provides subject-matter advice to external and internal partners on the topics of crime, victimization and the justice system. For example, in response to requests from House of Commons and Senate committees, the CCJS frequently prepares presentations on specific topics that feed into policy discussions. Results of analysis are presented in the agency's flagship publications Juristat or Juristat Bulletin.
Juristat and Juristat Bulletin are prepared to support internal CCJS program areas in the release of survey results. To ensure relevance, the analytical team works with the Liaison Officers Committee of the NJSI (LOCNJSI) to jointly determine on a yearly basis the special topics. In-depth analysis on these special topics is conducted and the results are released in Juristat. Approval of the topics is sought from the deputy ministers responsible for justice and public safety.
On average, the CCJS releases six or seven annual articles, which highlight results from the courts, corrections and policing surveys. The CCJS releases an annual Juristat article on family violence as part of its contribution to the Family Violence Initiative (FVI). Finally, the CCJS releases on an annual basis approximately five or six detailed analytical reports on various crime and justice topics.
Furthermore, numerous presentations are prepared on various topics. These presentations are used to inform policy discussions (e.g., those at parliamentary committees and in human rights groups focusing on missing and murdered Aboriginal women).
Data development and special projects
The CCJS works with NJSI partners and other justice stakeholders to identify key data gaps and to collaborate in the development of new data elements and data products to address information needs. The work being undertaken ensures that the CCJS continues to provide close alignment and timely support to deputy ministers responsible for justice and public safety, as well as other NJSI partners, in addressing their policy and program priorities. There are a number of these ad hoc projects; the following lists those that are currently undertaken by the CCJS:
- Re-contact with the Justice System Project
- This is a multi-year, multi-phase project that the CCJS developed in partnership with representatives of the NJSI to create high-level indicators of re-contact with, and pathways through, the criminal justice system. This project increases the ability to examine issues across the three justice sectors (i.e., policing, courts and corrections). The project was officially launched in April 2012. The initial plan of the project focused on data in the province of Saskatchewan. With the success of the Saskatchewan data, the project has since expanded to include jurisdictions in cities in Canada (e.g., Toronto, Waterloo); for this reason, the end date for the project has not been determined.
- Police Performance Metrics and Calls for Service Project
- This is a multi-phase project that started in April 2014, with the aim to better understand police performance. The project will include the development of a national framework to measure performance, and indicators to measure efficiency and effectiveness. Part of the performance indicator work involves the data development pertaining to calls for service across police forces.
- Family Violence Initiative (FVI)
- Statistics Canada, led by the CCJS, has been a partner in the FVI since 1996. The FVI has the mandate to promote public awareness of the risk factors of family violence and the need for public involvement in responding to it; to strengthen the ability of the criminal justice, health and housing systems to respond; and to support data collection, research and evaluation efforts to identify effective interventions. The agency's role in the FVI has mainly been in statistical advice, data collection and analysis. For example, Statistics Canada prepares an annual statistical profile on family violence in Canada, including information on the incidence and prevalence of family violence; collects data through the Transition Home Survey; and provides subject-matter area support for the General Social Survey (GSS) on Victimization and other relevant surveys.
- Survey of Emergency Preparedness and Resilience (SEPR)
- The SEPR was a cost-recovery ad hoc survey being conducted for the first time to improve understanding of community resilience across Canada's provinces by examining how people prepare for, respond to and recover from emergencies or disasters, and how they fare on other social and economic factors related to resilience. The survey provided information to help establish priorities, allocate funds and map communities or regions according to their level of vulnerability. The survey was funded by Defence Research and Development Canada, with support from Public Safety Canada. The CCJS was the subject-matter lead for the SEPR and was responsible for the analysis and the dissemination of the survey results in the fall of 2015
- Victims of crime—data mapping
- In partnership with the Office of the Federal Ombudsman for Victims of Crime, the CCJS undertook a feasibility study in 2015 on data mapping for victims of crime. The end product of this feasibility study was a strategic roadmap detailing options for short-, medium- and long-term data projects to respond to research needs identified from the consultations and to develop victim-related indicators, as well as listing various options to evaluate the impact of the Canadian Victims Bill of Rights.
- National Fire Information Database
- The National Fire Information Database (NFID) is a new cost-recovery project that will be undertaken by the CCJS, working in collaboration with the Canadian Association of Fire Chiefs and the Council of Canadian Fire Marshals and Fire Commissioners. Broadly speaking, the purpose of this pilot project is to collect, for the first time, national data on fire incidents and losses.
The CCJS will use its significant experience in collecting and disseminating national-level data on policing, courts, correctional services and other justice and public safety topics to help the NFID project. Over the course of the next three years, the CCJS will work with the new partners to develop the capacity to collect, compile and analyze fire incident information on a national basis. These activities are important steps in addressing an important gap in existing knowledge of fire incidents and understanding the nature and extent of fire incidents across the country. Furthermore, these data will assist fire services in making operational decisions, improving policy and prevention measures in the development of appropriate and efficient methods of fire response, and promoting public awareness about the dangers of fire. - Data Quality Secretariat (DQS)
- The DQS is an initiative at the CCJS to maintain and improve the quality of all outputs from the centre. The work of the DQS varies from year to year, but it generally includes identifying and conducting data evaluation studies of CCJS surveys, assessing key risks to these surveys, documenting best practices in conducting the surveys, and developing and implementing action plans.
Appendix 4: Canadian Centre for Justice Statistics Logic Model
The program logic model presented in Figure 3 below is based on Statistics Canada's Quality Assurance Framework,Footnote 53 which describes the six dimensions of quality management of all statistics, data and products (i.e., accessibility, timeliness, accuracy, interpretability, coherence and relevance). The logic model is also aligned with Statistics Canada's Corporate Management FrameworkFootnote 54, which illustrates how the agency delivers its strategic outcomes. The six dimensions of quality management are integrated into the framework as enablers in a hierarchical sequence from access to quality (including accuracy, interpretability and coherence), and then relevance.Footnote 55
Figure 3 Canadian Centre for Justice Statistics logic model
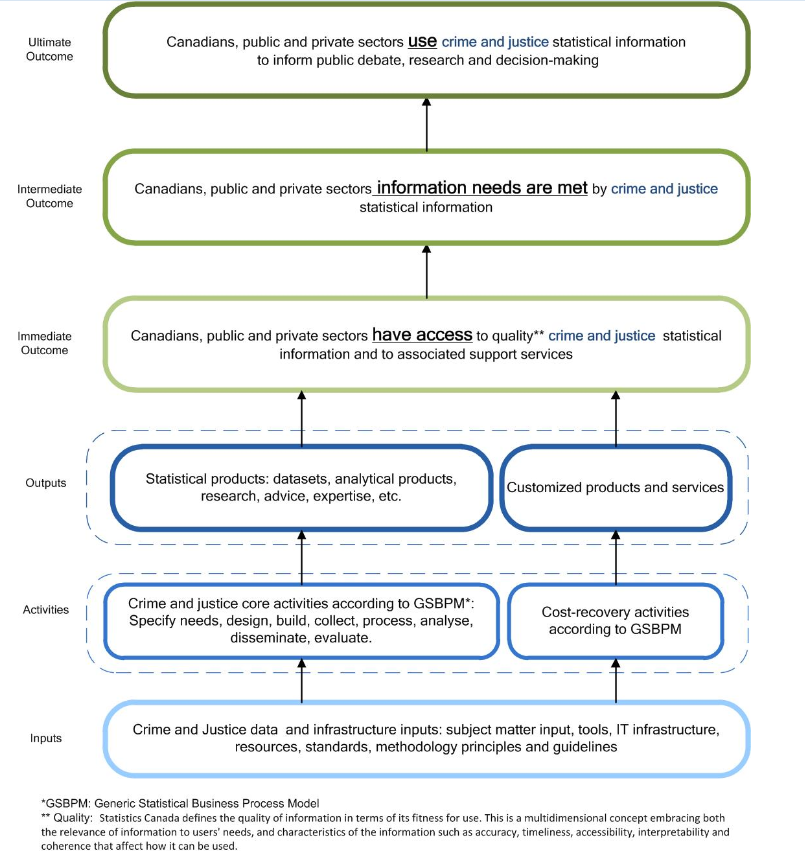
Description: Figure 3 Canadian Centre for Justice Statistics logic model
This figure depicts the Logic Model for the CCJS Program. It is divided into six layers and shows how each layer contributes upwards to achieve the ultimate outcome. The six layers are from top to bottom: ultimate outcome, intermediate outcome, immediate outcome, outputs, activities, and inputs.
The ultimate outcome is that 'Canadians, public and private sectors use crime and justice statistical information to inform public debate, research and decision-making. It is at the top of the model.
The intermediate outcome is that Canadians, public and private sectors information needs are met by crime and justice statistical information.
The immediate outcome is that Canadians, public and private sectors have access to quality crime and justice statistical information and to associated support services.
There are two outputs: statistical products which includes datasets, analytical products, research, advice and expertise; and, customized products and services.
There are two activities: program specific core activities according to the GSBPM which includes specify needs, design, build, collect, process, analyse, disseminate and evaluate; cost-recovery activities according to GSBPM.
The inputs are program specific data regarding crime and justice and infrastructure inputs. It includes subject matter input, tools, IT infrastructure, resources, standards, methodology principles and guidelines. The inputs are the lowest layer.
GSBPM referred to under activities is the Generic Statistical Business Process Model.
For quality as is referred to under the immediate outcome, Statistics Canada defines the quality of information in terms of its fitness for use. This is a multidimensional concept embracing both the relevance of information to users' needs, and characteristics of the information such as accuracy, timeliness, accessibility, interpretability and coherence that affect how it can be used.
Appendix 5: Evaluation Issues and Questions
| Issues | Questions |
|---|---|
| Relevance | |
| Continued need for the program | 1.1 Is there a continued need for the program? |
| Alignment with government priorities | 2.1 Is the program responsive to the Government of Canada's priorities? 2.2 Does the program support the priorities and strategic outcomes of Statistics Canada? |
| Consistency with federal roles and responsibilities | 3.1 Are the Government of Canada's roles and responsibilities appropriate in delivering the program? |
| Performance (effectiveness) | |
| Achievement of expected outcomes | 4.1 To what extent do Canadians and the public and private sectors have access to quality crime and justice statistics and to associated support services?
|
| Performance (efficiency and economy) | |
| Demonstration of efficiency and economy | 5.1 Are the program structure and governance clear and functioning adequately to support the achievement of intended outcomes? To what extent did the restructuring of the work unit for data and dissemination increase efficiency? 5.2 To what extent have the CCJS inputs been appropriate and minimized to produce the intended outputs and outcomes? 5.3 Are there any unintended outcomes (positive or negative), and how have they been addressed? 5.4 To what extent are the CCJS's resources appropriate to deliver quality outputs in support of the achievement of the intended outcomes, by program component? 5.5 Are there alternative ways of delivering the CCJS program or any of its components to improve its efficiency/economy? |
Appendix 6: Evaluation Strategy
For each evaluation question, the evaluation used multiple lines of evidence consisting of quantitative and qualitative data collection methods described below. Multiple data sources provide information from various perspectives, which helps for triangulation and validation of evaluation findings, thus increasing their accuracy and credibility and strengthening the validity of conclusions.
The evaluation used the following approaches:
- Outcomes-based approach: This approach assesses the progress the program components have made towards the achievement of expected outcomes, and whether there were adequate resources and if opportunities for improvement were taken.
- Utilization-focused approach: This approach focuses parts of the evaluation on aspects of the program selected according to the needs of primary users for specific purposes and decision making. This approach involves preliminary consultation with the management team of the program to discuss evaluation issues and questions, approach, and scope, and to identify potential components.
Data collection methods
Document review
The document review consists of a review, synthesis and analysis of data from relevant documentation to provide a comprehensive understanding of the program and address the evaluation questions. The documents include, but are not limited to
- documents specific to the CCJS such as operational plans, agreements and MOUs, publications, special studies, Client Relationship Management System (CRMS) requests, stakeholder consultation reports, committee and federal–provincial–territorial consultation minutes, presentations, project/survey files, and other types of documents (such as news release inventories by the CCJS) related to this evaluation
- program- and policy-related documentation such as Memoranda to Cabinet, Treasury Board Submissions, strategic plans, the CCJS Performance Measurement Strategy, audit and evaluation reports (from Statistics Canada or other departments), as well as other documents that make reference to the CCJS (e.g., documents related to ministerial reviews, Speeches from the Throne, federal budgets, legislation, policy statements, OAG reports, mandate letters)
- targeted reports and publications from the federal government (e.g., Immigration, Refugees and Citizenship Canada; Indigenous and Northern Affairs Canada; Correctional Service Canada) and other Canadian institutions to serve as a line of evidence for all the evaluation issues and questions (this also includes publications by international partners, such as the United Nations Office on Drugs and Crime, to assess the quality of Statistics Canada's statistical information compared with international standards and identify potential alternatives).
Financial and administrative data review
The following sources, among others, were examined as part of the data review:
- financial documents and administrative documents/databases linked to the operations and activities of the CCJS, such as the financial request system (FRS)
- data linked to the publication and dissemination of CCJS products
- data related to the quality of the outputs produced by the CCJS
- information about data requests and support services provided to users by the CCJS
- information about the exposure of the statistical information in the traditional media and social media
- agreements and MOUs related to data sharing and cost-recovery activities.
This review is undertaken to provide a complete description of the program and its resources; assess the achievement of its outputs and outcomes, including its efficiency and economy; and inform the analysis and final reporting.
Key informant interviews
Forty-two interviews with 47 key informants were conducted to gather more in-depth information on the subjective perspectives of senior program managers as well as of key data users and stakeholders (within federal, provincial and municipal organizations) to complement, further explain and augment the validity of evaluation findings. The selection of participants was based on their expertise and role in the management and delivery of the CCJS.
| Interview informant categories | Number of interviews | Total number of interviewees |
|---|---|---|
| Provincial and territorial jurisdictionsFootnote 56 | 20 | 21 |
| Federal departments or agencies | 6 | 6 |
| Academics | 4 | 4 |
| International organizations | 1 | 1 |
| Informants (internal) | 11 | 15 |
| Total | 42 | 47 |
Survey of key users
An online survey of users was conducted as part of the evaluation. The target population for this online survey was users of statistical information produced and released by the CCJS. Representatives who participated in key informant interviews were not invited to participate in the survey to avoid respondent fatigue.
The focus was to assess users' past, current and future needs, and their appraisal of the data and services that were provided. The sample was composed of names from the program's list of key users and the Client Relationship Management System (CRMS). There was no intent to build a representative sample of users. Instead, the intent was to get a clear picture by reaching a maximum number of users.
In total, 156 individuals from a total population of 1,228 unique records of justice statistical information users completed the survey. A response rate of 16% was achieved on the 967 valid cases in the sample. Each individual in the sample was sent a bilingual survey invitation that included a unique hypertext link to access their case. Each respondent could stop and re-enter the survey at any time prior to completion. The survey was conducted over a four-week period, from June 24 to July 22, 2016. Reminders were sent weekly to individuals who had not yet completed the survey, prior to a final reminder notifying them of the upcoming closing date for the survey. Once the survey was out of the field, open-ended responses were reviewed and coded, and banner tables were created to explore results by feasible key characteristics (type of justice statistical information used, type of organization and level of knowledge of users).
Bibliometric and webometric analysis
This data collection method is a source of information for the assessment of the program's higher-level outcomes that are linked to the use of statistical information. Common challenges with providing strong evidence for the use of programs' statistical products are related to the fact that the contribution of Statistics Canada to federal government outcomes is both direct (by informing public debate and decision making on economic, social, international and government affairs) and indirect (by supporting policy formulation, implementation and evaluation within the federal government).Footnote 57 In addition, the good reputation of and public trust in Statistics Canada rely on its neutrality, as far as the use of the information is concerned. This means that the agency purposely has a limited influence on how statistical information and products are used, and their impact on society. Moreover, users do not have any obligation to inform Statistics Canada of how they use its data and information. Bibliometric and webometric methods have the potential to be one strong line of evidence for evaluation studies with the measurement of "use."
Bibliometric methods are broadly defined as a set of methods and procedures used to measure bibliographic records. Bibliometric methods can be used to measure scientific outputs (scientometrics; basic units of measurement are articles in scientific journals) and technological outputs (technimetrics; basic units of measurement are patents). Less frequently, bibliometric methods can be adapted to quantify the impact of publications on an audience with specific characteristics, such as the academic community.
This evaluation measures the use of data and publications from the CCJS in the scientific literature based on bibliometric methods. It attempts to (1) measure the impact of scientific products (publications) from the program on the work of Canadian and international researchers; (2) identify the institutions, sectors, countries and scientific disciplines of the authors; and (3) establish the types of scientific collaborations that are formed for the use of the program data.
When bibliometric methods are modified to measure references and citations on websites and social media, they are referred to as webometrics. Then, the basic units of measurement are website links. In the current evaluation study, webometrics measure the impact of products and publications from the CCJS in specialized circles and on the general public. This was undertaken by analyzing the Web in general.
Appendix 7: Mandate Letter Priorities
The Canadian Centre for Justice Statistics can support various current government priorities by providing information for the following:Footnote 58
| Social themes | Mandate letter priorities |
|---|---|
| Supporting the Indigenous Population |
|
|
|
| Immigration, Refugees and Citizenship Canada |
|
| Canadian Identity and Heritage |
|
| Justice and Public Safety |
|
|
|
|
|
|
|
|
|
|
|
|
|
|
|
|
|
|
|
|