
With the release of the January 2023 Consumer Price Index (CPI) on February 21, the CPI-trim and CPI-median have been revised back 84 months as per their normal revision policy. Two enhancements have been made at this time:
- Statistics Canada has published, for the first time, index-level data series for CPI-trim and CPI-median to accompany the year-over-year figures published monthly since December 2016.
- The seasonal adjustment treatment of step-series indexes that are used in the calculation of the CPI-trim and CPI-median has been enhanced as part of the regular review of methodologies.
Statistics Canada is responsible for both these aspects of the core inflation measures, along with their calculation. The Bank of Canada has been advised of the changes, as they set out the methodology for the measures.
These enhancements have no impact on the All-items CPI, seasonally adjusted All-items CPI, or the CPI-common.
Why are index levels now being published for the CPI-trim and CPI-median?
Statistics Canada continually strives to provide the data Canadians need, when they need them, and how they want them. Our users have told us that these data provide more flexibility. The new index-level data allow users to calculate the year-over-year percentage change themselves, along with the changes over any other reference period, including monthly and quarterly, which was previously not possible, nor available.
It should be noted that calculating the year-over-year percentage change using the rounded, published index values could result in slight differences compared to the published year-over-year percentage change, due to the latter figure's calculation prior to index rounding.
Where are the index-level data published?
Index-level data series for CPI-trim and CPI-median have been published in Table: 18-10-0256-01, Consumer Price Index (CPI) statistics, measures of core inflation and other related statistics - Bank of Canada definitions, and Table: 18-10-0259-01, Historical (real-time) releases of Consumer Price Index (CPI) statistics, measures of core inflation - Bank of Canada definitions. The index series are available back to January 1989. The index base period is January 1989=100.
Data currently published for these measures in the form of year-over-year percent changes continue to be published, along with CPI-common, the third Bank of Canada's preferred measure of core inflation.
Why has the seasonal adjustment process been enhanced?
The enhancement is part of Statistics Canada's regular review of methodologies that ensures techniques are improved to produce the most accurate indicators as possible for users. The seasonal adjustment process remains unchanged for the majority of the seasonally adjusted series; seasonal adjustment treatment has been enhanced for 15 of the 43 seasonally adjusted input series – those identified as step series – with one of the step series having already been treated in the enhanced manner. This enhancement aims to avoid potential under- and over-estimation of price change that can be caused by treating index movements of step series as outliers in the seasonal adjustment process. Such changes are best made at the time of annual revision of seasonal adjustment options to avoid creating breaks in series that might then interfere with regular, annual evaluation and modification of seasonal adjustment parameters.
| Not currently seasonally adjusted | Currently seasonally adjusted | Total | |
|---|---|---|---|
| Non-step series | 11 | 27 | 38 |
| Step series | 1 | 16Tablenote 1 | 17 |
| Total | 12 | 43 | 55 |
|
|||
What is the enhancement to seasonal adjustment?
The seasonal adjustment process for most series contains two main components: (1) the identification and treatment of outliers, including adjustments for calendar effects when holidays or the number of days between months is not equal and may affect trends in the indicator, and (2) the application of various filters to remove seasonal patterns to parse out underlying economic trends that are not influenced by seasonality – essentially, a trend-smoothing process. Going forward, indexes that display a step series pattern, and that were undergoing the full seasonal adjustment process, will only be subjected to the second component, the trend-smoothing process; this ensures that non-seasonal movements of these series are further captured through the process and more accurately reflected in the CPI-trim and CPI-median indicators.
In the context of price indexes, a step series can be any series that displays periods of flatness, followed by sudden price change, creating a step-like appearance in the charted index over time. It can be evident in the prices of products or services that are collected or may change infrequently (annually or quarterly) or regularly priced series whose movements are stable, followed by periodic larger movements. Examples of step-series subcomponents of the CPI are illustrated in chart 1.
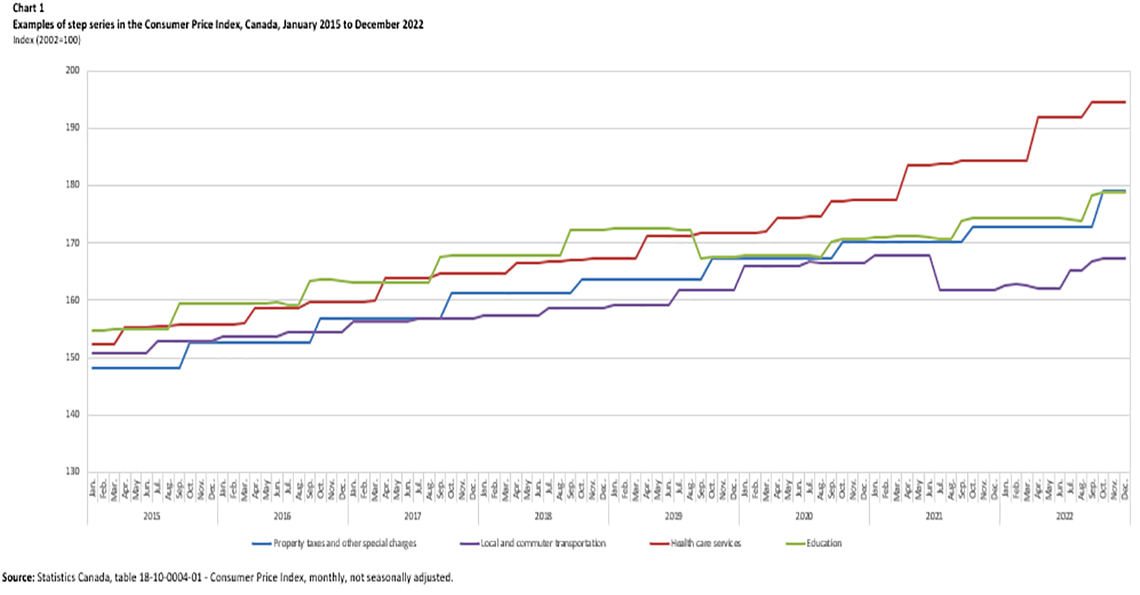
Description: Chart 1 - Examples of step series in the Consumer Price Index, Canada, January 2015 to December 2022
| Property taxes and other special charges | Local and commuter transportation | Health care services | Education | ||
|---|---|---|---|---|---|
| Index (2002=100) | |||||
| 2015 | Jan. | 148.3 | 150.7 | 152.3 | 154.8 |
| Feb. | 148.3 | 150.7 | 152.3 | 154.8 | |
| Mar. | 148.3 | 150.7 | 152.4 | 154.9 | |
| Apr. | 148.3 | 150.7 | 155.3 | 154.9 | |
| May | 148.3 | 150.7 | 155.3 | 154.9 | |
| Jun. | 148.3 | 150.7 | 155.3 | 154.9 | |
| Jul. | 148.3 | 152.8 | 155.4 | 154.9 | |
| Aug. | 148.3 | 152.8 | 155.4 | 154.9 | |
| Sep. | 148.3 | 152.8 | 155.7 | 159.4 | |
| Oct. | 152.7 | 152.8 | 155.7 | 159.4 | |
| Nov. | 152.7 | 152.8 | 155.8 | 159.4 | |
| Dec. | 152.7 | 152.8 | 155.8 | 159.5 | |
| 2016 | Jan. | 152.7 | 153.7 | 155.8 | 159.5 |
| Feb. | 152.7 | 153.7 | 155.8 | 159.5 | |
| Mar. | 152.7 | 153.7 | 155.9 | 159.5 | |
| Apr. | 152.7 | 153.7 | 158.6 | 159.5 | |
| May | 152.7 | 153.7 | 158.6 | 159.5 | |
| Jun. | 152.7 | 153.7 | 158.6 | 159.6 | |
| Jul. | 152.7 | 154.5 | 158.6 | 159.3 | |
| Aug. | 152.7 | 154.5 | 158.6 | 159.2 | |
| Sep. | 152.7 | 154.5 | 159.8 | 163.3 | |
| Oct. | 156.9 | 154.5 | 159.8 | 163.5 | |
| Nov. | 156.9 | 154.5 | 159.8 | 163.5 | |
| Dec. | 156.9 | 154.5 | 159.8 | 163.4 | |
| 2017 | Jan. | 156.9 | 156.2 | 159.8 | 163.2 |
| Feb. | 156.9 | 156.2 | 159.8 | 163.1 | |
| Mar. | 156.9 | 156.2 | 159.9 | 163.1 | |
| Apr. | 156.9 | 156.2 | 163.9 | 163.1 | |
| May | 156.9 | 156.2 | 163.9 | 163.1 | |
| Jun. | 156.9 | 156.2 | 163.9 | 163.1 | |
| Jul. | 156.9 | 156.7 | 163.9 | 163.1 | |
| Aug. | 156.9 | 156.7 | 163.9 | 163 | |
| Sep. | 156.9 | 156.7 | 164.6 | 167.6 | |
| Oct. | 161.3 | 156.7 | 164.6 | 167.7 | |
| Nov. | 161.3 | 156.7 | 164.6 | 167.7 | |
| Dec. | 161.3 | 156.7 | 164.6 | 167.7 | |
| 2018 | Jan. | 161.3 | 157.4 | 164.6 | 167.8 |
| Feb. | 161.3 | 157.4 | 164.6 | 167.8 | |
| Mar. | 161.3 | 157.4 | 164.8 | 167.8 | |
| Apr. | 161.3 | 157.4 | 166.6 | 167.8 | |
| May | 161.3 | 157.4 | 166.6 | 167.8 | |
| Jun. | 161.3 | 157.4 | 166.6 | 167.8 | |
| Jul. | 161.3 | 158.7 | 166.7 | 167.8 | |
| Aug. | 161.3 | 158.7 | 166.7 | 167.7 | |
| Sep. | 161.3 | 158.7 | 167.1 | 172.2 | |
| Oct. | 163.6 | 158.7 | 167.1 | 172.3 | |
| Nov. | 163.6 | 158.7 | 167.2 | 172.3 | |
| Dec. | 163.6 | 158.7 | 167.2 | 172.4 | |
| 2019 | Jan. | 163.6 | 159.2 | 167.2 | 172.5 |
| Feb. | 163.6 | 159.2 | 167.2 | 172.5 | |
| Mar. | 163.6 | 159.2 | 167.3 | 172.6 | |
| Apr. | 163.6 | 159.2 | 171.1 | 172.5 | |
| May | 163.6 | 159.2 | 171.1 | 172.5 | |
| Jun. | 163.6 | 159.2 | 171.1 | 172.5 | |
| Jul. | 163.6 | 161.9 | 171.3 | 172.4 | |
| Aug. | 163.6 | 161.9 | 171.3 | 172.2 | |
| Sep. | 163.6 | 161.9 | 171.8 | 167.3 | |
| Oct. | 167.2 | 161.9 | 171.8 | 167.6 | |
| Nov. | 167.2 | 161.9 | 171.8 | 167.5 | |
| Dec. | 167.2 | 161.9 | 171.8 | 167.6 | |
| 2020 | Jan. | 167.2 | 165.9 | 171.8 | 167.8 |
| Feb. | 167.2 | 165.9 | 171.8 | 167.8 | |
| Mar. | 167.2 | 165.9 | 172 | 167.8 | |
| Apr. | 167.2 | 165.9 | 174.3 | 167.8 | |
| May | 167.2 | 165.9 | 174.3 | 167.9 | |
| Jun. | 167.2 | 166 | 174.3 | 167.9 | |
| Jul. | 167.2 | 166.7 | 174.6 | 167.7 | |
| Aug. | 167.2 | 166.5 | 174.6 | 167.5 | |
| Sep. | 167.2 | 166.5 | 177.2 | 170.3 | |
| Oct. | 170.3 | 166.4 | 177.2 | 170.7 | |
| Nov. | 170.3 | 166.4 | 177.4 | 170.7 | |
| Dec. | 170.3 | 166.4 | 177.4 | 170.7 | |
| 2021 | Jan. | 170.3 | 167.9 | 177.4 | 171 |
| Feb. | 170.3 | 167.9 | 177.4 | 171 | |
| Mar. | 170.3 | 167.9 | 177.5 | 171.1 | |
| Apr. | 170.3 | 167.9 | 183.5 | 171.1 | |
| May | 170.3 | 167.9 | 183.5 | 171.1 | |
| Jun. | 170.3 | 167.9 | 183.5 | 171 | |
| Jul. | 170.3 | 161.8 | 183.7 | 170.8 | |
| Aug. | 170.3 | 161.8 | 183.7 | 170.6 | |
| Sep. | 170.3 | 161.8 | 184.3 | 173.9 | |
| Oct. | 172.8 | 161.8 | 184.3 | 174.3 | |
| Nov. | 172.8 | 161.8 | 184.3 | 174.3 | |
| Dec. | 172.8 | 161.8 | 184.3 | 174.4 | |
| 2022 | Jan. | 172.8 | 162.7 | 184.3 | 174.3 |
| Feb. | 172.8 | 162.8 | 184.3 | 174.4 | |
| Mar. | 172.8 | 162.7 | 184.4 | 174.3 | |
| Apr. | 172.8 | 162.1 | 191.8 | 174.4 | |
| May | 172.8 | 162.1 | 191.8 | 174.5 | |
| Jun. | 172.8 | 162.1 | 191.8 | 174.4 | |
| Jul. | 172.8 | 165.1 | 191.8 | 174 | |
| Aug. | 172.8 | 165.1 | 191.8 | 173.8 | |
| Sep. | 172.8 | 166.8 | 194.5 | 178.4 | |
| Oct. | 179 | 167.3 | 194.5 | 178.7 | |
| Nov. | 179 | 167.3 | 194.5 | 178.7 | |
| Dec. | 179 | 167.3 | 194.5 | 178.7 | |
| Source: Statistics Canada, table 18-10-0004-01 - Consumer Price Index, monthly, not seasonally adjusted. | |||||
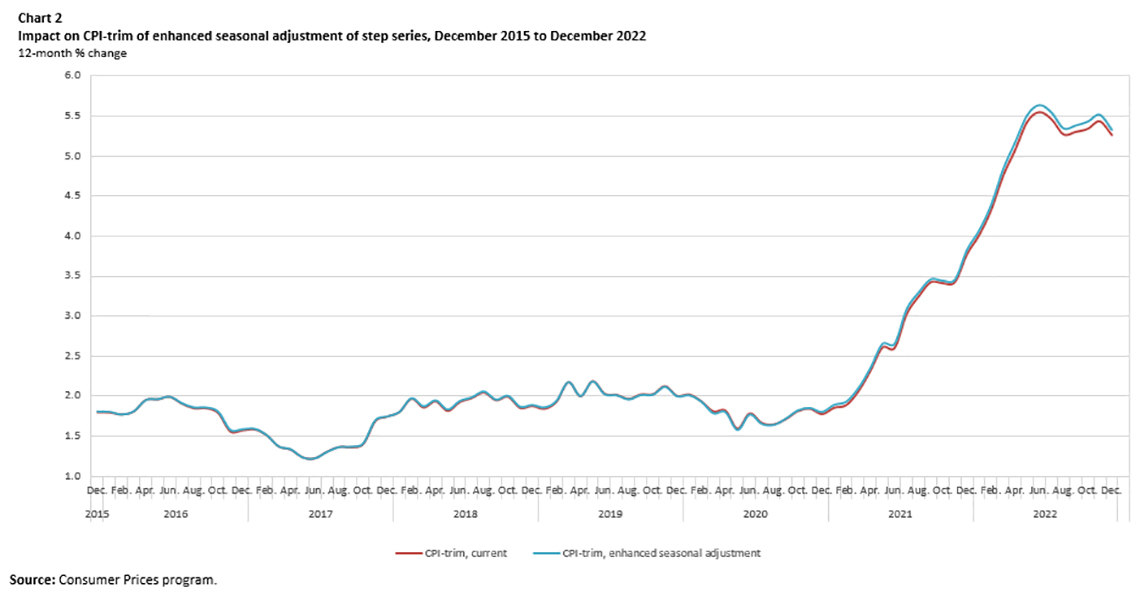
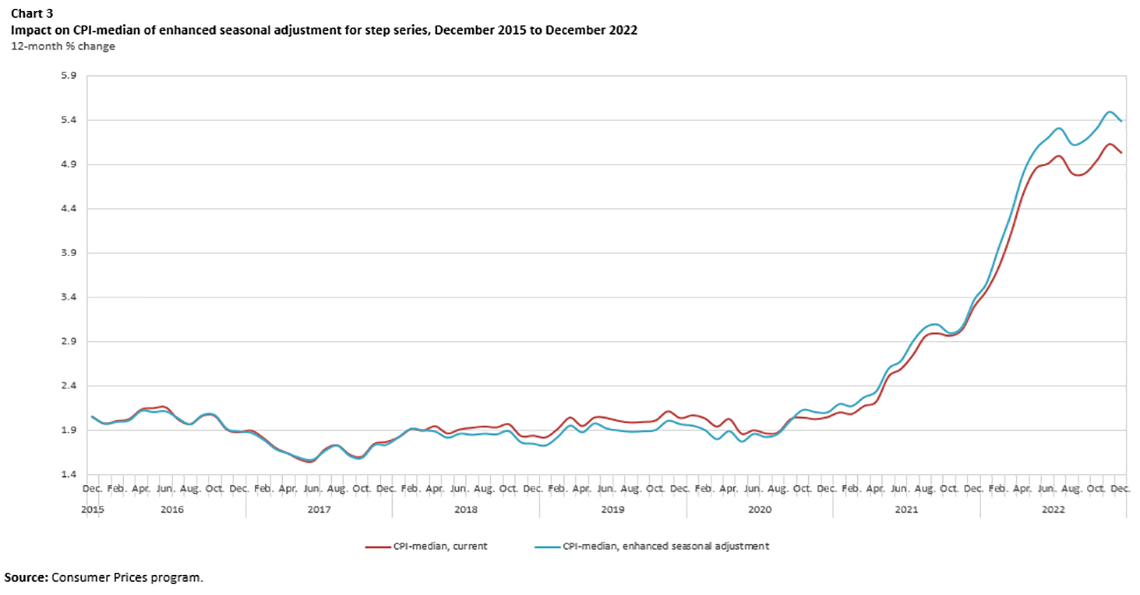
What is the impact of the enhancement?
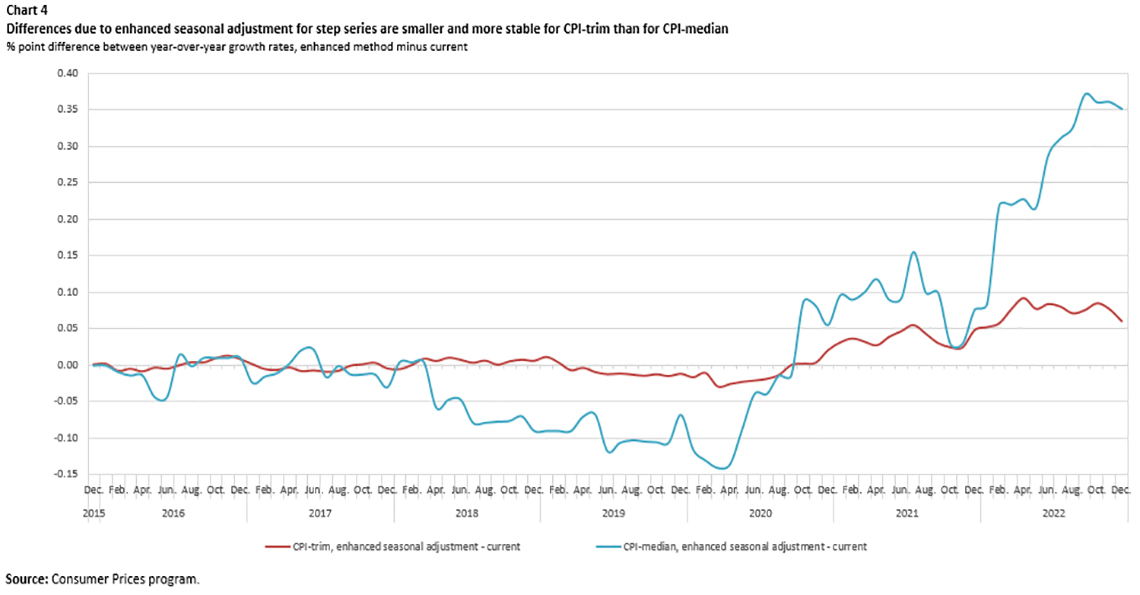
An analysis was conducted using the data released for the December 2022 core measures. Over the 84-month revision period, the impact of the modification to the seasonal adjustment method for step series varied on a monthly basis between -0.028 and +0.092 percentage points for the CPI-trim, and between -0.140 and +0.370 percentage points for the CPI-median. As illustrated in charts 2-4, The overall trends remained unchanged.
There is no impact on the All-items CPI, All-items CPI (seasonally adjusted) or the CPI-common.
It is important to note that the All-items CPI not seasonally adjusted series (Consumer Price Index, monthly, not seasonally adjusted) is not revised, nor seasonally adjusted, and therefore is not subject to the revisions detailed above.
The All-items CPI seasonally adjusted series (Consumer Price Index, monthly, seasonally adjusted) is also not affected by this enhancement because seasonal adjustment is performed at a higher level than the 55 CPI component-inputs to the core measures, following the aggregation of indexes that are not seasonally adjusted. Seasonal adjustment is performed on the All-items CPI, in addition to the eight major components, independently, for which traditional seasonal adjustment methods are optimal in the absence of step-series patterns.
The CPI-common measure of core inflation does not use seasonally adjusted data, and is thus not affected by the change.
Impact analysis charts
Description: Chart 2 - Impact on CPI-trim of enhanced seasonal adjustment of step series, December 2015 to December 2022
| CPI-trim, current | CPI-trim, enhanced seasonal adjustment | ||||
|---|---|---|---|---|---|
| 12-month % change | |||||
| 2015 | Dec. | 1.798921 | 1.800643 | ||
| 2016 | Jan. | 1.796617 | 1.799190 | ||
| Feb. | 1.772121 | 1.764928 | |||
| Mar. | 1.809152 | 1.804864 | |||
| Apr. | 1.952497 | 1.944652 | |||
| May | 1.960286 | 1.957635 | |||
| Jun. | 1.990498 | 1.986186 | |||
| Jul. | 1.905163 | 1.905628 | |||
| Aug. | 1.848476 | 1.853151 | |||
| Sep. | 1.848813 | 1.853213 | |||
| Oct. | 1.789098 | 1.799292 | |||
| Nov. | 1.559545 | 1.573039 | |||
| Dec. | 1.571893 | 1.580595 | |||
| 2017 | Jan. | 1.585164 | 1.586950 | ||
| Feb. | 1.514567 | 1.509918 | |||
| Mar. | 1.372983 | 1.367215 | |||
| Apr. | 1.333282 | 1.330765 | |||
| May | 1.235565 | 1.228044 | |||
| Jun. | 1.223923 | 1.217442 | |||
| Jul. | 1.306557 | 1.298094 | |||
| Aug. | 1.365388 | 1.358202 | |||
| Sep. | 1.362903 | 1.362886 | |||
| Oct. | 1.403123 | 1.404992 | |||
| Nov. | 1.688048 | 1.691929 | |||
| Dec. | 1.745262 | 1.741364 | |||
| 2018 | Jan. | 1.802465 | 1.797627 | ||
| Feb. | 1.966788 | 1.967619 | |||
| Mar. | 1.858894 | 1.868355 | |||
| Apr. | 1.934701 | 1.940951 | |||
| May | 1.816595 | 1.827392 | |||
| Jun. | 1.926166 | 1.934108 | |||
| Jul. | 1.976225 | 1.980156 | |||
| Aug. | 2.044910 | 2.051745 | |||
| Sep. | 1.949687 | 1.951019 | |||
| Oct. | 1.991952 | 1.997794 | |||
| Nov. | 1.853315 | 1.861428 | |||
| Dec. | 1.877490 | 1.884054 | |||
| 2019 | Jan. | 1.841715 | 1.853573 | ||
| Feb. | 1.930141 | 1.934278 | |||
| Mar. | 2.174784 | 2.168455 | |||
| Apr. | 1.998460 | 1.995482 | |||
| May | 2.186265 | 2.177439 | |||
| Jun. | 2.029293 | 2.017583 | |||
| Jul. | 2.015597 | 2.004818 | |||
| Aug. | 1.965489 | 1.953355 | |||
| Sep. | 2.022138 | 2.008404 | |||
| Oct. | 2.024671 | 2.012853 | |||
| Nov. | 2.124468 | 2.110340 | |||
| Dec. | 2.003229 | 1.992085 | |||
| 2020 | Jan. | 2.020303 | 2.004573 | ||
| Feb. | 1.936249 | 1.926248 | |||
| Mar. | 1.808957 | 1.780521 | |||
| Apr. | 1.819903 | 1.794826 | |||
| May | 1.594422 | 1.572336 | |||
| Jun. | 1.784051 | 1.763843 | |||
| Jul. | 1.666054 | 1.647988 | |||
| Aug. | 1.648049 | 1.635453 | |||
| Sep. | 1.713201 | 1.713946 | |||
| Oct. | 1.813752 | 1.816431 | |||
| Nov. | 1.841874 | 1.845841 | |||
| Dec. | 1.776275 | 1.797217 | |||
| 2021 | Jan. | 1.854619 | 1.886161 | ||
| Feb. | 1.888431 | 1.925423 | |||
| Mar. | 2.060559 | 2.093048 | |||
| Apr. | 2.316445 | 2.344129 | |||
| May | 2.607608 | 2.646845 | |||
| Jun. | 2.600015 | 2.646973 | |||
| Jul. | 3.023349 | 3.078551 | |||
| Aug. | 3.246401 | 3.289678 | |||
| Sep. | 3.422735 | 3.453382 | |||
| Oct. | 3.410778 | 3.435752 | |||
| Nov. | 3.424953 | 3.449884 | |||
| Dec. | 3.772249 | 3.820751 | |||
| 2022 | Jan. | 4.008979 | 4.061422 | ||
| Feb. | 4.324719 | 4.382364 | |||
| Mar. | 4.752281 | 4.829291 | |||
| Apr. | 5.076781 | 5.168717 | |||
| May | 5.428157 | 5.505363 | |||
| Jun. | 5.544976 | 5.628756 | |||
| Jul. | 5.456757 | 5.537062 | |||
| Aug. | 5.267646 | 5.338828 | |||
| Sep. | 5.298619 | 5.374260 | |||
| Oct. | 5.337995 | 5.422819 | |||
| Nov. | 5.431233 | 5.508166 | |||
| Dec. | 5.259411 | 5.319893 | |||
| Source: Consumer Prices program. | |||||
Description: Chart 3 - Impact on CPI-median of enhanced seasonal adjustment for step series, December 2015 to December 2022
| CPI-median, current | CPI-median, enhanced seasonal adjustment | ||||
|---|---|---|---|---|---|
| 12-month % change | |||||
| 2015 | Dec. | 2.054765 | 2.054765 | ||
| 2016 | Jan. | 1.977707 | 1.977707 | ||
| Feb. | 2.008347 | 1.999595 | |||
| Mar. | 2.028980 | 2.015468 | |||
| Apr. | 2.137827 | 2.124301 | |||
| May | 2.152824 | 2.109574 | |||
| Jun. | 2.161842 | 2.118588 | |||
| Jul. | 2.026714 | 2.040895 | |||
| Aug. | 1.972626 | 1.971713 | |||
| Sep. | 2.066314 | 2.076776 | |||
| Oct. | 2.065377 | 2.075839 | |||
| Nov. | 1.908945 | 1.919391 | |||
| Dec. | 1.881307 | 1.891750 | |||
| 2017 | Jan. | 1.898461 | 1.874690 | ||
| Feb. | 1.811288 | 1.796270 | |||
| Mar. | 1.700217 | 1.689960 | |||
| Apr. | 1.639477 | 1.642173 | |||
| May | 1.570418 | 1.591766 | |||
| Jun. | 1.552191 | 1.573535 | |||
| Jul. | 1.689544 | 1.673727 | |||
| Aug. | 1.732561 | 1.731786 | |||
| Sep. | 1.629374 | 1.617274 | |||
| Oct. | 1.604297 | 1.592200 | |||
| Nov. | 1.748889 | 1.736775 | |||
| Dec. | 1.771562 | 1.741779 | |||
| 2018 | Jan. | 1.823477 | 1.827866 | ||
| Feb. | 1.916134 | 1.920528 | |||
| Mar. | 1.899578 | 1.903971 | |||
| Apr. | 1.947955 | 1.890312 | |||
| May | 1.866856 | 1.820194 | |||
| Jun. | 1.913452 | 1.866769 | |||
| Jul. | 1.931949 | 1.853830 | |||
| Aug. | 1.945540 | 1.867411 | |||
| Sep. | 1.935439 | 1.858911 | |||
| Oct. | 1.970718 | 1.895141 | |||
| Nov. | 1.837997 | 1.768641 | |||
| Dec. | 1.842719 | 1.753373 | |||
| 2019 | Jan. | 1.822566 | 1.733237 | ||
| Feb. | 1.919356 | 1.829942 | |||
| Mar. | 2.046098 | 1.956574 | |||
| Apr. | 1.951358 | 1.881618 | |||
| May | 2.047899 | 1.980765 | |||
| Jun. | 2.041170 | 1.924034 | |||
| Jul. | 2.007940 | 1.902230 | |||
| Aug. | 1.990089 | 1.888033 | |||
| Sep. | 1.998629 | 1.894970 | |||
| Oct. | 2.014509 | 1.909857 | |||
| Nov. | 2.116959 | 2.011684 | |||
| Dec. | 2.040239 | 1.972770 | |||
| 2020 | Jan. | 2.072201 | 1.957133 | ||
| Feb. | 2.038270 | 1.908623 | |||
| Mar. | 1.944614 | 1.804732 | |||
| Apr. | 2.029569 | 1.894745 | |||
| May | 1.864151 | 1.777421 | |||
| Jun. | 1.903086 | 1.864265 | |||
| Jul. | 1.867345 | 1.828538 | |||
| Aug. | 1.880555 | 1.866829 | |||
| Sep. | 2.028321 | 2.014574 | |||
| Oct. | 2.046446 | 2.133852 | |||
| Nov. | 2.028868 | 2.110632 | |||
| Dec. | 2.050305 | 2.105705 | |||
| 2021 | Jan. | 2.104615 | 2.200554 | ||
| Feb. | 2.087020 | 2.176978 | |||
| Mar. | 2.177171 | 2.277610 | |||
| Apr. | 2.227432 | 2.345522 | |||
| May | 2.509732 | 2.599735 | |||
| Jun. | 2.593902 | 2.686006 | |||
| Jul. | 2.754149 | 2.909340 | |||
| Aug. | 2.964052 | 3.063700 | |||
| Sep. | 2.996702 | 3.096381 | |||
| Oct. | 2.970442 | 3.000204 | |||
| Nov. | 3.039351 | 3.069133 | |||
| Dec. | 3.300336 | 3.376876 | |||
| 2022 | Jan. | 3.480396 | 3.564328 | ||
| Feb. | 3.744460 | 3.963352 | |||
| Mar. | 4.125091 | 4.344786 | |||
| Apr. | 4.574449 | 4.801917 | |||
| May | 4.852742 | 5.068521 | |||
| Jun. | 4.912719 | 5.199994 | |||
| Jul. | 4.999449 | 5.309737 | |||
| Aug. | 4.803241 | 5.128372 | |||
| Sep. | 4.801767 | 5.172303 | |||
| Oct. | 4.948436 | 5.308136 | |||
| Nov. | 5.133249 | 5.493582 | |||
| Dec. | 5.039350 | 5.390177 | |||
| Source: Consumer Prices program. | |||||
Description: Chart 4 - Differences due to enhanced seasonal adjustment for step series are smaller and more stable for CPI-trim than for CPI-median
| CPI-trim, enhanced seasonal adjustment - current | CPI-median, enhanced seasonal adjustment - current | ||||
|---|---|---|---|---|---|
| % point difference between year-over-year growth rates, enhanced method minus current | |||||
| 2015 | Dec. | 0.001722 | -0.00000011 | ||
| 2016 | Jan. | 0.002573 | -0.00000016 | ||
| Feb. | -0.007193 | -0.008751 | |||
| Mar. | -0.004288 | -0.013512 | |||
| Apr. | -0.007845 | -0.013526 | |||
| May | -0.002651 | -0.043250 | |||
| Jun. | -0.004312 | -0.043254 | |||
| Jul. | 0.000465 | 0.014181 | |||
| Aug. | 0.004675 | -0.000913 | |||
| Sep. | 0.004400 | 0.010462 | |||
| Oct. | 0.010194 | 0.010462 | |||
| Nov. | 0.013494 | 0.010446 | |||
| Dec. | 0.008701 | 0.010443 | |||
| 2017 | Jan. | 0.001786 | -0.023770 | ||
| Feb. | -0.004649 | -0.015017 | |||
| Mar. | -0.005768 | -0.010258 | |||
| Apr. | -0.002518 | 0.002696 | |||
| May | -0.007520 | 0.021348 | |||
| Jun. | -0.006481 | 0.021344 | |||
| Jul. | -0.008463 | -0.015817 | |||
| Aug. | -0.007186 | -0.000775 | |||
| Sep. | -0.000017 | -0.012100 | |||
| Oct. | 0.001869 | -0.012097 | |||
| Nov. | 0.003880 | -0.012114 | |||
| Dec. | -0.003898 | -0.029783 | |||
| 2018 | Jan. | -0.004839 | 0.004390 | ||
| Feb. | 0.000831 | 0.004394 | |||
| Mar. | 0.009461 | 0.004393 | |||
| Apr. | 0.006251 | -0.057643 | |||
| May | 0.010798 | -0.046662 | |||
| Jun. | 0.007942 | -0.046683 | |||
| Jul. | 0.003931 | -0.078119 | |||
| Aug. | 0.006835 | -0.078129 | |||
| Sep. | 0.001332 | -0.076528 | |||
| Oct. | 0.005842 | -0.075577 | |||
| Nov. | 0.008114 | -0.069356 | |||
| Dec. | 0.006564 | -0.089346 | |||
| 2019 | Jan. | 0.011858 | -0.089328 | ||
| Feb. | 0.004138 | -0.089413 | |||
| Mar. | -0.006329 | -0.089525 | |||
| Apr. | -0.002978 | -0.069740 | |||
| May | -0.008826 | -0.067134 | |||
| Jun. | -0.011711 | -0.117136 | |||
| Jul. | -0.010779 | -0.105711 | |||
| Aug. | -0.012134 | -0.102056 | |||
| Sep. | -0.013734 | -0.103659 | |||
| Oct. | -0.011818 | -0.104653 | |||
| Nov. | -0.014128 | -0.105275 | |||
| Dec. | -0.011145 | -0.067469 | |||
| 2020 | Jan. | -0.015730 | -0.115068 | ||
| Feb. | -0.010000 | -0.129647 | |||
| Mar. | -0.028436 | -0.139882 | |||
| Apr. | -0.025077 | -0.134824 | |||
| May | -0.022086 | -0.086730 | |||
| Jun. | -0.020207 | -0.038821 | |||
| Jul. | -0.018066 | -0.038807 | |||
| Aug. | -0.012596 | -0.013727 | |||
| Sep. | 0.000745 | -0.013747 | |||
| Oct. | 0.002679 | 0.087406 | |||
| Nov. | 0.003967 | 0.081764 | |||
| Dec. | 0.020942 | 0.055400 | |||
| 2021 | Jan. | 0.031542 | 0.095939 | ||
| Feb. | 0.036992 | 0.089958 | |||
| Mar. | 0.032489 | 0.100439 | |||
| Apr. | 0.027684 | 0.118089 | |||
| May | 0.039237 | 0.090003 | |||
| Jun. | 0.046958 | 0.092104 | |||
| Jul. | 0.055202 | 0.155191 | |||
| Aug. | 0.043277 | 0.099648 | |||
| Sep. | 0.030647 | 0.099680 | |||
| Oct. | 0.024974 | 0.029762 | |||
| Nov. | 0.024930 | 0.029782 | |||
| Dec. | 0.048502 | 0.076540 | |||
| 2022 | Jan. | 0.052443 | 0.083931 | ||
| Feb. | 0.057645 | 0.218892 | |||
| Mar. | 0.077010 | 0.219695 | |||
| Apr. | 0.091936 | 0.227468 | |||
| May | 0.077206 | 0.215778 | |||
| Jun. | 0.083780 | 0.287274 | |||
| Jul. | 0.080306 | 0.310288 | |||
| Aug. | 0.071182 | 0.325131 | |||
| Sep. | 0.075642 | 0.370535 | |||
| Oct. | 0.084824 | 0.359700 | |||
| Nov. | 0.076933 | 0.360333 | |||
| Dec. | 0.060482 | 0.350827 | |||
| Source: Consumer Prices program. | |||||
For more information, please see section "revisions and seasonal adjustment" of Consumer Price Index: The Bank of Canada's Preferred Measures of Core Inflation Methodology Document (statcan.gc.ca) or A Comprehensive Evaluation of Measures of Core Inflation for Canada - Bank of Canada. If you have any questions or comments, please contact us at (statcan.cpddisseminationunit-dpcunitedediffusion.statcan@statcan.gc.ca).