
Table of contents
- Executive summary
- Introduction
- Data collection
- Response rates
- Response rate comparison to other GSS cycles
- Response rate comparison to international victimization surveys
- Minimizing errors and bias
- Data validation
- Mode effect
- Fitness for use statement
Executive summary
The General Social Survey – Canadians' Safety (Victimization) collects data on respondents' experiences with reported and unreported crime, domestic violence, and perceptions of law enforcement. It is collected every five years in the provinces and territories, using electronic self-response, telephone follow-ups and, in the territories, face-to-face interviews for this last iteration in 2019.
The 2019 GSS has a lower response rate when compared with other general social surveys and victimization surveys from other countries. However, this can be explained at least in part by collection methods (electronic self-response and telephone collection in Canada versus personal interviews elsewhere).
Statistics Canada applied rigorous data treatment and validation procedures to verify that the lower response rate did not affect the data quality significantly. These procedures, which included data editing, weighting and comparisons with previous iterations and other surveys' results, ensured that the data produced are representative of the Canadian population and are fit for use.
Introduction
The 2019 General Social Survey – Canadians' Safety (Victimization) is the seventh iteration of its kind, the first taking place in 1988 and recurring every five years since then. The survey has undergone numerous revisions, with the current version being a 45-minute survey (average) that collects data on people's:
- perceptions of crime, safety, and law enforcement
- efforts to protect themselves from crime
- experiences with crime and intimate partner violence
- history of child neglect and abuse
- alcohol and drug use, homelessness, economic well-being
- experiences with discrimination
These data were collected together with various demographic variables. The income variables were derived from respondents' taxation data.
The data were released in two files: Main and Incident. The Incident file includes data pertaining to specific crimes, not committed by a current or previous spouse or partner, that the respondent fell victim to in the twelve months prior to completing the survey. The Main file includes all other data, including violence by the current or former spouse or partner.
The 2019 GSS (Victimization) had a response rate of 36.4% for the provinces (41.0% for main sample including the Alberta oversample, and 21.2% for the Indigenous oversample), lower than earlier cycles on Victimization, and other cycles of the GSS. To address the lower response rate, Statistics Canada applied sound statistical methods and thorough validation practices in the production and release of GSS estimates to reduce the risk of statistical bias (please see the "Minimizing errors and bias" and "Data validation" sections for details). Based on these statistical adjustments and techniques, Statistics Canada deemed the data of the 2019 GSS fit for use. Nevertheless, data users must take into consideration that estimates for certain types of crimes reported by a smaller portion of the sample, or for smaller geographical areas, may be subject to higher sampling error and higher risks of bias.
This technical note provides information on the quality of the data from the 2019 GSS, and on the various adjustment methods and validation strategies used by Statistics Canada to ensure these data are fit-for-use.
Data collection
For the first time, Victimization offered respondents the option to complete the survey online. Selected households whose telephone numbers had an associated address were mailed an invitation letter advising who in the household was selected to complete the survey, plus a unique code to log in and complete the survey online. Respondents who did not complete the survey by the deadline, and households whose telephone numbers did not have an associated address, were then called to complete the survey with an interviewer over the phone. This collection method was used province-wide and in the territorial capitals. Territorial regions outside of the capitals, and households in territorial capitals that did not respond to the online or telephone collection, were invited to complete the survey during a face-to-face interview in which the interviewer used a computer to record their answers.
Collection in the provinces took place between April 15, 2019 and March 31, 2020. Telephone collection ended March 15, 2020 when Statistics Canada call centres closed due to the COVID-19 outbreak. However, online questionnaires could still be submitted until March 31st.
Telephone and online collection in the territories began June 3, 2019, switched to face-to-face interviews (known as Computer Assisted Personal Interviews (CAPI)) September 9, 2019, and ended as scheduled on March 13, 2020.
In the provinces, almost 60% of the respondents completed the survey via the online questionnaire, an increase compared to previous GSS cycles. Approximately half of the respondents in the territories completed the survey via face-to-face interviews, with the other half split evenly between telephone and online collection.
Response rates
The overall response rate for the provinces was 36.4%. In the territories, the overall response rate was 57.0%.
The targeted number of respondents for the 2019 GSS was 25,035 while the actual number of respondents was 20,454 . In the territories, the target was 2,080 while the actual number of respondents was 1,958.
The graph below shows the response rate by province, region (provincial groupings for smaller provinces) and the territories (grouped). It also separates, among the provinces, the regular sample from the Indigenous oversample. As can be seen, the regular portion of the provincial sample had higher response rates overall, with Quebec the highest at 52.2%. There is little variability between the provinces/regions for the Indigenous oversample rates, ranging from 18.1% in Quebec to 23.8% in the Prairies.
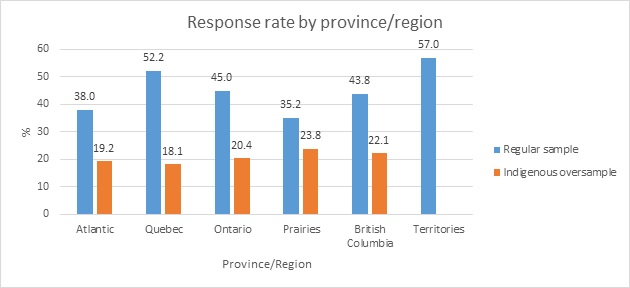
Description Figure 1 – Response rate by province/region
| Province/Region | Regular sample (%) | Indigenous Sample (%) |
|---|---|---|
| Atlantic | 38.0 | 19.2 |
| Quebec | 52.2 | 18.1 |
| Ontario | 45.0 | 20.4 |
| Prairies | 35.2 | 23.8 |
| British Columbia | 43.8 | 22.1 |
| Territories | 57.0 |
Response rate comparison to other GSS cycles
The General Social Survey's response rates have been trending downward for the past ten cycles. One contributing factor is a change to the sampling frame used by the GSS that may have had an impact on response rates over time. Response rates from 2013 to present are not directly comparable to response rates from 2012 and earlier. In 2013, a new frame was used to select the sample, which necessitated modifications in how the response rates are calculated. The new frame also includes households that only have cell phones, which was not the case with the old frame. This was essential because the number of homes with only cell phones was constantly growing and coverage had been steadily declining with the previous frame. Adding these households to the frame ensured more complete coverage of Canadian households. While this improved coverage by increasing the number of households that qualify to participate in the survey, these homes have also been harder to reach. One difficulty is that cell phones are linked to an individual, not a household, making it harder to reach the selected respondent should that person not be who the cell is attached to (and the cell owner will not provide the contact information). The difficulties reaching households contribute to decreasing response rates.
The response rates in the graph below represent provincial collection only. Only provincial rates for Victimization are used in this section because other GSS cycles do not collect in the territories. Note that, if not for the Indigenous oversample, Victimization's provincial response rate (41.0%) would be similar to that of Giving, Volunteering, and Participating (41.9%).
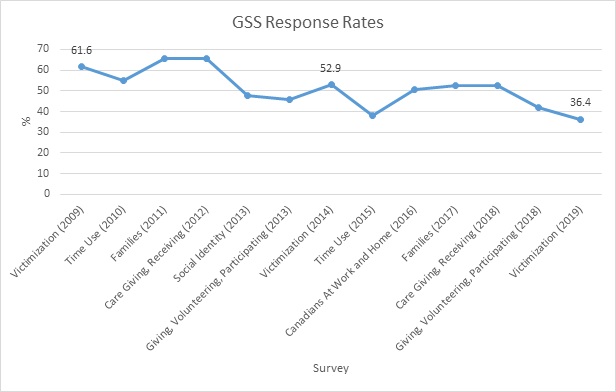
Description Figure 2 – GSS Response Rates
| Survey | Response Rate (%) |
|---|---|
| Victimization (2009) | 61.6 |
| Time Use (2010) | 55.2 |
| Families (2011) | 65.8 |
| Care Giving Receiving (2012) | 65.7 |
| Social Identity (2013) | 48.0 |
| Giving, Volunteering, Participating (2013) | 46.0 |
| Victimization (2014) | 52.9 |
| Time Use (2015) | 38.0 |
| Canadaians At Work and Home (2016) | 50.8 |
| Families (2017) | 52.4 |
| Care Giving Receiving (2018) | 52.8 |
| Giving, Volunteering, Participating (2018) | 41.9 |
| Victimization (2019) | 36.4 |
For the territorial sample (response rate = 57%), the comparability of the response rate over time is affected by the capacity of resolving cases during collection. First, GSS 2019 selected households that were recently included in the Labour Force Survey (thus households with recently confirmed contact information), maximizing the likelihood of making contact. As well, proportionally more units were handled by Computer Assisted Personal Interviews (CAPI) in 2019 and 2014 than previous iterations. This allowed for much more potential to complete interviews and resolve cases.
Response rate comparison to international victimization surveys
The chart below outlines response rates for similar Victimization surveys in other countries. For this report, only surveys belonging to either English or French speaking nations were selected for comparison.
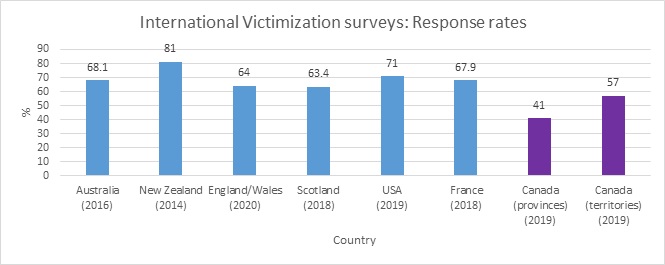
Description Figure 3 – International Victimization survey: Response rates
| Country | Response Rate (%) |
|---|---|
| Australia (2016) | 68.1 |
| New Zealand (2014) | 81.0 |
| English/Wales (2020) | 64.0 |
| Scotland (2018) | 63.4 |
| USA (2019) | 71.0 |
| France (2018) | 67.9 |
| Canada(provinces) (2019) | 41.0 |
| Canada (territories) (2019) | 57.0 |
As can be seen, the response rates for the 2019 GSS are lower than those for other English and French Victimization surveys. However, it is important to note that the collection method may play a significant role in the differing rates. The 2019 GSS relied on electronic self-response and telephone follow-ups to collect data in the provinces. The lack of personal contact with interviewers and respondents' ability to screen callers using Caller ID can make it easier for potential respondents to avoid the interview request. The same collection methods were used in the territorial capitals, but face-to-face interviews were also conducted in the more remote areas. Each of the other countries in the chart above collected data using face-to-face interviews. France and Australia also used electronic self-response, but for specific modules or if the respondent requested that method.
Canada's response rate is closer to those seen internationally when comparing only face-to-face collection methods. In spite of that, collection in the territories is a challenge because of its smaller population compared to the provinces. To ensure a representative sample, a high percentage of the population must be asked to participate. In the lesser populated territories, this means that the same respondents may be selected for multiple surveys within a short time period. This can lead to respondent fatigue, and thus lower response rates.
Minimizing errors and bias
There are two types of survey errors: sampling error and non-sampling error. Sampling error arises from estimating a population characteristic by measuring only a portion of the population rather than the entire population. Non-sampling errors include nonresponse errors which can lead to biased estimates when the characteristics of respondents and non-respondents are different.
With respect to non-sampling errors, various steps are in place at Statistics Canada to minimize bias in surveys. For example, for the 2019 GSS, significant effort was made to minimize bias by using a well-tested questionnaire, interviewers who received specialized trained in the victimization subject matter and in addressing sensitive content, and by following up with households that did not initially respond to the survey.
In addition, a proven methodology was used to offset the risk of nonresponse bias and to ensure that 2019 GSS data would be fit to provide quality estimates at the national and regional (Atlantic, Quebec, Ontario, Prairies, British Columbia, Territories) levels.
The main method used to reduce nonresponse bias for the 2019 GSS involved a series of adjustments to the survey weights to account for nonresponse as much as possible. For all GSS cycles, weighting adjustments make use of known characteristics about the non-respondents, from the survey frame for example, to create response homogeneity groups that are used to adjust initial design weights for nonresponse. Administrative data sources are also used to provide useful information about non-responding households and to reduce the potential of nonresponse bias.
As is the case with most household surveys, once all nonresponse weighting adjustments presented above were completed for the 2019 GSS, a final weighting step was applied to adjust the weights to known population counts for province by age group and sex. This weight calibration ensured that known population counts were respected for key demographic variables when weighted data are used. For example, even though nonresponse was higher in the Prairies, this calibration step ensured that the Prairies population is accurately represented when survey weights are used to produce estimates. Finally, additional analyses are done on the final weights to look at the distribution, outliers and design effect.
Data validation
Once the final set of provincial weights (including the oversample) and territorial weights for the 2019 GSS were derived, the survey estimates were validated in accordance with Statistics Canada's standards on data validation and quality assurance. Key estimates were examined at the national and provincial/territorial levels by comparing them with internal and external benchmarks. This exercise was used to assess the fitness for use of the data and potential nonresponse bias. Nonresponse bias occurs in statistical surveys if the answers of respondents differ from the potential answers of those who did not answer.
The validation exercise included comparing respondents' demographic characteristics with those in the 2016 Census of Population, the 2018 Survey on Safety in Public and Private Spaces (SSPPS), and the 2014 GSS on Canadians' Safety. It also compared data for selected crime screener, conjugal violence, child abuse, homelessness, and disability indicators. Overall, the 2019 GSS weighted results were similar to other data sources. However, some differences were noted and attributed to a mode effect. More information on this is presented in the next section.
Due to Statistics Canada's robust practices in addressing non-response bias, calibrating survey weights, and data validation, Statistics Canada has confidence in the quality of the data disseminated from the 2019 GSS and assures that the data are fit for use. However, the quality of the estimates for some population groups such as the Indigenous population and smaller geographic areas may be impacted by the lower than expected response rate.
Mode effect
The 2019 GSS on Canadians' Safety (Victimization) offered for the first time an Internet option to survey respondents. This new approach to data collection was in recognition of the need to adapt to the changing use of technology and the ever present demands on Canadians' time. By having both telephone and Internet modes of data collection in the provinces, the 2019 GSS offered survey respondents greater flexibility and convenience in providing key and vital information to Statistics Canada.
It is impossible to determine with certainty whether, and to what extent, differences in a variable are attributable to an actual change in the population or to changes in the survey methodology. However, there are reasons to believe that the use of an electronic questionnaire might have an impact on the estimations and this impact is called mode effect. Several studies have shown that questions with social desirability, as opposed to factual questions, are at greater risk. Similar observations have been made with the GSS 2019 in the provinces. For example, the 2019 GSS has a lower percentage of respondents reporting experiencing psychological violence or financial exploitation by a current or former spouse/partner than the 2014 GSS. The 2019 GSS also has a lower percentage of respondents reporting having experienced physical or sexual violence by a current spouse/partner, harsh parenting, or child abuse than the 2014 GSS.
It is possible that differences could be due to reasons other than mode effect, such as selection bias, non-response bias or non-sampling errors. At every stage of processing, verification and dissemination, considerable effort was made to produce data that are as precise in their level of detail, and to ensure that the published estimates are of good quality in keeping with Statistics Canada standards. However, because of these changes, it is not appropriate to compare results from the 2019 GSS with previous iterations, or at the very least such comparisons must be accompanied with a warning.
Fitness for use statement
The robust methods used to reduce errors and bias, and to validate the data, allow Statistics Canada to have confidence in the quality of the data it disseminates. As such, data from the 2019 GSS are deemed fit for use.
Statistics Canada addressed the potential bias due to nonresponse by performing weight adjustments using known characteristics from the non-respondents and by calibrating the survey weights to known population totals for key demographic variables. Statistics Canada also validated key survey estimates at the national, provincial and territorial levels to other data sources in accordance with its own standards on data validation.
By applying appropriate nonresponse adjustment and calibration to survey weights, and by validating key survey estimates against several other data sources, Statistics Canada has endeavoured to ensure that data from the 2019 GSS are fit for use. However, the quality of the estimates for some population groups such as the Indigenous population and smaller geographic areas may be impacted by the lower than expected response rate.