
Business performance and ownership Statistics

Find data on
 Business dynamics
 Business ownership
 Financial statements and performance
 Governance and sustainability
Key indicators
Selected geographical area: ~ ' ' ~ Canada ~ ''; ?>
-
$209.9 billion
-
$2.6 trillion
-
13.9 %
Features


Representation of women on boards of directors
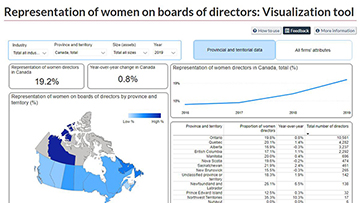
The Representation of women on boards of directors: Visualization tool provides access to data that highlight women in leadership and strategic decision-making roles within corporations conducting business in Canada. It allows the user to compare and analyze data based on industry, size (assets), province, country of control and type of corporation.
Quarterly Survey of Financial Statistics
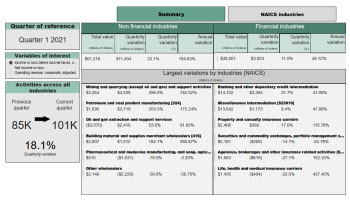
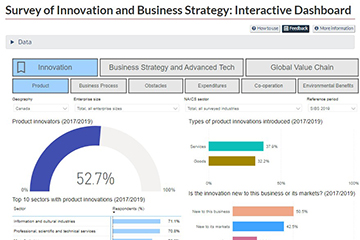
The Quarterly Survey of Financial Statistics: Visualization Tool includes information collected as part of the Quarterly Financial Statistics for Enterprises program, which provides data used to measure the financial position and performance of incorporated businesses by industry aggregations.
Activities of multinational enterprises
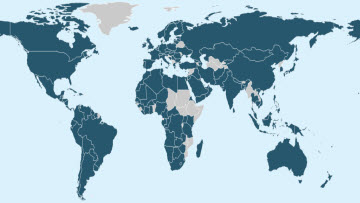
The interactive tool presents information on activities of multinational enterprises at the international and national level. At the international level, users can see the importance of foreign multinationals on the Canadian economy as well as the similar role of Canadian multinationals in foreign economies, by country.
Securities statistics

Quarterly statistics on issues and holdings of securities. Data presented by numerous dimensions including sector, currency, original maturity, type of interest rate and market of issuance. Definitions, concepts and presentations used are consistent with the recommendations of the Handbook on Securities Statistics, an internationally agreed framework for classifying these instruments.
Create a report to view financial performance data by industry
With Financial Performance Data you can view financial data based on industry averages, with an option to include your own income statement and balance sheet information in the report.
Feedback
What do you want to see on this page? Email infostats@statcan.gc.ca to let us know.