Telecommunications Statistics

Telecommunications: Connecting Canadians
Find additional data
Browse Statistics Canada's published data and analysis on the telecommunications industry.
Connecting Canadians: Telecommunications in Canada
Economic measures

This section provides estimates of the economic impact of the mobile telecommunications industry using the input-output model for output, jobs and value added to gross domestic product (GDP).
Share of gross domestic product
In 2022, the gross value added of the mobile telecommunication industry represented 1.1% of Canada's gross domestic product at basic prices. This includes value added from the industry itself, its supply chain and impacts on spending from wages generated by the production (directly and indirectly) of the industry. More information on share of gross domestic product
Output
In 2023, the total output generated by the mobile telecommunications industry was 53.1 billion dollars. This includes revenue from the industry itself, its supply chain and impacts on spending from wages generated by the production (directly and indirectly) of the industry. More information on output
Gross value added
Gross value added is a measure of the contribution to gross domestic product (GDP). The contribution to GDP by the mobile telecommunication industry was 31.2 billion dollars in 2023. This includes value added from the industry itself, its supply chain and impacts on spending from wages generated by the production (directly and indirectly) of the industry. More information on gross value added
Jobs
In 2023, the number of jobs created by the mobile telecommunications industry is estimated to be 156,600. This includes jobs created by the industry itself, its supply chain and impacts on spending from wages generated by the production (directly and indirectly) of the industry. More information on jobs
Spending and prices for cellular services

This section includes information on the amount spent by households and the prices paid by consumers for cellular services.
Monthly spending on cell phone services
In 2023, households across all income quintiles spent approximately $125 per month on cell phone and pager services or 1.8% of total monthly expenditures after tax. More information on monthly spending on cell phone services
More information on monthly spending on cell phone services
| All quintiles | Lowest quintile | Second quintile | Third quintile | Fourth quintile | Highest quintile | |
|---|---|---|---|---|---|---|
| Total monthly expenditures after tax | $7,045.33 | $3,448.08 | $5,110.67 | $6,558.17 | $8,363.92 | $11,720.83 |
| Monthly expenditure on cell phone and pager services | $125.33 | $69.33 | $100.00 | $128.92 | $151.67 | $176.67 |
| Cell phone and pager services expenditure as a percentage of total expenditures | 1.8% | 2.0% | 2.0% | 2.0% | 1.8% | 1.5% |
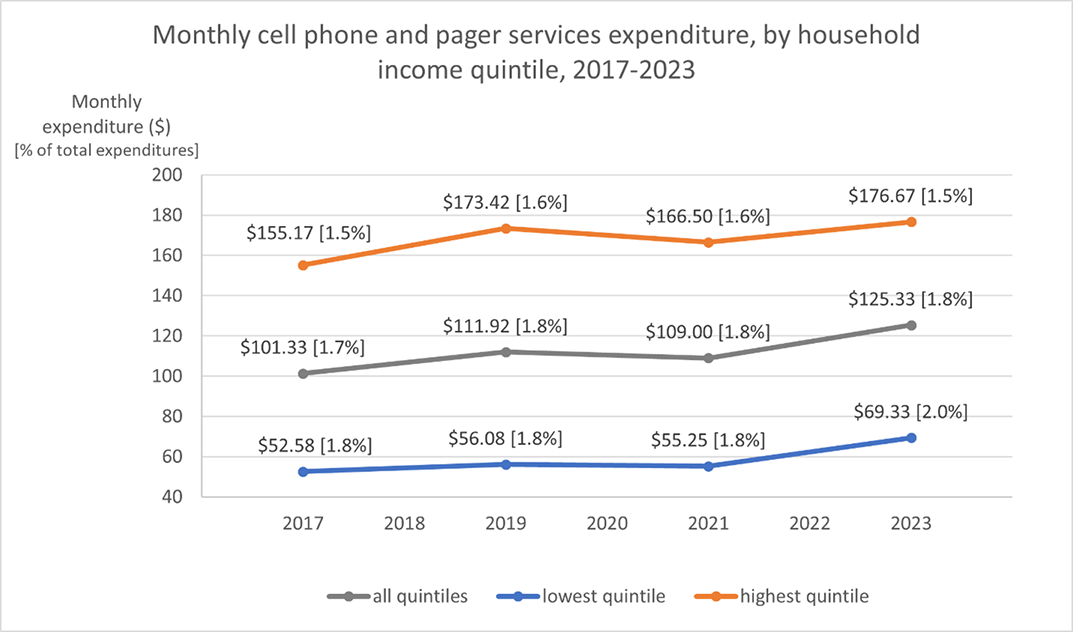
Description - Monthly cell phone and pager services expenditure, by household income quintile, 2017-2023
- This is a line graph that shows monthly average expenditures for cell phone and pager services based on the lowest, highest and all household income quintiles from 2017 to 2023. The data labels display the values in Canadian dollars, with the percentage of total expenditures shown in brackets.
- It has a vertical axis showing the monthly expenditures for cell phone and pager services, ranging from $40 to $200 in increments of $20.
- It has a horizontal axis showing years, from 2017 to 2023 in one year increments.
- The lines show that in 2017 the average monthly expenditure for cell phone and pager services was $101.33 (1.7%) across all quintiles and increased to an average of $125.33 (1.8%) in 2023.
- The three most recent data points for average monthly expenditure for cell phone and pager services are $176.67 (1.5%) for the highest quintile, $69.33 (2.0%) for the lowest quintile and $125.00 (1.8%) across all quintiles in 2023.
What is it?
Monthly spending on cell phone services as a percentage of total expenditure is monthly cell phone and pager services expenditure divided by total monthly expenditures after tax and expressed as a percentage.
Expenditures refer to the values of the amounts that buyers pay, or agree to pay, to sellers in exchange for goods or services that sellers provide to them or to other institutional units designated by the buyers. The buyer incurring the liability to pay need not be the same unit that takes possession of the good or service. It is common for government units or non-profit institutions serving households to pay for goods or services that the sellers provide to households.
Household refers to a person or group of persons who occupy the same dwelling and do not have a usual place of residence elsewhere in Canada or abroad. The dwelling may be either a collective dwelling or a private dwelling. The household may consist of a family group such as a census family, of two or more families sharing a dwelling, of a group of unrelated persons or of a person living alone. Household members who are temporarily absent on reference day are considered part of their usual household.
Income used in the survey of household spending is from the previous year. For example, reference year 2019 uses revenues from 2018.
Last updated: August 2025
Source:
Table: 11-10-0223-01, Household spending by household income quintile, Canada, regions and provinces
Other information:
Innovation, Science and Economic Development Canada - More affordable telecom services
This webpage provides information that helps Canadian consumers make informed decisions on mobile and wireless services. It includes service plans price comparisons (talk, text and data) for different mobile service providers for each province.
Monthly change in the cellular services price index
Consumer prices for cellular services decreased by 2.6% in May 2026 compared to May 2025. More information on monthly change in the cellular services price index
Annual average change in the cellular services price index
On an annual average basis, consumer prices for cellular services declined 1.7% from 2024 to 2025, while the all-items Consumer Price Index (CPI) increased 2.0% over the same period.
More information on annual average change in the cellular services price index
More information on annual average change in the cellular services price index
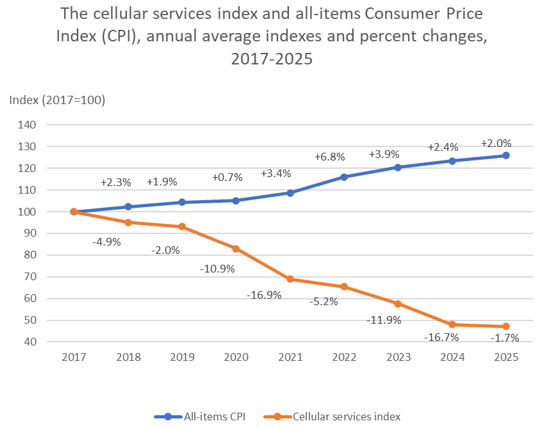
Description - The cellular services index and all-items Consumer Price Index (CPI), annual average indexes and percent changes, 2017-2025
- The title of the chart is "The cellular services index and all-items Consumer Price Index (CPI), annual average indexes and percent changes, 2017-2025."
- This line chart illustrates how the annual average cellular services index and the annual average all-items CPI have changed over time.
- The two index lines are presented with an index reference period of 2017=100.
- The horizontal axis displays the years, from 2017 to 2025, by increments of one year.
- The vertical axis displays the index values for both series, ranging from 40 to 140, in increments of 10.
- Annual average percent changes between consecutive years are indicated beside the corresponding line segments.
- From 2017 to 2025, the cellular services index declined from 100.0 to 47.2 (-52.8%). During the same period, the all-items CPI rose from 100.0 to 125.9 (+25.9%).
- Between the two most recent years in the chart (2024 to 2025), the cellular services index fell from 48.0 to 47.2 (-1.7%) and the all-items CPI increased from 123.4 to 125.9 (+2.0%).
What is it?
The cellular services index measures the change in prices experienced by consumers for cellular services. These services include local and long distance voice calls, text messaging and internet access on a cellular device. The index is part of the telephone services sub-group of the Consumer Price Index (CPI).
To display both indexes with the same reference period in the chart, the all-items CPI line uses a reference period of 2017=100, which differs from other publications.
Due to rounding, the values in the chart may not match the values in other publications.
Last updated: May 2026
Source:
Table 18-10-0005-01, Consumer Price Index, annual average, not seasonally adjusted
Spending and prices for Internet access services

This section includes information on the amount spent by households and the prices paid by consumers for Internet access services.
Monthly spending on Internet access services
In 2023, households across all income quintiles spent approximately $87 per month on Internet access services or 1.2% of total monthly expenditures after tax. More information on monthly spending on Internet access services
More information on monthly spending on Internet access services
| All quintiles | Lowest quintile | Second quintile | Third quintile | Fourth quintile | Highest quintile | |
|---|---|---|---|---|---|---|
| Total monthly expenditures after tax | $7,045.33 | $3,448.08 | $5,110.67 | $6,558.17 | $8,363.92 | $11,720.83 |
| Monthly expenditure on Internet access services | $87.00 | $65.58 | $83.67 | $89.17 | $93.67 | $102.92 |
| Internet access services expenditure as a percentage of total expenditures | 1.2% | 1.9% | 1.6% | 1.4% | 1.1% | 0.9% |

Description - Monthly Internet access services expenditure, by household income quintile, 2017-2023
- This is a line graph that shows monthly average expenditure for Internet access services based on the lowest, highest and all household income quintiles from 2017 to 2023. The data labels display the values in Canadian dollars, with the percentage of total expenditures shown in brackets.
- It has a vertical axis showing the monthly expenditure for Internet access services, ranging from $30 to $110 in increments of $10.
- It has a horizontal axis showing years, from 2017 to 2023 in one year increments.
- The lines show that in 2017 the average monthly expenditure for Internet access services was $54.17 (0.9%) across all quintiles and increased to an average of $87.00 (1.2%) in 2023.
- The three most recent data points for average monthly expenditure for Internet access services are $102.92 (0.9%) for the highest quintile, $65.58 (1.9%) for the lowest quintile and $87.00 (1.2%) across all quintiles in 2023.
What is it?
Monthly spending on Internet access services as a percentage of total expenditure is monthly Internet access services expenditure divided by total monthly expenditure after tax and expressed as a percentage.
Expenditures refer to the values of the amounts that buyers pay, or agree to pay, to sellers in exchange for goods or services that sellers provide to them or to other institutional units designated by the buyers. The buyer incurring the liability to pay need not be the same unit that takes possession of the good or service. It is common for government units or non-profit institutions serving households to pay for goods or services that the sellers provide to households.
Household refers to a person or group of persons who occupy the same dwelling and do not have a usual place of residence elsewhere in Canada or abroad. The dwelling may be either a collective dwelling or a private dwelling. The household may consist of a family group such as a census family, of two or more families sharing a dwelling, of a group of unrelated persons or of a person living alone. Household members who are temporarily absent on reference day are considered part of their usual household.
Income used in the survey of household spending is from the previous year. For example, reference year 2019 uses revenues from 2018.
Last updated: August 2025
Source:
Table 11-10-0223-01, Household spending by household income quintile, Canada, regions and provinces
Monthly change in the Internet access services price index
Consumer prices for Internet access services increased by 0.3% in May 2026 compared to May 2025. More information on monthly change in the Internet access services price index
Annual average change in the Internet access services price index
On an annual average basis, consumer prices for Internet access services increased 2.9% from 2024 to 2025, while the all-items Consumer Price Index (CPI) increased 2.0% over the same period.
More information on annual average change in the Internet access services price index
More information on annual average change in the Internet access services price index
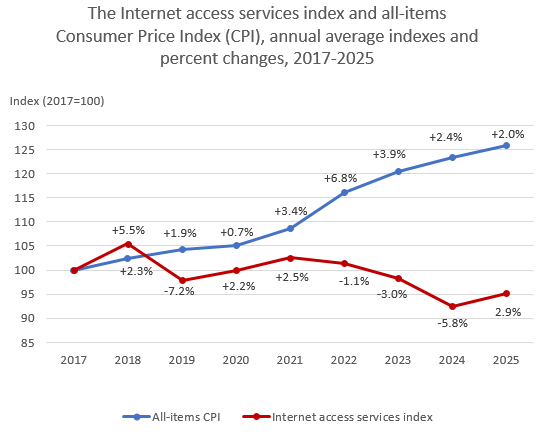
Description - The Internet access services index and all-items Consumer Price Index (CPI), annual average indexes and percent changes, 2017-2025
- The title of the chart is “The Internet access services index and all-items Consumer Price Index (CPI), annual average indexes and percent changes, 2017-2025.”
- This line chart illustrates how the annual average Internet access services index and the annual average all-items CPI have changed over time.
- The two index lines are presented with an index reference period of 2017=100.
- The horizontal axis displays the years, from 2017 to 2025, by increments of one year.
- The vertical axis displays the index values for both series, ranging from 85 to 130, in increments of 5.
- Annual average percent changes between consecutive years are indicated beside the corresponding line segments.
- From 2017 to 2025, the Internet access services index decreased from 100.0 to 95.2 (-4.8%). During the same period, the all-items CPI rose from 100.0 to 125.9 (+25.9%).
- Between the two most recent years in the chart (2024 to 2025), the Internet access services index increased from 92.6 to 95.2 (+2.9%) and the all-items CPI increased from 123.4 to 125.9 (+2.0%).
What is it?
The Internet access services index measures, through time, the cost of a constant level of Internet access purchased by consumers. The current consumer profiles used to track prices reflect the most popular types of high-speed services. The index is part of the communications sub-group of the Consumer Price Index (CPI).
To display both indexes with the same reference period in the chart, both indexes use a reference period of 2017=100, which differs from other publications.
Due to rounding, the values in the chart may not match the values in other publications.
Last updated: May 2026
Source:
Table 18-10-0005-01, Consumer Price Index, annual average, not seasonally adjusted
Labour

This section provides information on earnings, employment, and trends in education levels and labour productivity in the telecommunications sector.
Employment level
In 2025, the wired and wireless telecommunications industry employed 90,161 people. More information
More information on employment level
![Number of employees, wired and wireless telecommunications carriers (except satellite) [NAICS - 5173], 2020-2025](/sites/default/files/images/2026-05/subject-telecom_employees_2025-en.png)
Description - Number of employees, wired and wireless telecommunications carriers (except satellite) [NAICS - 5173], 2020-2025
- This is a line graph that shows employment level in the wired and wireless telecommunications carriers (except satellite) industry based on the 2022 North American Industry Classification System (NAICS).
- It has a horizontal axis showing the years, 2020 to 2025 in 1-year increments.
- It has a vertical axis showing the employee counts, from 80,000 to 105,000 in 5,000 (number of employees) increments.
- The bars show that in 2020 there were 101,842 employees in the wired and wireless telecommunications carriers (except satellite) industry, and there were 90,161 employees in 2025. The bars show that employees in this industry is decreasing over the years.
- The three most recent data points for the employment level in the wired and wireless telecommunications carriers (except satellite) industry was 100,640 in 2023, and 95,904 in 2024, and 90,161 in 2025.
What is it?
Employees
Persons receiving pay for services rendered in Canada or for an employer paid absence, and for whom the employer is require to complete a Canada Revenue Agency T4 slip. These persons may work on a full-time, part-time, casual or temporary basis.
Employee count in this graph is the sum of employees paid by the hour, salaried employees and other employees.Wired and wireless telecommunications carriers (except satellite) (NAICS 5173)
This industry group comprises establishments primarily engaged in providing telecommunications and video entertainment services to their customer premises and/or to mobile telecommunication devices over network facilities operated by them. These establishments can own a network, lease a network or combine leased and owned facilities and their networks can integrate various technologies.
Source: May 2026
Source:
- Survey of Employees Payroll and Hours
- Table 14-10-0202-01 Employment by Industry, Annual
Average weekly earnings
In 2025, the average weekly earnings for the wired and wireless telecommunications industry was $1,751, or $91,043 on an annual basis. This is higher than the service industry average weekly earnings of $1,248, or $64,888 on an annual basis. More information on average weekly earnings
More information on average weekly earnings
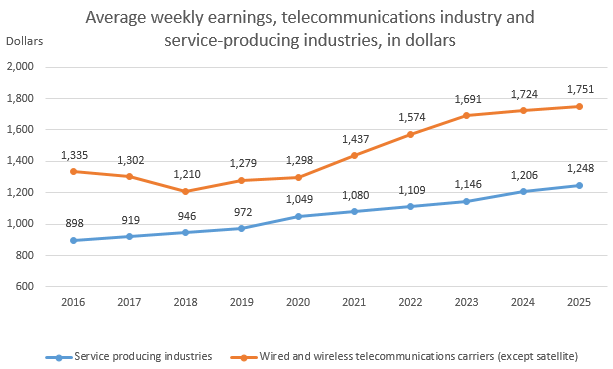
Description - Average weekly earnings, telecommunications industry and service-producing industries, in dollars 2016-2025
- This is a line chart that shows the average weekly earnings for workers services industries and wired and wireless telecommunications carriers (except Satellite) over time.
- It has a vertical axis showing the dollar amount, from 600 to 2,000 dollars in 200-dollar increments.
- It has a horizontal axis showing years, 2016 to 2025 in 1-year increments.
- The lines show that in 2016, the average weekly earnings for workers in service producing industries was $898 and increased to a maximum of $1,248 in 2025. The average weekly earnings for workers in the wired and wireless telecommunications carriers (except satellite) was $1,335 in 2016, increasing to $1,751 in 2025.
- The three most recent data points for average weekly earnings for workers in service producing industries are $1,146 in 2023, $1,206 in 2024, and $1,248 in 2025. The three most recent data points for average weekly earnings for workers in the wired and wireless telecommunications carriers (except satellite) are, $1,691 in 2023, $1,724 in 2024, and $1,751 in 2025.
What is it?
Average weekly earnings
The gross taxable payroll of an employee, including pay for overtime.
Wired and wireless telecommunications carriers (except satellite) (NAICS 5173)
This industry group comprises establishments primarily engaged in providing telecommunications and video entertainment services to their customer premises and/or to mobile telecommunication devices over network facilities operated by them. These establishments can own a network, lease a network or combine leased and owned facilities and their networks can integrate various technologies.
Service-producing industries
Service producing industries include the following codes of the North American Industry Classification System (NAICS): trade (41-45N), transportation and warehousing (48-49), information and cultural industries (51), finance and insurance (52), real estate and rental and leasing (53), professional, scientific and technical services (54), management of companies and enterprises (55), administrative and support, waste management and remediation services (56), educational services (61), health care and social assistance (62), arts, entertainment and recreation (71), accommodation and food services (72), other services (except public administration) (81) and public administration (91).
Source: May 2026
Source:
- Survey of Employment, Payrolls and Hours (SEPH)
- Table 14-10-0204-01 Average Weekly Earnings by Industry, annual
Education level
In 2024, the percentage of persons employed in the telecommunication industry with a bachelor’s degree or above was 45.0%, up from 25.8% in 2004. More information on education level
More information on education level
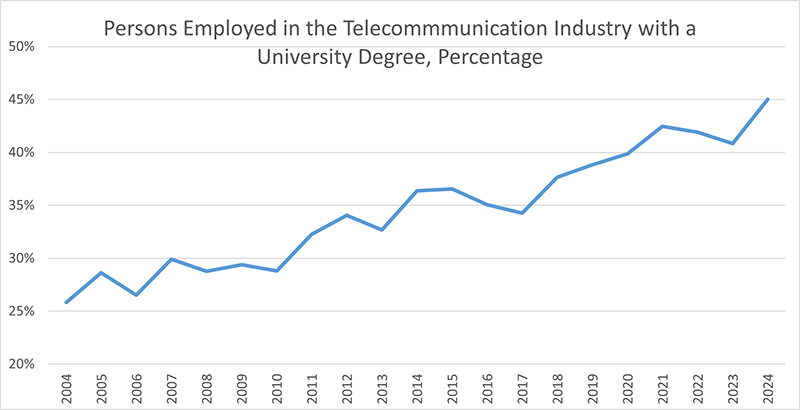
Description - Persons Employed in the Telecommunication Industry with a University Degree, Percentage
- This line chart shows the percentage of persons employed in the telecommunications industry that hold a bachelor’s degree or above, over time.
- It has a vertical axis showing percentages, from 20 to 50.
- It has a horizontal axis showing years, from 2004 to 2024, by increments of one year.
- The percent of persons employed with a bachelor’s degree or above was 25.8% in 2004 and steadily increased to 45.0% in 2024
- The three most recent data points were 41.9% in 2022, 40.8% in 2023 and 45.0% in 2024.
What is it?
This percentage represents the share of the total persons employed in the telecommunication industry that have a bachelor’s degree or above.
Telecommunications (NAICS 517)
This subsector comprises establishments primarily engaged in providing telecommunications and/or video entertainment services over their own networks, or over networks operated by others. The establishments of this subsector are grouped into industries on the basis of the nature of services provided (fixed or mobile), the type of network used to deliver those services (wireline or wireless), and the business model they employ (facilities-based or resale).
Last updated: April 2025
Source:
Labour Force Survey (LFS), Employment by Industry 517 – Telecommunications, Educational Attainment, Canada, Provinces and Territories, Annual, 1998 to 2023
Share of women in executive positions
In 2020, women held 16.4% of director board seats and 26.8% of officer positions in the telecommunications industry. More information on Share of women in executive positions
More information on Share of women in executive positions
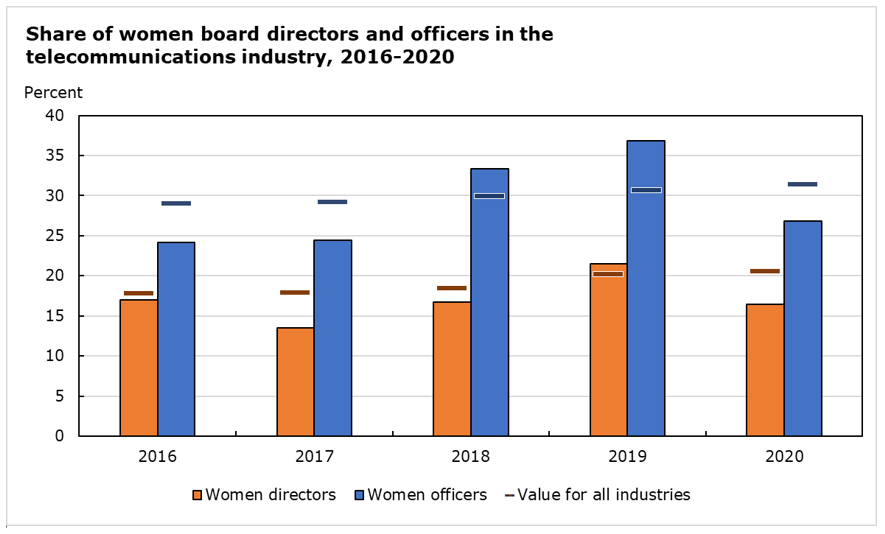
Description - Share of women board directors and officers in the telecommunications industry, 2016-2020
- The title of the chart is "Share of women board directors and officers in the telecommunications industry, 2016-2020."
- This chart displays the share of women in executive positions (directors and officers) in the telecommunications industry and all industries over time.
- The vertical axis displays the percentage of women in executive positions.
- The vertical bars represent the percentage of women in executive positions in the telecommunications industry, while the horizontal lines represent the percentage of women in executive positions across all industries.
- The horizontal axis displays years, from 2016 to 2020, in increments of one year.
- From 2016 to 2020, the share of women board directors in the telecommunications industry decreased from 17.0% to 16.4% (-3.5%). During the same period, the share of women in director seats across all industries increased, from 17.8% to 20.5% (+15.2%).
- From 2016 to 2020, the share of women officers in the telecommunications industry increased from 24.2% to 26.8% (+10.7%). During the same period, the share of women officers across all industries also increased, from 29.0% to 31.4% (+8.3%).
What is it?
The share of women in executive positions measures the proportion of women board directors and officers for companies that conduct business in Canada. Diversity on boards may be measured by various demographic factors, such as: gender, age and racialized groups. Diverse boards may provide different perspectives on topics, which may enable better decision-making.
Executive
An executive is a person who occupies a leadership and decision-making role within an enterprise, and who contributes either as a board director or as an officer.
Directors
Directors are responsible for supervising the activities of the corporation and for making decisions regarding those activities.
Officers
Officers are responsible for the day-to-day operation of the corporation. Officers are appointed by the directors and, together with directors, form the management of the corporation. Officers can fill any position in the corporation that directors want them to fill (president, secretary or any other position).
Other notes
Due to rounding, the values in the chart may not match the values in other publications.
The denominators used in the calculations for the share of women in executive positions are not constant over time due to changes in the number of businesses in operation, and other changes in total employment.
Figures for reference year 2019 were revised since their initial release. The revisions came primarily from an update of the 2019 dataset and from methodological enhancements.
Source:
Table 33-10-0501-01, Representation of women and men on boards of directors and in officer positions, by firm attributes
Labour productivity level
In 2024, labour productivity in the telecommunications industry was $179.30 per hour, higher than the value for all service-producing businesses ($54.10 per hour). More information on labour productivity level
More information on labour productivity level
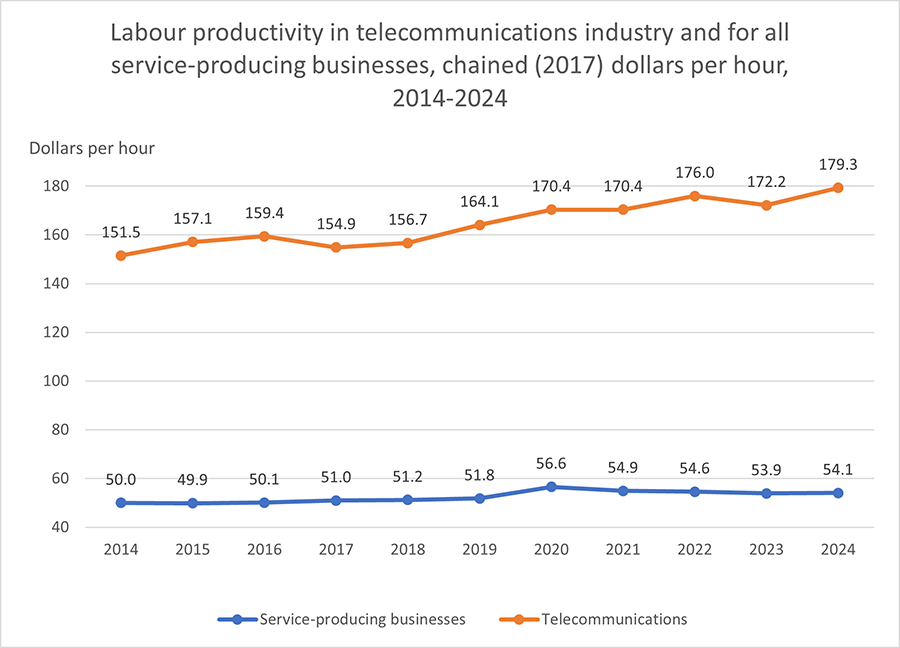
Description – Labour productivity in the telecommunications industry and for all service-producing businesses, chained (2017) dollars per hour, 2014-2024
- The title of chart is "Labour productivity in the telecommunications industry and for all service-producing businesses, chained (2017) dollars per hour, 2014-2024."
- This line chart illustrates how the labour productivity level in the telecommunications industry and for all service-producing businesses has changed over time.
- The vertical axis displays output per hour in chained (2017) dollars per hour, ranging from 40 to 180, in increments of 20.
- The horizontal axis displays years, from 2014 to 2024, in increments of one year.
- Between the two most recent years of the chart (2023 and 2024), labour productivity in the telecommunications industry increased from $172.20 per hour in 2023 to $179.30 per hour in 2024. Labour productivity for all service-producing businesses increased from $53.90 per hour to $54.10 per hour over the same time period.
- From 2014 to 2024, labour productivity in the telecommunications industry rose from $151.50 per hour to $179.30 per hour. Labour productivity for all service-producing businesses increased from $50.00 per hour to $54.10 per hour over the same time period.
What is it?
Labour productivity calculation
Labour productivity, or real output per hour, is calculated by dividing the real output of an industry, sector or economy by the number of hours worked used in its production process. The real output is measured in terms of real value added (in chained 2017 dollars).
By assessing the levels and growth rates of this ratio (output per hour worked) over time, data users can gain a general indication of the efficiency and quality of human capital in the production process for a given economic context. In particular, it can provide an indication of the impact of innovations on the production of an industry, sector or economy.
Service-producing businesses
Service-producing businesses include business establishments of the North American Industry Classification System (NAICS) codes 41, 44-45, 48-49, 51, 52, 53, 54, 55, 56, 61, 62, 71, 72, and 81, with the exception of the owner-occupied dwellings industry.
Impacts of the COVID-19 pandemic and associated public health measures
In 2020 and 2021, productivity data were particularly volatile, reflecting the impacts of the COVID-19 pandemic and associated public health measures on economic activity and the labour market.
Last updated: December 2025
Source:
Table 36-10-0480-01, Labour productivity and related measures by business sector industry and by non-commercial activity consistent with the industry accounts
Labour productivity growth
Over the last decade (2014 to 2024), labour productivity in the telecommunications industry grew by 18.3% (+1.7% per year on average), while it increased by 8.2% (+0.8% per year on average) for all service-producing businesses. More information on labour productivity growth
Wireless networks infrastructure and coverage

Wireless networks are used to make phone calls and access the internet throughout Canada. This section provides information on data usage, access to and availability of wireless networks in Canada.
5G coverage map
This map shows 5G coverage in Canada. The shaded areas show where 5G networks are in operation, and the non-shaded areas show where there are no 5G networks currently in operation. More information on 5G coverage
More information on 5G coverage
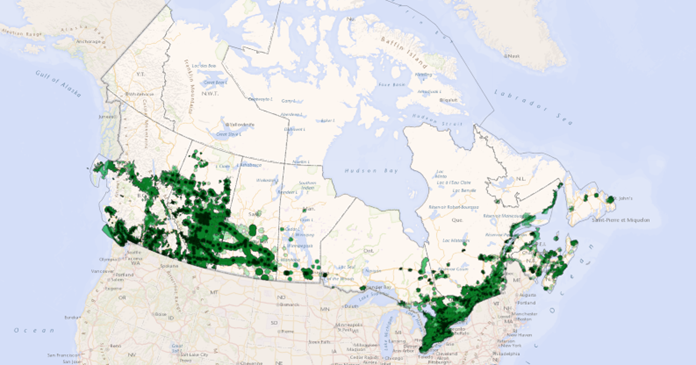
This map shows 5G coverage in Canada. The shaded areas show where 5G networks are in operation, and the non-shaded areas show where there are no 5G networks currently in operation. Visit an interactive version at 2020-2024 Expansion of 5G coverage on the CRTC website.
For the above map, the data is available for export through the Cartovista Data panel using the Export button; the Data panel is available on the bottom left-hand side of the map. Detailed instructions on how to use Cartovista maps are available on the Cartovista website.
Last updated: May 2026
Source:
Canadian Radio-television and Telecommunications Commission, Communication Monitoring Report
Communications Market Reports - Current trends - Mobile wireless | CRTC
Access to mobile networks
In 2024, 94.3% of Canadians had access to 5G networks and 99.5% of Canadians had access to LTE networks. More information on access to mobile networks
Mobile subscriptions
The number of subscriptions to mobile services in Canada was 37.7M in 2024, up from 37.0M in 2023. More information on mobile subscriptions
More information on mobile subscriptions
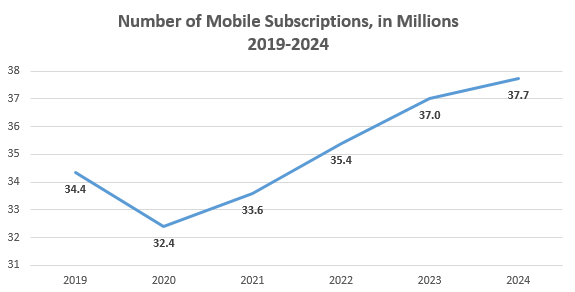
Description - Number of mobile subscriptions in Canada, in millions
- This is a line chart that shows the number of mobile subscriptions in Canada from 2019 to 2024.
- It has a vertical axis showing the number of mobile subscriptions (in millions), from 31 to 38 in one million increments.
- It has a horizontal axis showing years, 2019 to 2024 in 1-year increments
- The line show that in 2020 the number of mobile subscriptions was 32.4 million and steadily increased to 37.7 million in 2024.
- The three most recent data points are 35.4M in 2022, 37.0M in 2023 and 37.7M in 2024.
- Due to changes in accounting methods, comparisons of the data prior to 2020 should be done with caution.
Mobile subscriptions are defined by SIM cards tied to an active phone number, as of Dec 31.
Last updated: May 2026
Source:
Canadian Radio-television and Telecommunications Commission, Communications Monitoring Report
Data usage
Canadians used an average of 11.0 GB of mobile data per month in the third quarter of 2025, up from 9.6 GB reported in the third quarter of 2024. More information on data usage
More information on data usage
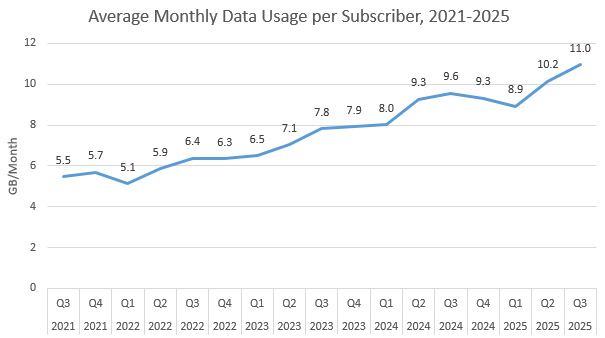
Description - Average data usage per subscriber with a data plan, 2014-2023
- This is a line graph that shows the average data usage per subscriber with a data plan over time.
- It has a horizontal axis showing quarters for the years 2021 to 2025.
- It has a vertical axis showing the monthly average data usage amount, from 0 to 12 GB/month in 2 GB/month increments.
- The line shows that in the third quarter of 2021, the average data usage per subscriber was 5.5 GB/month and increased in the next few years, reaching 11.0 GB/month in the third quarter of 2025.
- The three most recent data points for monthly average data usage per subscriber are 8.9 GB/month in the first quarter of 2025, 10.2 GB/month in the second quarter of 2025 and 11.0 GB/month in the third quarter of 2025.
What is it?
Monthly data usage is the monthly average of data traffic to and from mobile devices. This indicator represents changes in preferences of consumers and data traffic on mobile infrastructure.
Last updated: May 2026
Source: Canadian Radio-television and Telecommunications Commission, Communication Monitoring Report, Communications Market Reports - Current trends - Mobile wireless.
Download and upload speeds
For the period of January 1, 2026 to April 1, 2026, the National average mobile network download and upload speeds, were 82.9 Mbps and 13.4 Mbps respectively, as experienced by all users across the mobile networks of all operators. For reference, it is recommended that a minimum download speed of 5.0 Mbps is used to stream HD quality video, or 25 Mbps for UHD (4K) video. More information on download and upload speeds
Size of monthly mobile data plan
In 2022, almost a fifth of Canadians (19%) had a monthly data plan of 1 GB to less than 6 GB, while approximately one in six Canadians (16%) had a data plan of 30 GB or more. More information on Size of monthly mobile data plan
More information on Size of monthly mobile data plan
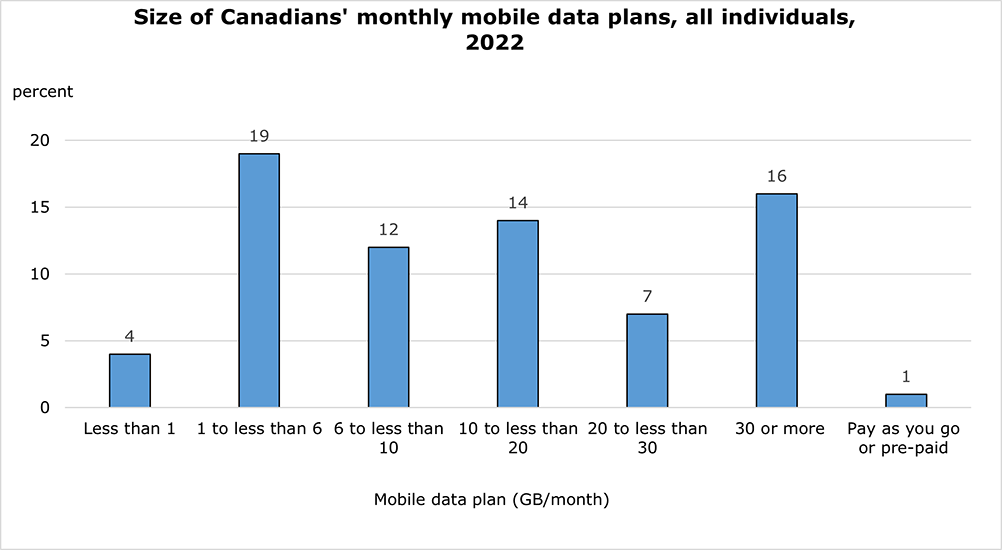
Description - Size of Canadians' monthly data plans, all individuals, 2022
- This is a bar chart displaying the percentage of Canadians that have each type of data plan.
- The vertical axis displays the percentage of Canadians, from 0 to 20%.
- The horizonal axis displays the different types of monthly mobile data plans, from "less than 1 GB" to "30 or more GB". "Pay as you go or pre-paid" is also included.
- The percentage for each plan type is as follows: 4% for "less than 1 GB"; 19% for "1 to less than 6 GB"; 12% for "6 to less than 10 GB"; 14% for "10 to less than 20 GB"; 7% for "20 to less than 30 GB"; 16% for "30 or more GB"; and 1% for "pay as you go or pre-paid."
What is it?
A data plan is a mobile Internet service for a wireless handheld device that allows users to access the Internet from anywhere via a 3G, 4G, 5G or LTE network. The service is provided by mobile operators for a fee that may be billed monthly or on a per-usage basis.
Canadians without data plans are excluded from all categories in the chart.
Source:
Cord cutting
In 2023, 60.9% of households in Canada reported they had a cellphone and no landline, up from 20.2% in 2013. Close to 90% of households with a respondent less than 30 years old reported they had a cellphone and no landline. More information on cord cutting
More information on cord cutting
Percentage of Households with Cellphone and No Landline
| Age Group | 2013 | 2023 |
|---|---|---|
| All | 20.2 | 60.9 |
| Age less than 30 | 65.0 | 90.1 |
| Age 30 to 39 | 34.3 | 88.3 |
| Age 40 to 54 | 16.6 | 69.9 |
| Age 55 to 64 | 8.4 | 52.8 |
| Age 65 and over | 3.2 | 32.5 |
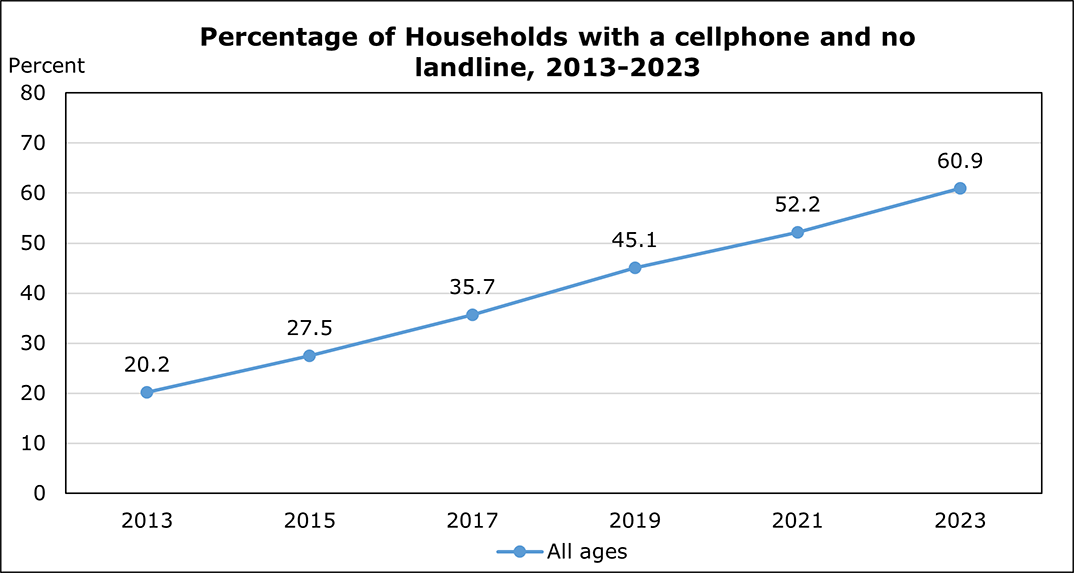
Description - Percentage of households with a cellphone and no landline
- This is a line graph displaying the percentage of households of all ages with a cellphone and no landline from 2013-2023.
- The vertical axis displays the percentage of households, from 0 to 80%.
- It has a horizontal axis showing years, from 2013 to 2023 in two year increments.
- The line shows that in 2013 the percentage of households with a cellphone and no landline was 20.2% and increased to 60.9% in 2023.
What is it?
Percentage of households that reported they had a cellphone and no landline. Household age is determined by the respondent who reported for the Survey of Household Spending.
Last updated: August 2025
Source:
Internet services infrastructure and coverage

Residential high-speed Internet services are provided to homes through various technologies such as DSL (Digital Subscriber Line), cable, FTTH (Fibre-to-the-Home)/ FTTP (Fibre-to-the-Premises), satellite, and fixed wireless technologies. This section provides information on data usage, access, availability and subscriptions to residential high-speed Internet in Canada.
Broadband Internet service availability
This map gives an overview of broadband Internet coverage in Canada in 2023. Shaded areas indicate where broadband Internet services are available, and unshaded areas indicate where no broadband Internet services are available. More information
on broadband Internet service availability
More information on broadband Internet service availability
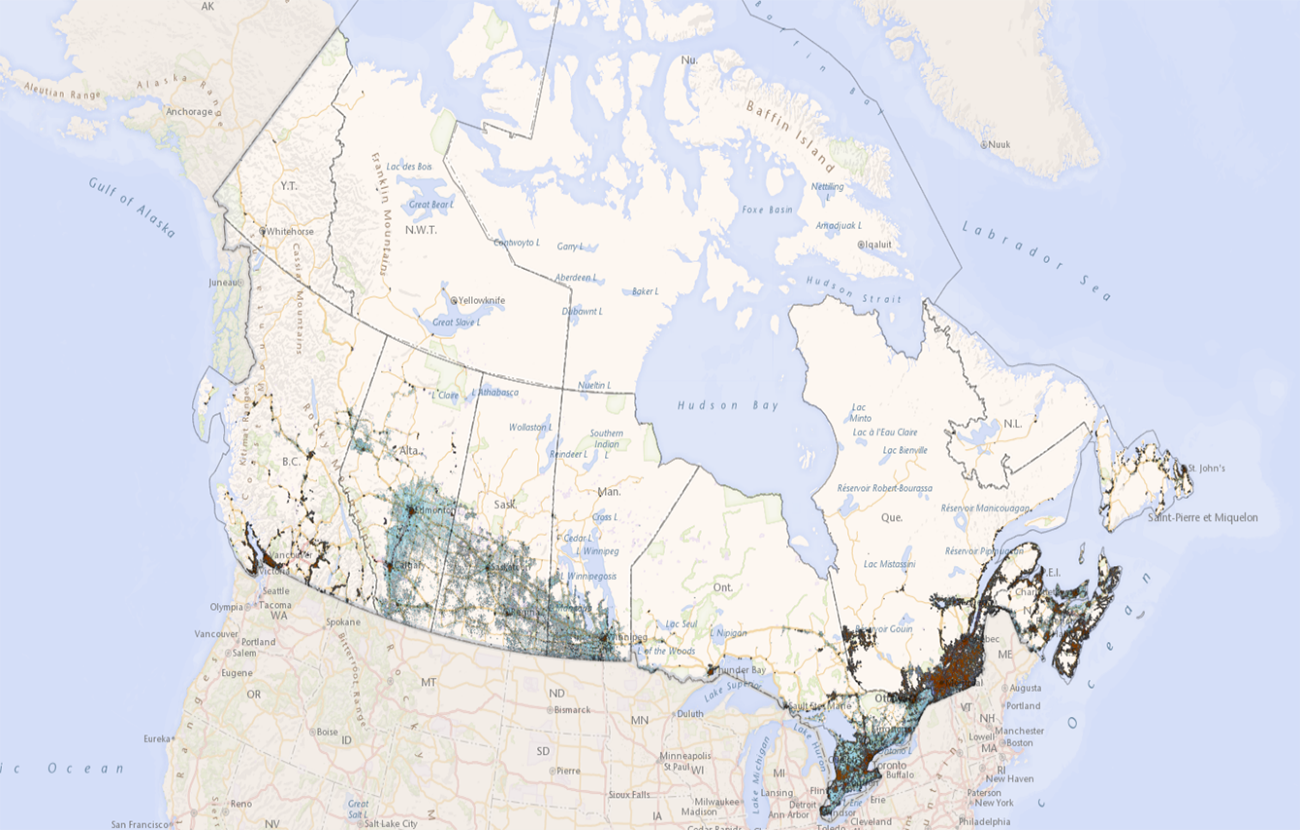
This map gives an overview of broadband Internet coverage in Canada.
Broadband Internet access refers to Internet services with download speeds of 1.5 megabits per second (Mbps) or faster that are accessed via DSL (Digital Subscriber Line), cable, FTTH (Fibre-to-the-Home)/ FTTP (Fibre-to-the-Premises), satellite, and fixed wireless technologies. This access excludes dial-up and mobile wireless services.
Shaded areas indicate where broadband Internet services are available, and unshaded areas indicate where no broadband Internet services are available. Visit an interactive version at 2018-2023 Fixed broadband service availability on the CRTC website.
For the above map, the data is available for export through the Cartovista Data panel using the Export button; the Data panel is available on the bottom left-hand side of the map. Detailed instructions on how to use Cartovista maps are available on the Cartovista website.
Last updated: April 2025
Source: Canadian Radio-television and Telecommunications Commission, Communication Monitoring Report Communications Market Reports - Current trends - High-speed broadband | CRTC.
Access to broadband Internet services
In 2024 96.4% of Canadian households had access to unlimited broadband Internet coverage with at least 50 megabits per second (Mbps) download and 10 Mbps upload speeds (often referred to as “50/10”), meeting the Government of Canada’s goal for national broadband availability in 2021. More information on access to broadband Internet services
Residential broadband Internet subscriptions
The number of residential broadband Internet subscriptions in Canada was 13.8M in 2024, up from 13.5M in 2023.
More information on residential broadband Internet subscriptions
More information on residential broadband Internet subscriptions
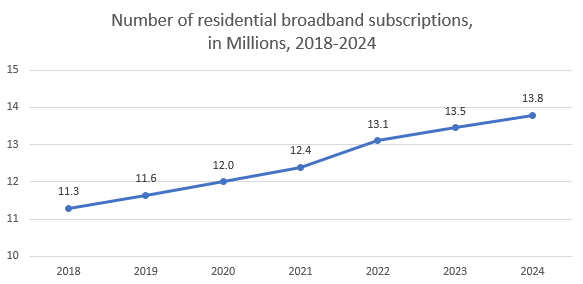
Description - Number of residential broadband Internet subscriptions, in Millions, 2018-2024
- This is a line chart that shows the number of residential broadband Internet subscriptions in Canada from 2018 to 2024.
- It has a vertical axis showing the number of residential subscriptions (in millions), from 10 to 15 in one million subscriptions increments.
- It has a horizontal axis showing years, from 2018 to 2024 in 1-year increments.
- The line shows that in 2018, the number of residential broadband subscriptions was 11.3M and steadily increased to 13.8M in 2024.
- For the three most recent data points are 13.1M in 2022, 13.5M in 2023 and 13.8 in 2024.
What is it?
The number of residential broadband Internet subscriptions is the sum of large incumbent telecommunications service provider broadband and cable-based carrier broadband subscriptions.
Broadband Internet access refers to Internet services with download speeds of 1.5 Mbps or faster that are accessed via DSL (Digital Subscriber Line), cable, FTTH (Fibre-to-the-Home)/ FTTP (Fibre-to-the-Premises), satellite, and fixed wireless technologies. This access excludes dial-up and mobile wireless services.
Last updated: May 2026
Source:
Canadian Radio-television and Telecommunications Commission, Communications Market Reports
Average monthly data usage per high-speed residential Internet subscription
In 2024, the average monthly data used per high-speed residential Internet service subscription was 585.5 GB, an increase of 9.7% from 2023.
More information on average monthly data usage per high-speed residential Internet subscription
More information on average monthly data usage per high-speed residential Internet subscription
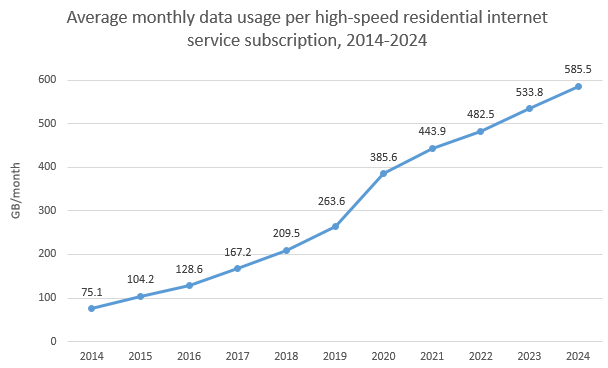
Description - Average monthly data usage per high-speed Internet subscription
- This is a line graph that shows the average monthly data usage per high-speed Internet subscription over time.
- It has a horizontal axis showing years, 2014 to 2024, in one-year increments.
- It has a vertical axis showing monthly data usage, from 0 to 600 GB/month in 100 GB/month increments.
- The line shows that in 2014 the monthly average data used per high-speed residential Internet subscription was 75.1 GB and increased over time, reaching 585.5 GB in 2024.
- The three most recent data points for monthly average data usage per high-speed Internet subscription are 482.5 GB/month in 2022, 533.8 GB/month in 2023 and 585.5 GB/month in 2024.
What is it?
The average monthly data usage is the sum of the average download and upload data usage.
High-speed access refers to Internet services with download speeds of 256 kilobits per second (Kbps) or faster that are accessed via DSL (Digital Subscriber Line), cable, FTTH (Fibre-to-the-Home)/ FTTP (Fibre-to-the-Premises), satellite, and fixed wireless technologies. This access excludes dial-up and mobile wireless services.
Last updated: May 2026
Source:
Canadian Radio-television and Telecommunications Commission, Communications Market Reports
Investment
This section includes information on investments in telecommunications infrastructure and capital expenditures in the telecommunications industry.
Spectrum
In 2023, 4099 spectrum licences were auctioned in the 3800 MHz band for a total value of $2.16 billion or $0.26 per MHz per person ($/MHz-Pop). More information on spectrum
Investment in communications networks
In 2024, private and public industries in Canada invested 6.9 billion dollars in communications networks, including 3.1 billion dollars in optical fibre cables. For more statistics on infrastructure and communications networks, visit Statistics Canada’s Infrastructure statistics hub.
Capital expenditures
Capital expenditure in the wired and wireless telecommunications industry was estimated to be 10.9 billion dollars in 2024, or roughly 262 dollars per Canadian. More information on capital expenditures
The Canadian Radio-television and Telecommunication Commission Communications Market Reports

The Canadian Radio-television and Telecommunications Commission Communications Market Reports (CMR) provide financial and performance information on Canada's communications market sectors. The CMR are intended to support an open and informed public discussion of broadcasting and telecommunications regulatory policies and issues.