
Older adults and population aging statistics

Note: The terminology on this page has been updated to better reflect its content. "Seniors and aging" is now "Older adults and population aging".
 Care and social support
 Elder abuse and victimization
 Health and disability among older adults
 Housing and family and household characteristics of older adults
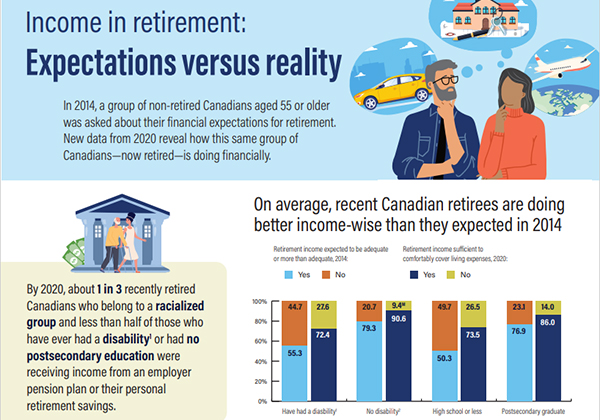
 Income, pensions and wealth
 Work and retirement
Features


Key indicators
-
8,108,467
-
12,281
-
Males: 19.43 yearsFemales: 22.15 years
-
40.6 years
Demographic estimates by age and gender, provinces and territories: Interactive dashboard
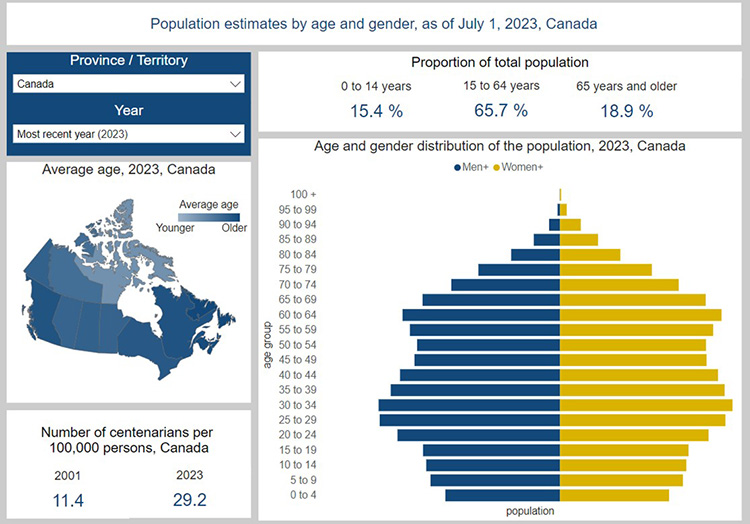
This Demographic estimates by age and sex, provinces and territories: interactive dashboard allows the visualization of the age and gender structure of the population of Canada, provinces and territories. The data presented cover the period from 1971 to the most recent year. The dashboard shows the proportion of the total population by broad age group, the proportion of centenarians, the distribution of the population by age and gender, the average age, the number of people aged 15 to 64 per person aged 65 years and older and the number of men+ per women+ by age group. Date can be visualized for Canada or for a selected province or territory.
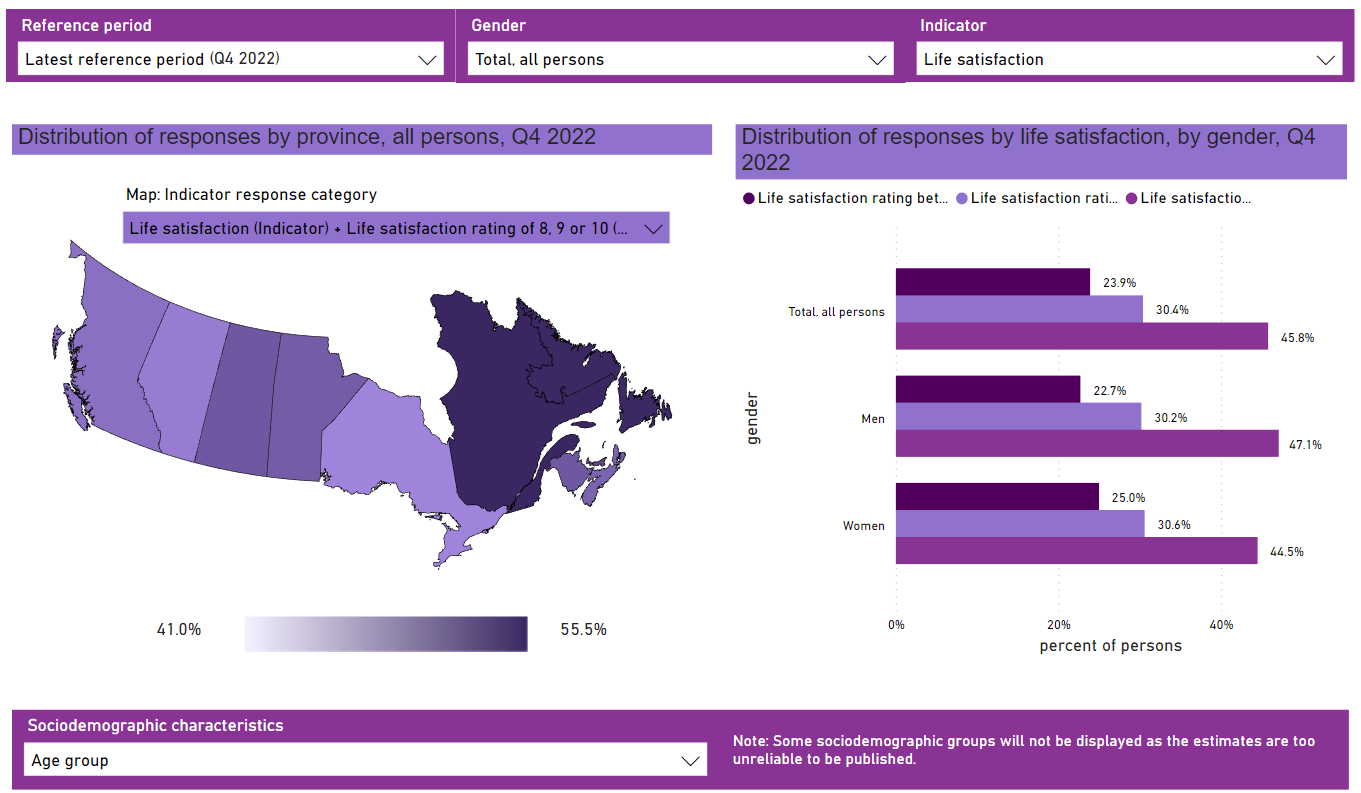
Healthy aging indicators

View health indicators annual tables and two-year combined data tables from the 2019/2020 Canadian Health Survey on Seniors (CHSS).
View a table on healthy aging indicators from the 2008/2009 CCHS-Healthy Aging.
Sustainable Development Goals

Goal 3 - Good health and well-being of the Sustainable Development Goals is to ensure healthy lives and promote well-being for all at all ages.
Resources
- Additional information
- Life expectancy and deaths statistics
- Canadian Population Health Survey data linked to mortality, hospitalization and historical postal codes
- Canadian Vital Statistics Database (CVSD) linked to Discharge Abstract Database (DAD) National Ambulatory Care Reporting System (NACRS) and Ontario Mental Health Reporting System (OMHRS)
- External links
Population projections

View Population Projections for Canada (2021 to 2068) Provinces and Territories (2021 to 2043) to see some population projections, including projections related to the senior population.
Feedback
What do you want to see on this page? Email infostats@statcan.gc.ca to let us know.