
Dimensions of Poverty Hub

 Access to health care
 Food insecurity
 Income inequality
 Literacy
 Low income
 Minimum wage or low-paid work
Poverty rates for selected demographic groups (2023-base MBM)
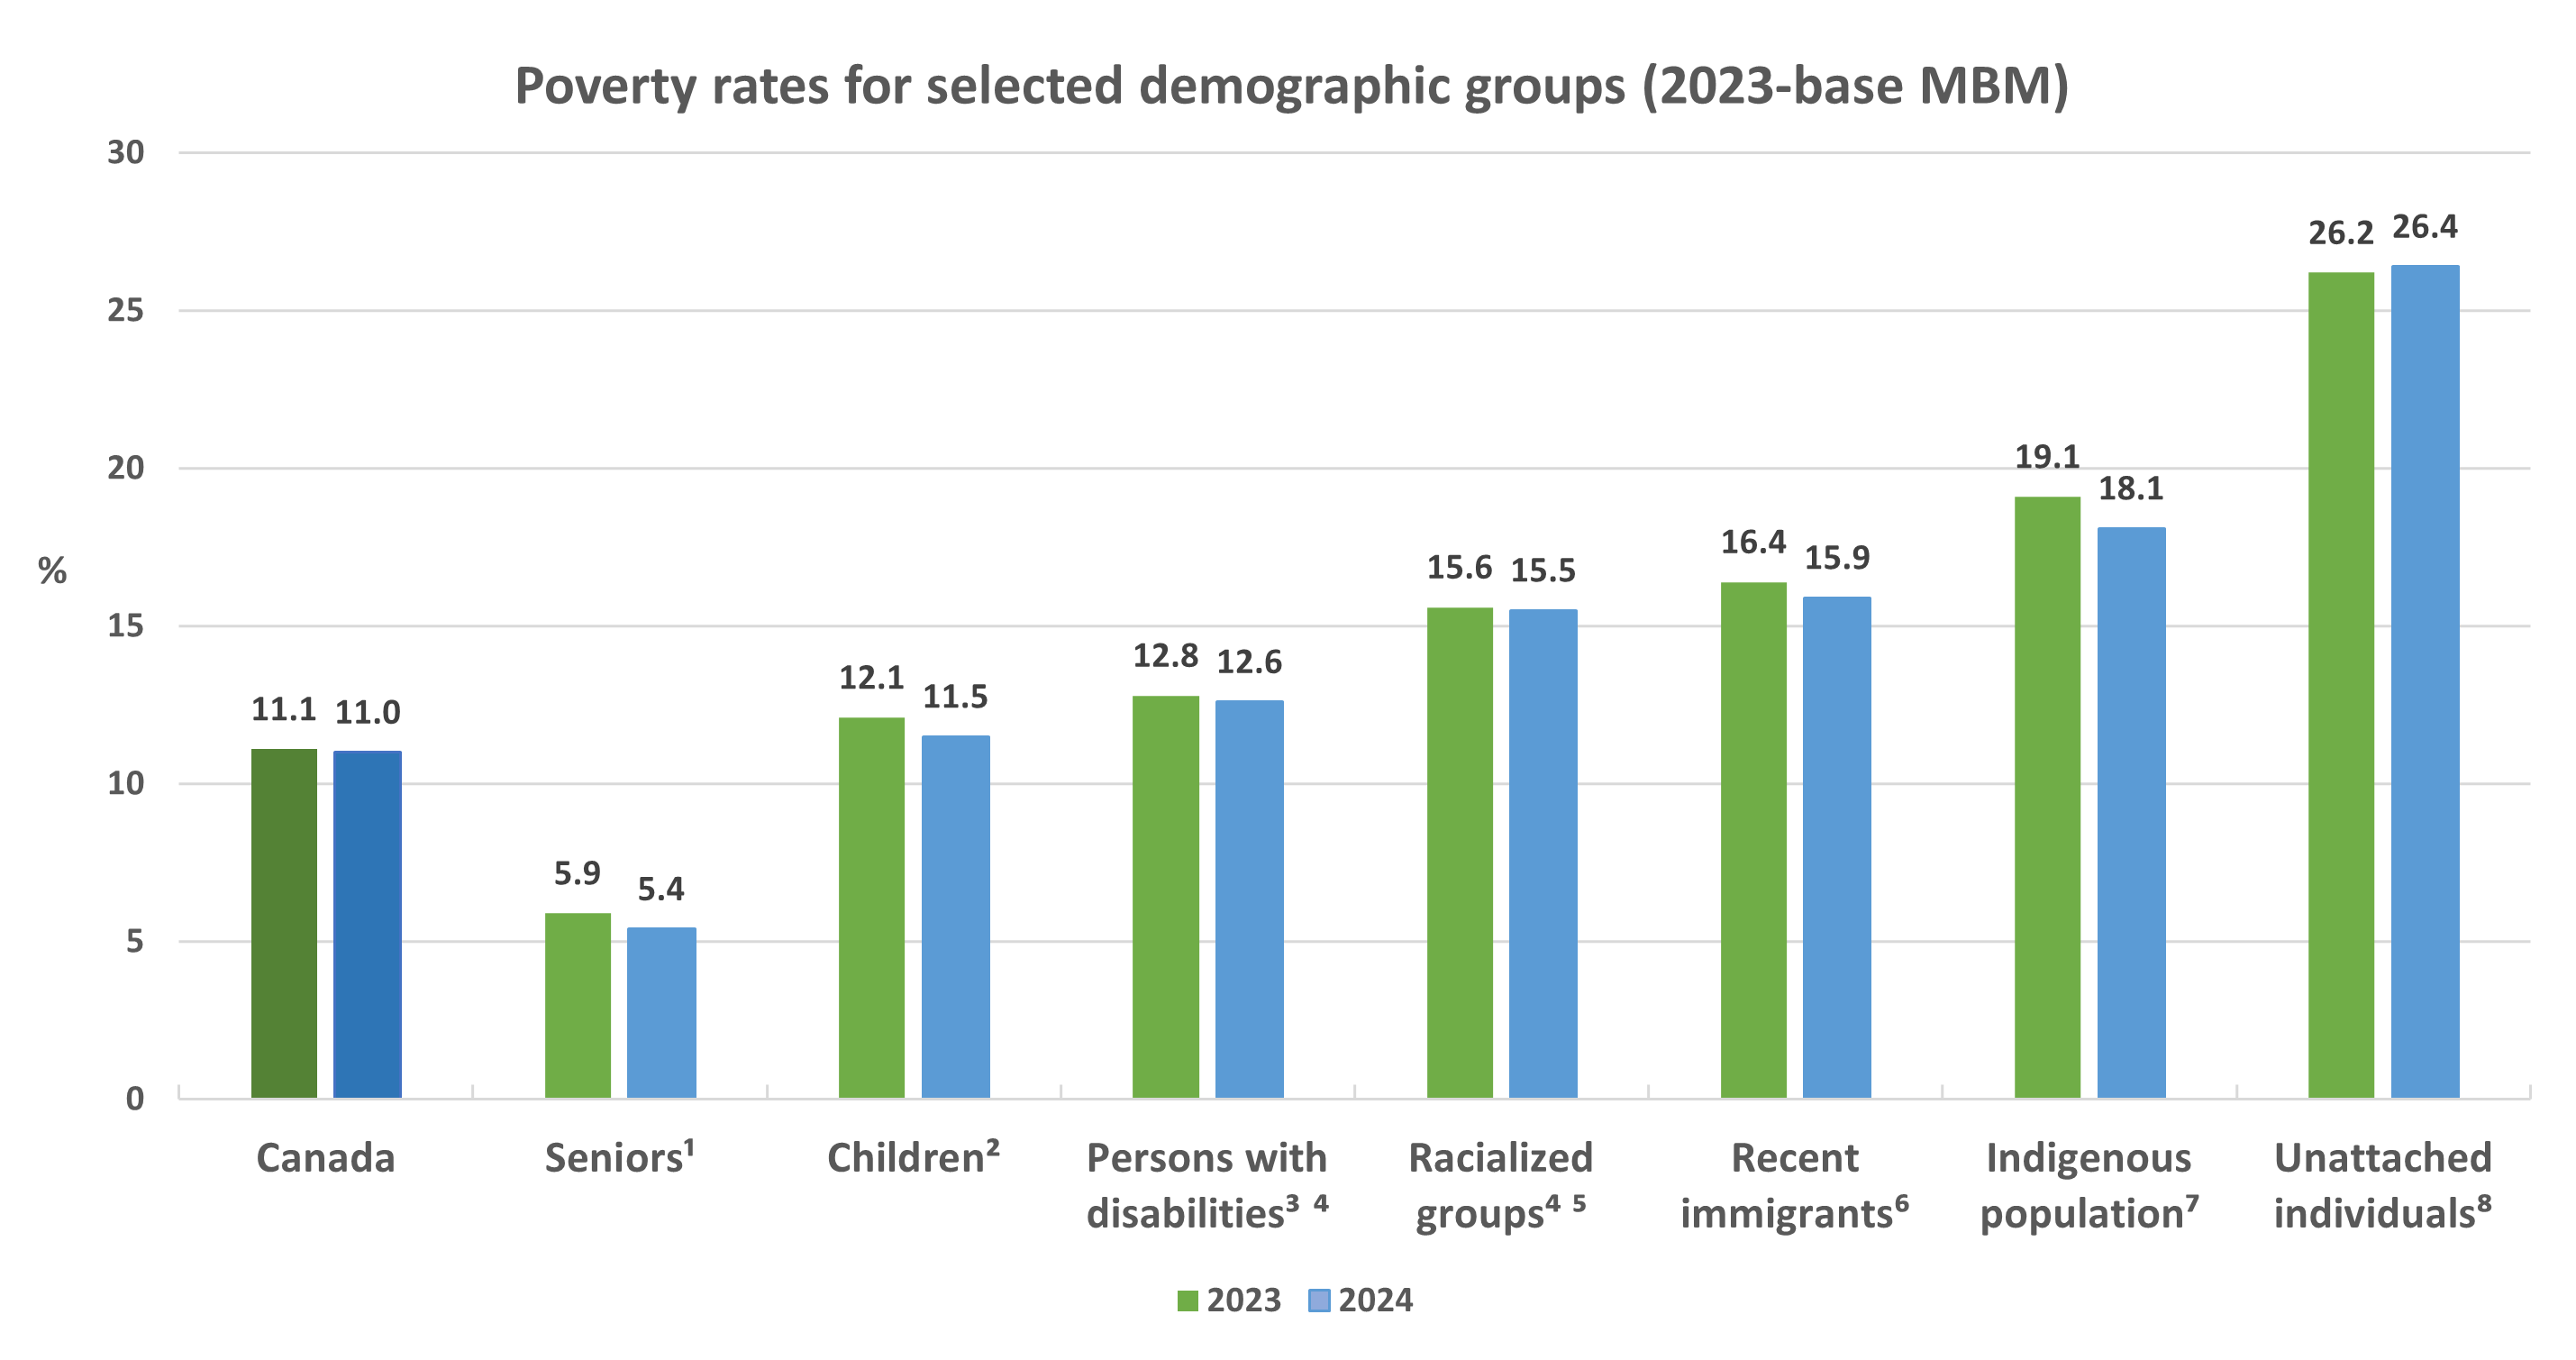
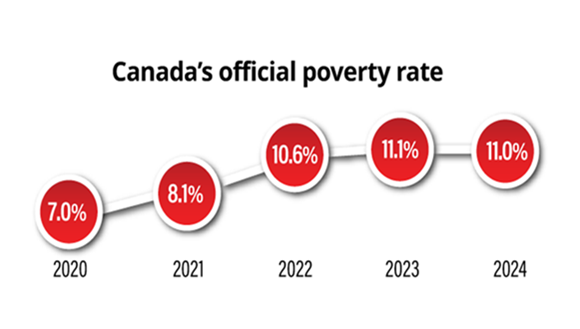
In 2024, 11.0% of Canadians lived in poverty, compared with 11.1% in 2023. More information on Canada's Official Poverty Line
More information on Canada's Official Poverty Line
Description - Poverty rates for selected demographic groups (2023-base MBM)1
| 2023 | 2024 | |
|---|---|---|
| Canada | 11.1 | 11.0 |
| Seniors1 | 5.9 | 5.4 |
| Children2 | 12.1 | 11.5 |
| Persons with disabilities3,4 | 12.8 | 12.6 |
| Racialized groups4,5 | 15.6 | 15.5 |
| Recent immigrants6 | 16.4 | 15.9 |
| Indigenous population7 | 19.1 | 18.1 |
| Unattached individuals8 | 26.2 | 26.4 |
|
1 - Persons 65 years and over. 2 - Persons under 18 years. 3 - Persons 15 years and over. Disability-related estimates are produced using a different weighting methodology and comparisons with estimates produced from the entire survey should be made with caution. 4 - Poverty rates do not include the territories. 5 - Racialized group is derived directly from the concept of visible minority. 6 - Persons 15 years and over who arrived in Canada in the previous 10 years. 7 - Includes persons 15 years and over who reported having an Indigenous identity, that is, First Nations (North American Indian), Métis or Inuk (Inuit), or those who reported more than one identity. Excluded from the survey’s coverage are persons living on reserves and other Indigenous settlements in the provinces. 8 - Persons not in an economic family living either alone or with others to whom they are unrelated (e.g., roommates, lodger). Source: Statistics Canada. Canadian Income Survey (CIS). |
||
What is it?
This indicator measures the percentage of Canadians who live in poverty as measured by the 2023-base Market Basket Measure (MBM). According to the MBM, a family lives in poverty if they cannot afford the cost of a specific basket of goods and services in their community.
Why is it important?
Tracking the number and percentage of Canadians who fall below Canada's Official Poverty Line can be used to measure the progress on and effectiveness of initiatives designed to lift Canadians out of poverty.
Notes
The Market Basket Measure (MBM) is based on the cost of a specific basket of goods and services representing a modest, basic standard of living. It includes the costs of food, clothing, footwear, transportation, shelter, communication services and other expenses for a reference family. These costs are compared to the disposable income of families to determine whether or not they fall below the poverty line.
For more information regarding Canada's Official Poverty Line, refer to Opportunity for All: Canada's First Poverty Reduction Strategy.
Program
Canadian Income Survey – Annually
Source
Statistics Canada. Table 11-10-0135-01 Low income statistics by age, gender and economic family type.
Statistics Canada. Table 11-10-0136-01 Low income statistics by economic family type.
Statistics Canada. Table 11-10-0090-01 Poverty and low-income statistics by disability status.
Statistics Canada. Table 11-10-0093-01 Poverty and low-income statistics by selected demographic characteristics.
Note: 2025 data will be available in spring 2027.
Features


Market Basket Measure (MBM) poverty thresholds
Canadian Income Survey (CIS), poverty data
Poverty estimates
- Table 11-10-0135-01 Low income statistics by age, gender and economic family type
- Table 11-10-0136-01 Low income statistics by economic family type
- Table 11-10-0090-01 Poverty and low-income statistics by disability status
- Table 11-10-0093-01 Poverty and low-income statistics by selected demographic characteristics
Inequality indicators using the Market Basket Measure
- Table 11-10-0102-01 Average basket coefficient by after-tax income decile
- Table 11-10-0103-01 Aggregate and average components of after-tax income according to the Market Basket Measure threshold, by after-tax income decile
Provisional poverty estimates
Census of Population, poverty data
Poverty estimates
- Table 98-10-0112-01 Individual Market Basket Measure poverty status by demographic and economic family characteristics of persons: Canada, provinces and territories, census metropolitan areas and census agglomerations with parts
- Table 98-10-0113-01 Individual Market Basket Measure poverty status by economic family characteristics of persons: Canada, provinces and territories, census divisions and census subdivisions
- Table 98-10-0114-01 Individual Market Basket Measure poverty status by economic family characteristics of persons: Census metropolitan areas, tracted census agglomerations and census tracts
- Table 98-10-0115-01 Individual Market Basket Measure poverty status by visible minority groups and demographic characteristics: Canada, provinces and territories, census metropolitan areas and census agglomerations with parts
- Table 98-10-0116-01 Individual Market Basket Measure poverty status by immigration status and demographic characteristics: Canada, provinces and territories, census metropolitan areas and census agglomerations with parts
- Table 98-10-0117-01 Individual Market Basket Measure poverty status by Indigenous groups and demographic characteristics: Canada, provinces and territories, census metropolitan areas and census agglomerations with parts
Maps, by Census Subdivisions and Census Tracts
Comprehensive reviews of the Market Basket Measure
Third comprehensive review
- Dimensions of Poverty Hub update, 2023-base Market Basket Measure
- The proposed methodology for the 2023-base Market Basket Measure of poverty
- What we heard report: Engagement activities for the third comprehensive review of the Market Basket Measure
- Market Basket Measure research paper: An analysis of the equivalization method
- Market Basket Measure research paper: Examining shelter and transportation costs within census metropolitan area Market Basket Measure regions
- Market Basket Measure research paper: Applying the Market Basket Measure methodology to an administrative data source
- Market Basket Measure research paper: Options for updating the other necessities component and the creation of a communication services component
- Market Basket Measure research paper: Market Basket Measure thresholds for remote regions
- Market basket measure research paper: Child care expenses
- Launch of the Third Comprehensive Review of the Market Basket Measure
- Market Basket Measure Research Paper: Delineating Remote Regions for the Market Basket Measure
- Market Basket Measure Research: Additional income inequality indicators using the Market Basket Measure
- Market Basket Measure Research Paper: Poverty Index
Second comprehensive review
- Report on the second comprehensive review of the Market Basket Measure
- Defining disposable income in the Market Basket Measure
- Towards an update of the Market Basket
- An Update on the Market Basket Measure Comprehensive Review
First comprehensive review
Construction of the Market Basket Measure methodologies
Construction of the Market Basket Measure
Construction of the Northern Market Basket Measure
- Construction of a Northern Market Basket Measure of poverty for Nunavut
- Technical paper for the Northern Market Basket Measure of poverty for Yukon and the Northwest Territories
- Construction of a Northern Market Basket Measure of poverty for Yukon and the Northwest Territories
- Proposals for a Northern Market Basket Measure and its disposable income
Additional Market Basket Measure research and informational products
Additional research
- Who experiences persistent low income? A study of various demographic groups from 2016 to 2022
- Deep income poverty: Exploring the dimensions of poverty in Canada
- Poverty among racialized groups across generations
- Market Basket Measure Technical Paper: The other necessities component
- The Daily — Study: Disaggregated trends in poverty from the 2021 Census of Population
- Housing experiences in Canada: People in poverty
- Exploration of methodological issues in the development of the market basket measure of low income for Human Resources Development Canada
Informational products
Policy and legislative material related to poverty measurement
Policy and legislative material
Market Basket Measure Poverty Index
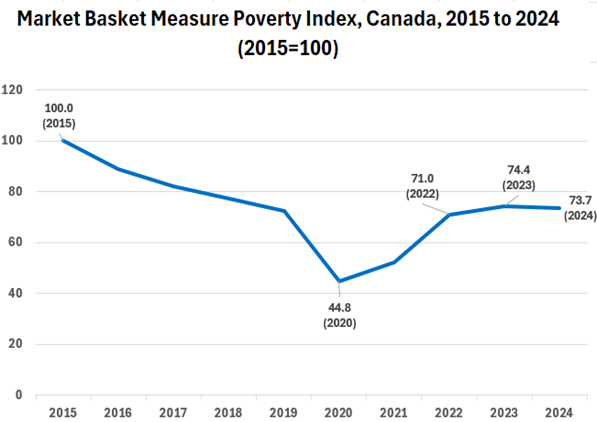
In 2024, the Market Basket Measure Poverty Index was 73.7, down slightly from 74.4 in 2023. More information
on Market Basket Measure Poverty Index
More information on Market Basket Measure Poverty Index
Description - Market Basket Measure Poverty Index
- The line chart shows the Market Basket Measure Poverty Index (MBM-PI) in Canada over time.
- It has a vertical axis showing index values, from 0 to 120, by increments of 20.
- It has a horizontal axis showing years, from 2015 to 2024, by increments of 1 year.
- The line begins with an index value of 100 in 2015. There is a general downward trend until 2019, followed by a sharp decrease to 44.8 in 2020. From 2020, the poverty index increased for three consecutive years to 74.4 in 2023. It decreased slightly to 73.7 in 2024.
What is it?
The Market Basket Measure Poverty Index (MBM-PI) is a tool used to track Canada’s overall poverty rate over time. It ensures continuity in the time series data, even when there are changes to the MBM base.
The MBM-PI sets the value of the index at 100 for a base year. For subsequent years, the MBM-PI is calculated by taking the ratio of the poverty rate between the current year and the previous year and multiplying it by the previous year’s index value. When a new MBM base is introduced, an index is created using a ratio constructed with new poverty rates, and linked to the previous index.
Why is it important?
The MBM is updated regularly to reflect changes in the standards of living, ensuring its relevance. These updates result in changes to the contents of the basket, which can lead to the creation of different poverty lines since the contents of the updated basket may differ from the previous one. Consequently, the poverty rates calculated using the old basket cannot be directly compared to those calculated using the new basket, causing breaks in the series of poverty data.
Similar to the Consumer Price Index (CPI), the MBM-PI allows for the reporting of changes in long-term time series. For example, an MBM-PI value of 50 would indicate that Canada’s overall poverty rate is half the level reported in the benchmark year (set to 100).
For more information on the MBM-PI, please see Market Basket Measure Research Paper: Poverty Index.
Notes
The index value is set to 100 for the year 2015, as it is the benchmark year for the poverty reduction targets established by the Poverty Reduction Act. The chain-link year is 2023.
Source
Statistics Canada. Canadian Income Survey.
Note: 2025 data will be available in spring 2027.
Canada's Official Poverty Dashboard
Opportunity for All – Canada's First Poverty Reduction Strategy introduces a dashboard of 12 indicators to track progress on deep income poverty as well as the aspects of poverty other than income, including indicators of material deprivation, lack of opportunity and resilience.
Dignity
Lifting Canadians out of poverty by ensuring basic needs — such as safe and affordable housing, healthy food and health care — are met.
Deep income poverty
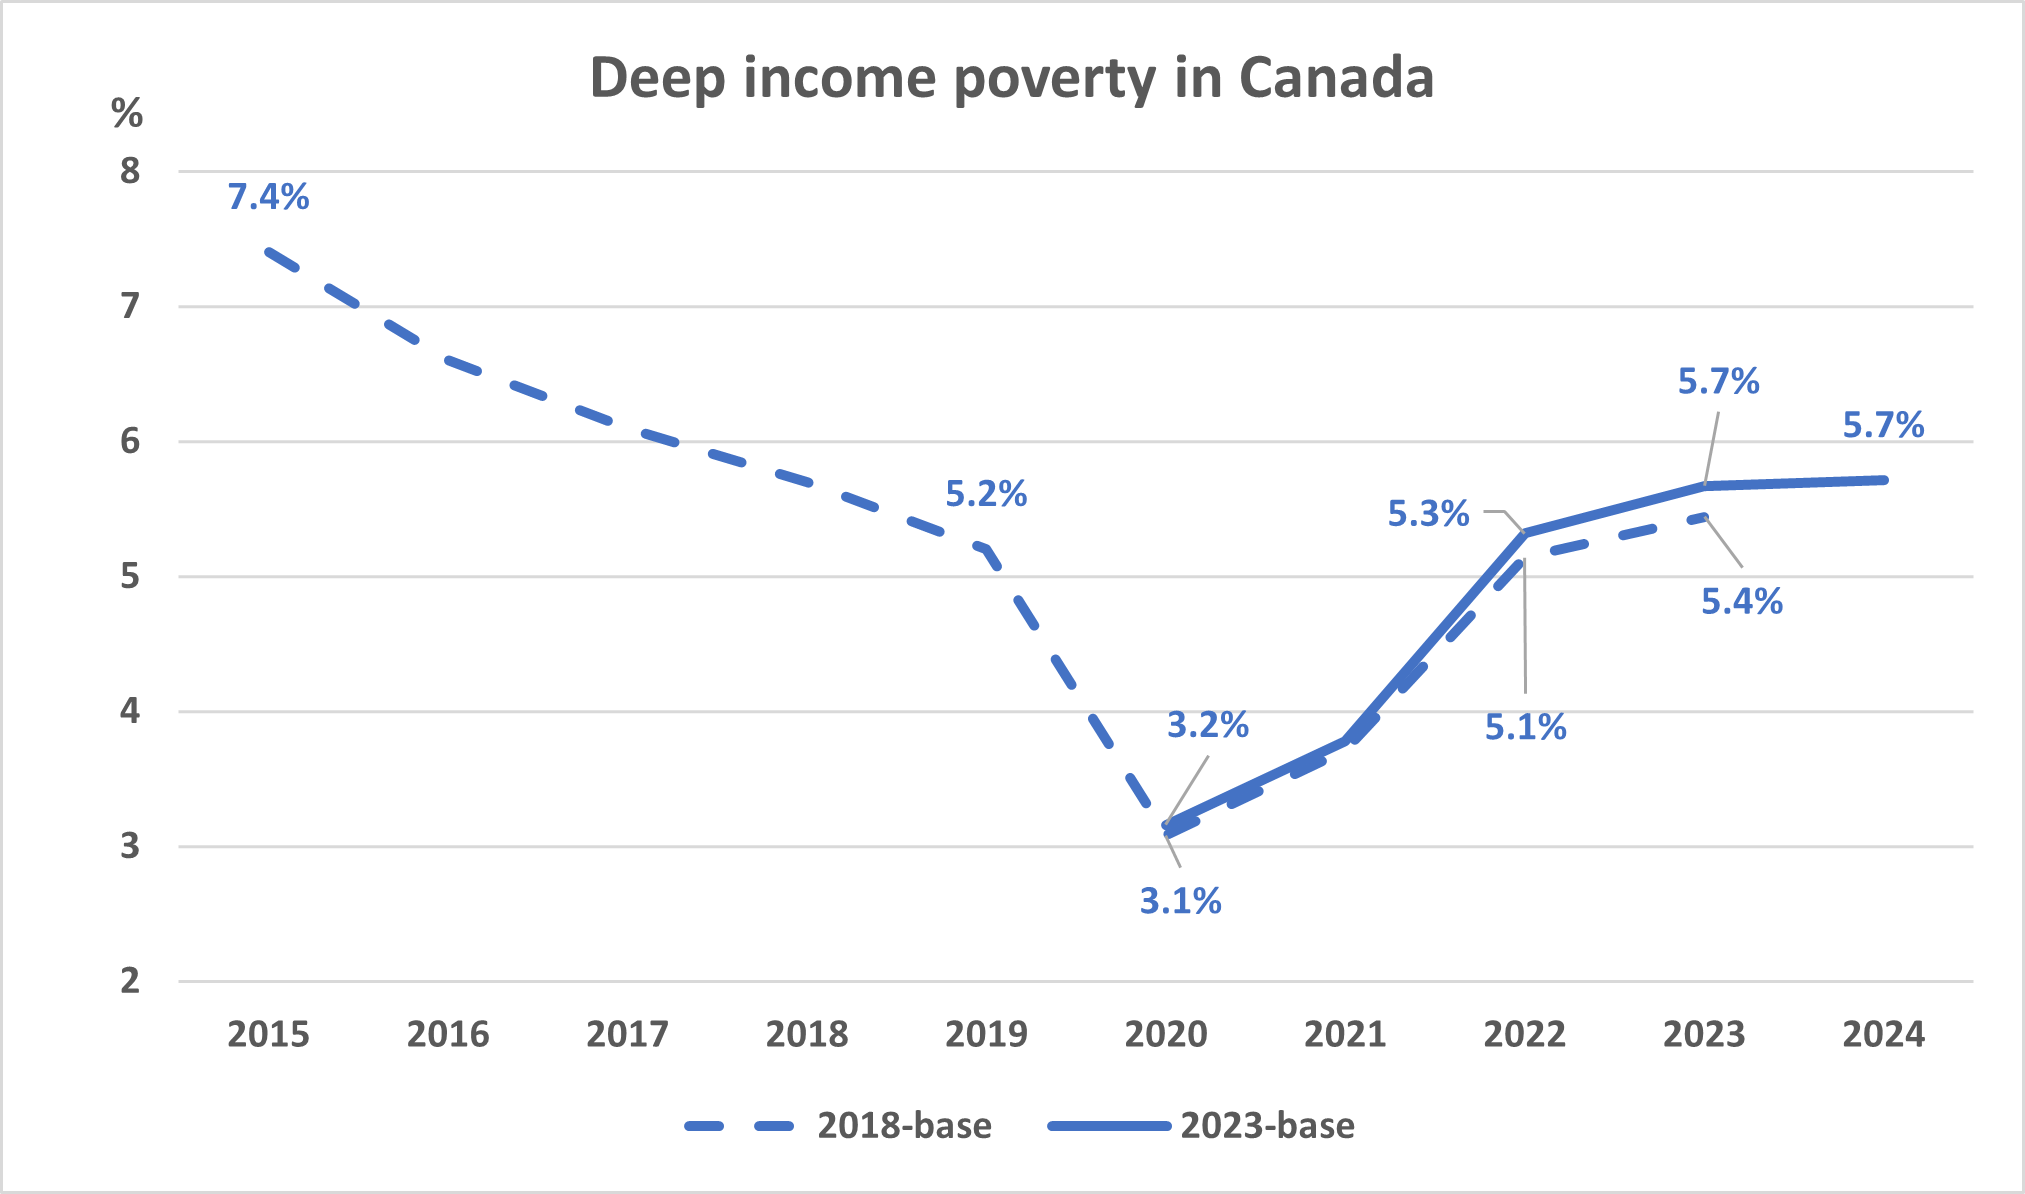
In 2024, 5.7% of Canadians were living in deep income poverty, unchanged from 2023, using the 2023-base MBM methodology. More information on Deep income poverty
More information on deep income poverty
Description - Deep income poverty in Canada
- This line chart shows the deep income poverty rate in Canada over time, using the 2018-base (dashed line) and 2023-base MBM (solid line) methodologies.
- It has a vertical axis showing percentages, from 2% to 8%, by increments of 1 percentage point.
- It has a horizontal axis showing years, from 2015 to 2024, by increments of 1 year.
- The dotted line (2018-base) shows that the deep income poverty rate was 7.4% in 2015. It declined over the years to 3.1% in 2020 and has increased annually since then to 5.4% in 2023.
- The solid line (2023-base) shows that the deep income poverty rate was 3.2% in 2020, the first available reference year for the 2023-base MBM methodology. It increased annually to 5.7% in 2023, and then remained steady at 5.7% in 2024.
- The dotted line (2018-base) has five data points highlighted: 7.4% in 2015, 5.2% in 2019, 3.1% in 2020, 5.1% in 2022 and 5.4% in 2023.
- The solid line (2023-base) has four data points highlighted: 3.2% in 2020, 5.3% in 2022 and 5.7% in 2023 and 2024.
What is it?
This indicator measures the percentage of individuals whose family disposable income is below 75% of Canada’s Official Poverty Line.
Why is it important?
Deep income poverty is one of the four inter-related indicators found in the Dignity pillar of Opportunity for All – Canada's First Poverty Reduction Strategy. The indicators in the Dignity pillar are meant to track the progress of initiatives used to help lift Canadians out of poverty by ensuring everyone's basic needs are met.
Program
Canadian Income Survey - Annually
Source
Statistics Canada, Custom tabulation.
Note: 2025 data will be released in spring 2027. The 75% threshold will be maintained for consistency purposes between bases, regardless of changes in MBM components’ share of total threshold.
Unmet housing needs and chronic homelessness
In 2021, 10.1% of Canadian households experienced core housing needs, down from 12.7% in 2016.
In 2024, 30.2% of shelter users met one or both criteria for chronic homelessness, up from 27.6% in 2023. More information on Unmet housing needs and chronic homelessness
More information on unmet housing needs and chronic homelessness
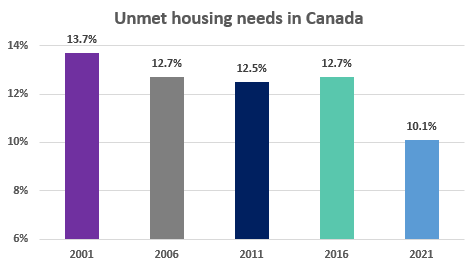
Description – Unmet housing needs
- This bar chart shows the change in the unmet housing needs rate in Canada over time.
- It has a vertical axis showing percentages, from 6 to 14 percent, by increments of 2 percentage points.
- It has a horizontal axis showing five years, 2001, 2006, 2011, 2016 and 2021.
- In 2001, the rate was 13.7%. In 2006, it was 12.7%. In 2011, it was 12.5%. In 2016, it was 12.7%. In 2021, it was 10.1%.
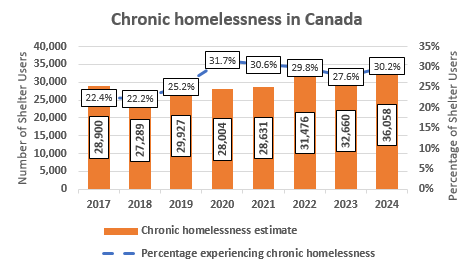
Description - Chronic homelessness
- The bar chart shows the change in the number of shelter users that met one or both criteria for chronic homelessness in Canada over time.
- It has a vertical axis showing a number in the thousands, from 0 to 40,000, by increments of 5,000.
- It has a horizontal axis showing eight years, 2017 to 2024.
- In 2017, 28,900 individuals experienced chronic homelessness, 32,660 in 2023 and 36,058 in 2024.
- The line chart shows the percentage of shelter users that met one or both criteria for chronic homelessness.
- It has a vertical axis showing percentages, from 0 to 35 percent, by increments of 5 percentage points.
- In 2017, 22.4% of shelter users in the sample met one or both criteria for chronic homelessness, 27.6% in 2023 and 30.2% in 2024.
What is it?
Unmet housing needs are measured by the core housing need indicator. Core housing need refers to whether a private household's housing falls below at least one of the indicator thresholds for housing adequacy, affordability or suitability, and would have to spend 30% or more of its total before tax income to pay the median rent of alternative local housing that is acceptable (attains all three housing indicator thresholds).
Housing indicator thresholds are defined as follows:
- Adequate housing is reported by their residents as not requiring any major repairs.
- Affordable housing has shelter costs equal to less than 30% of total before tax household income.
- Suitable housing has enough bedrooms for the size and composition of resident households according to the National Occupancy Standard (NOS), conceived by the Canada Mortgage and Housing Corporation and provincial and territorial representatives.
The national chronic homelessness indicator is calculated using data from communities that have complete coverage of their permanent emergency shelter system for three consecutive years, and annual estimates of national shelter use from the National Shelter Study.
The sample used to estimate chronic homelessness varies annually as the set of communities that meet the eligibility criteria changes. Shelter users are considered chronically homeless if they meet at least one of the following criteria:
- Acute chronicity: used a shelter for six months (180 days) or more in the past year
- Prolonged instability: had shelter stays in each of the last three years
The indicator does not include unsheltered homelessness (e.g., people experiencing homelessness that are staying in unsheltered locations or places not intended for human habitation).
Why is it important?
The Unmet housing needs and chronic homelessness indicator is one of the four inter-related indicators found in the Dignity pillar of Opportunity for All – Canada's First Poverty Reduction Strategy. The indicators in the Dignity pillar are meant to track the progress of initiatives used to help lift Canadians out of poverty by ensuring everyone’s basic needs are met.
Notes
- Unmet housing needs:
- Program: Census of Population – Every five years
- Sources: Statistics Canada. 2016 Census Table: Core housing need and 2021 Census Infographic: Core housing need in Canada
- Note: 2026 Census data will be released in 2027.
- Chronic homelessness:
- Program: National Shelter Study, the data are collected by service providers and communities using the Homeless Individuals and Families Information System (HIFIS) and through data-sharing partnerships with jurisdictions that use similar systems.
- Sources: Housing, Infrastructure and Communities Canada: Housing, Infrastructure and Communities Canada - Homelessness data snapshot: The National Shelter Study 2024 Update
- Note: 2025 data will be released in 2026.
Unmet health needs
In 2024, 8.8% of persons aged 15 years and over reported experiencing unmet health care needs, down from 9.1% in 2023. More information on Unmet health needs
More information on unmet health needs
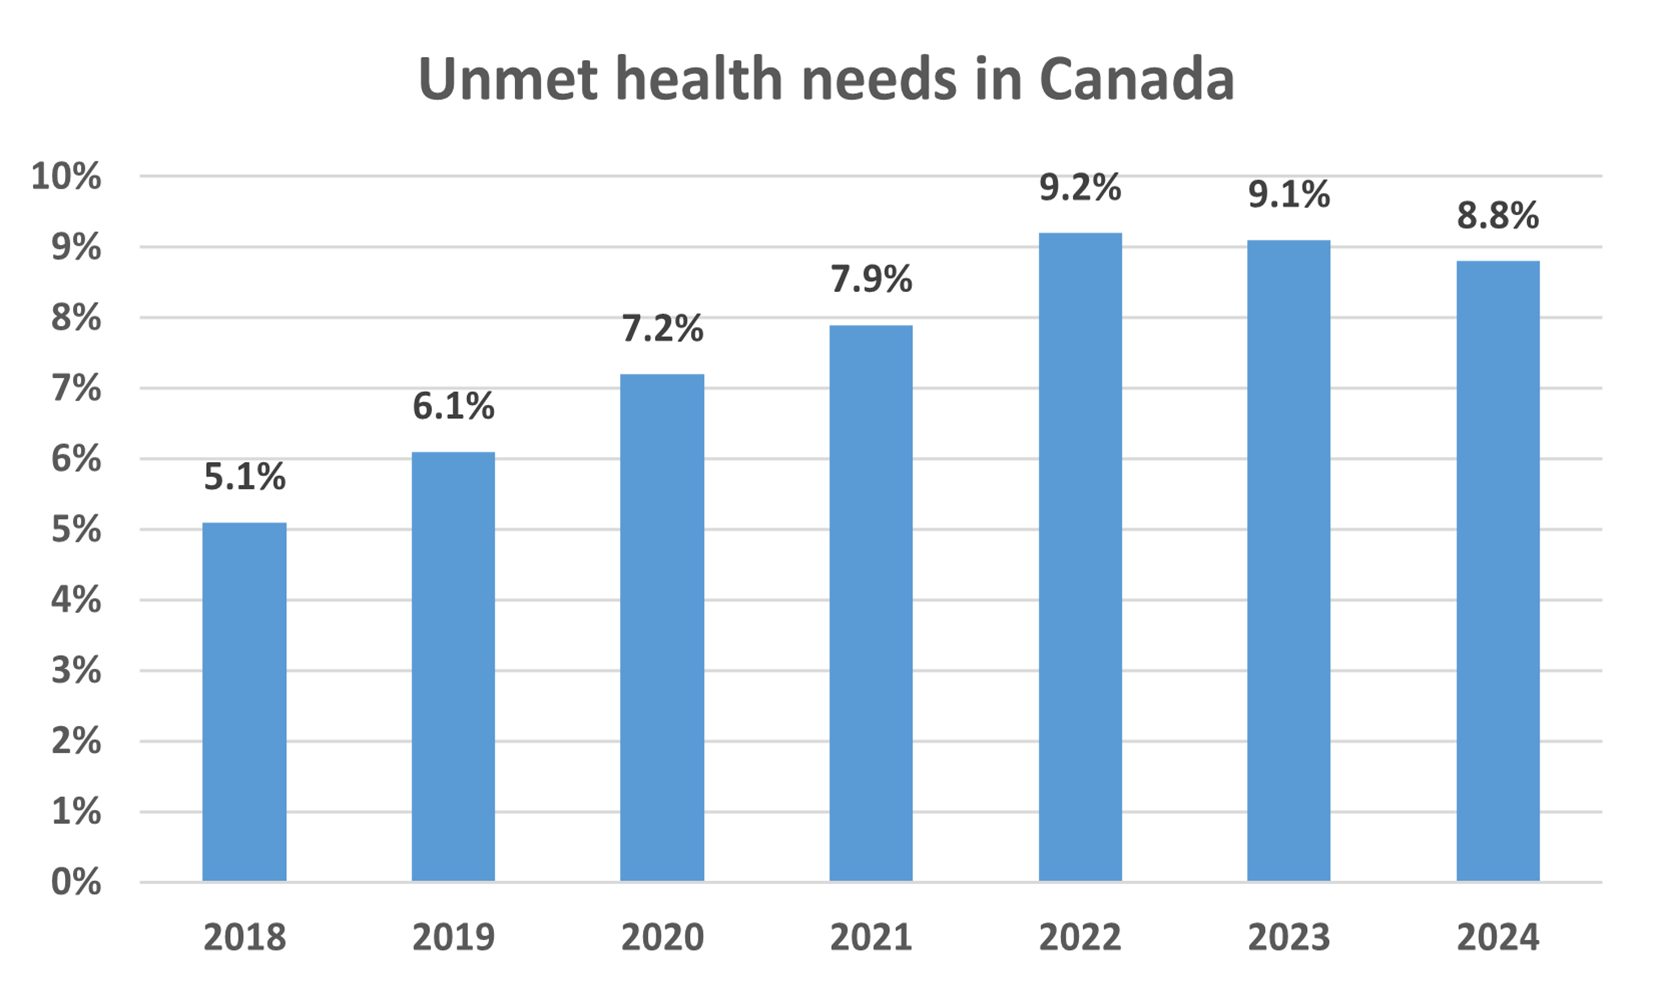
Description - Unmet health needs in Canada
- This bar chart shows the unmet health needs rate in Canada over time.
- It has a vertical axis showing percentages, from 0% to 10%, by increments of 1 percentage point.
- It has a horizontal axis showing years, from 2018 to 2024, by increments of 1 year.
- The rate was 5.1% in 2018, 6.1% in 2019, 7.2% in 2020, 7.9% in 2021, 9.2% in 2022, 9.1% in 2023 and 8.8% in 2024.
What is it?
This indicator measures the percentage of Canadians that reported that their health care needs were not met during the past 12 months.
Why is it important?
The Unmet health needs is one of the four inter-related indicators found in the Dignity pillar of Opportunity for All – Canada's First Poverty Reduction Strategy. The indicators in the Dignity pillar are meant to track the progress of initiatives used to help lift Canadians out of poverty by ensuring everyone's basic needs are met.
Notes
The source for this indicator has been updated from the Canadian Community Health Survey (CCHS) to the Canadian Income Survey (CIS). Unmet health needs content was first collected by the CIS in 2019, for reference year 2018, and is now conducted annually. The question that determines whether a person had unmet health needs is: "During the past 12 months, was there ever a time when you felt that you needed health care, other than homecare services, but you did not receive it?" Those who answer "Yes" are asked subsequent questions such as the reason(s) and the type(s) of care needed. This module is only asked of one person randomly selected among persons aged 15 years and over in each CIS household. Users should be aware that for data prior to 2022, the random selection was done among persons aged 16 years and over. For more information on CIS unmet health needs estimates and comparisons to estimates produced using the CCHS, please see: Canadian Income Survey: Food insecurity and unmet health care needs, 2018 and 2019.
Program
Canadian Income Survey – Annually
Source
Statistics Canada. Table 13-10-0836-01 Unmet health care needs by gender and age group.
Note: 2025 data will be available in spring 2027.
Food insecurity
In 2024, 24.0% of Canadians lived in households that had experienced some form of food insecurity, down slightly from 25.7% in 2023. More information on food insecurity
More information on food insecurity
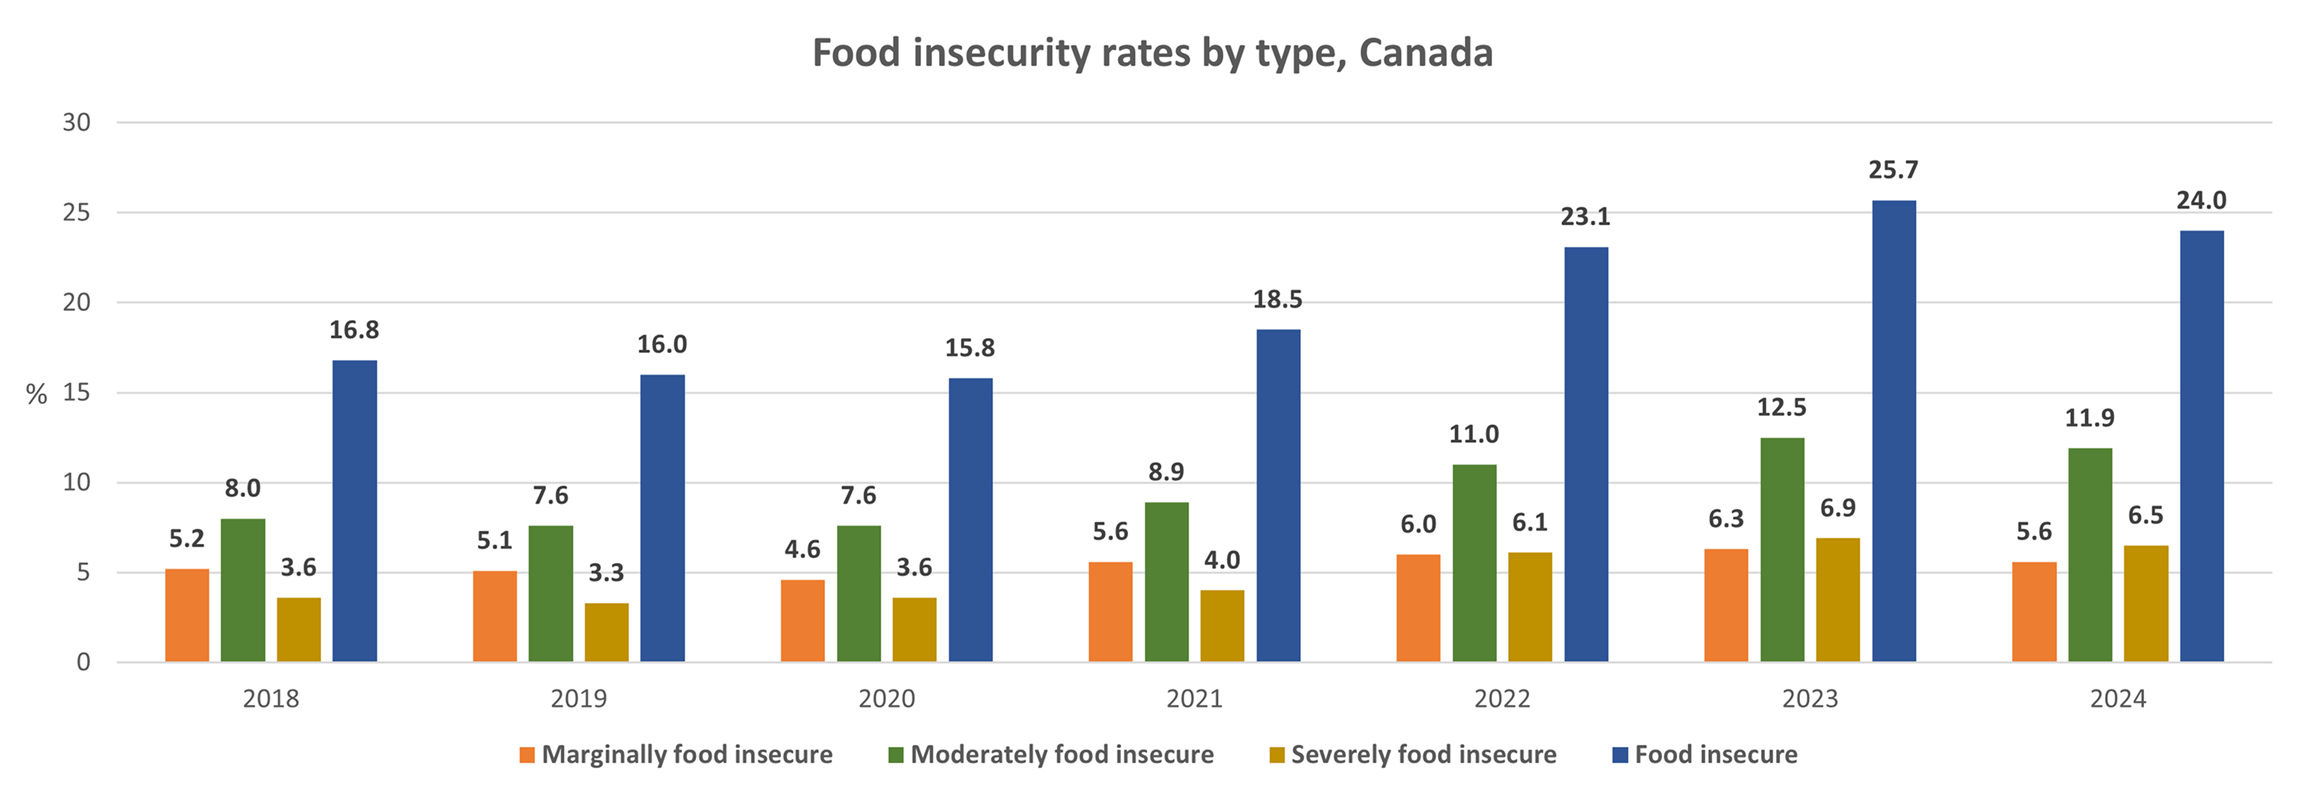
Description - Food insecurity rates by type, Canada
| 2018 | 2019 | 2020 | 2021 | 2022 | 2023 | 2024 | |
|---|---|---|---|---|---|---|---|
| Food insecure | 16.8 | 16.0 | 15.8 | 18.5 | 23.1 | 25.7 | 24.0 |
| Marginally food insecure | 5.2 | 5.1 | 4.6 | 5.6 | 6.0 | 6.3 | 5.6 |
| Moderately food insecure | 8.0 | 7.6 | 7.6 | 8.9 | 11.0 | 12.5 | 11.9 |
| Severely food insecure | 3.6 | 3.3 | 3.6 | 4.0 | 6.1 | 6.9 | 6.5 |
What is it?
This indicator measures the percentage of Canadians that do not have enough money to purchase or access a sufficient amount and variety of food to live a healthy lifestyle.
Why is it important?
The Food insecurity is one of the four inter-related indicators found in the Dignity pillar of Opportunity for All – Canada's First Poverty Reduction Strategy. The indicators in the Dignity pillar are meant to track the progress of initiatives used to help lift Canadians out of poverty by ensuring everyone's basic needs are met.
Notes
The source for this indicator has been updated from the Canadian Community Health Survey (CCHS) to the Canadian Income Survey (CIS). Food security content was first collected by the CIS in 2019, for reference year 2018, and is now conducted annually. It contains the same 18 questions used in the CCHS Household Food Security Survey Module (HFSSM), which are designed to measure food insecurity resulting from limited financial resources. The HFSSM is Canada's primary validated measure of food insecurity. For more information on CIS food insecurity estimates and comparisons to estimates produced using the CCHS, please see: Canadian Income Survey: Food insecurity and unmet health care needs, 2018 and 2019.
Program
Canadian Income Survey – Annually
Source
Statistics Canada. Table 13-10-0834-01 Food insecurity by economic family type.
Note: 2025 data will be available in spring 2027.
Opportunity and inclusion
Helping Canadians join the middle class by promoting full participation in society and equality of opportunity.
Relative low income
In 2024, 12.5% of Canadians had less than half the median after-tax income, compared with 12.1% in 2023. More information on Relative low income
More information on relative low income
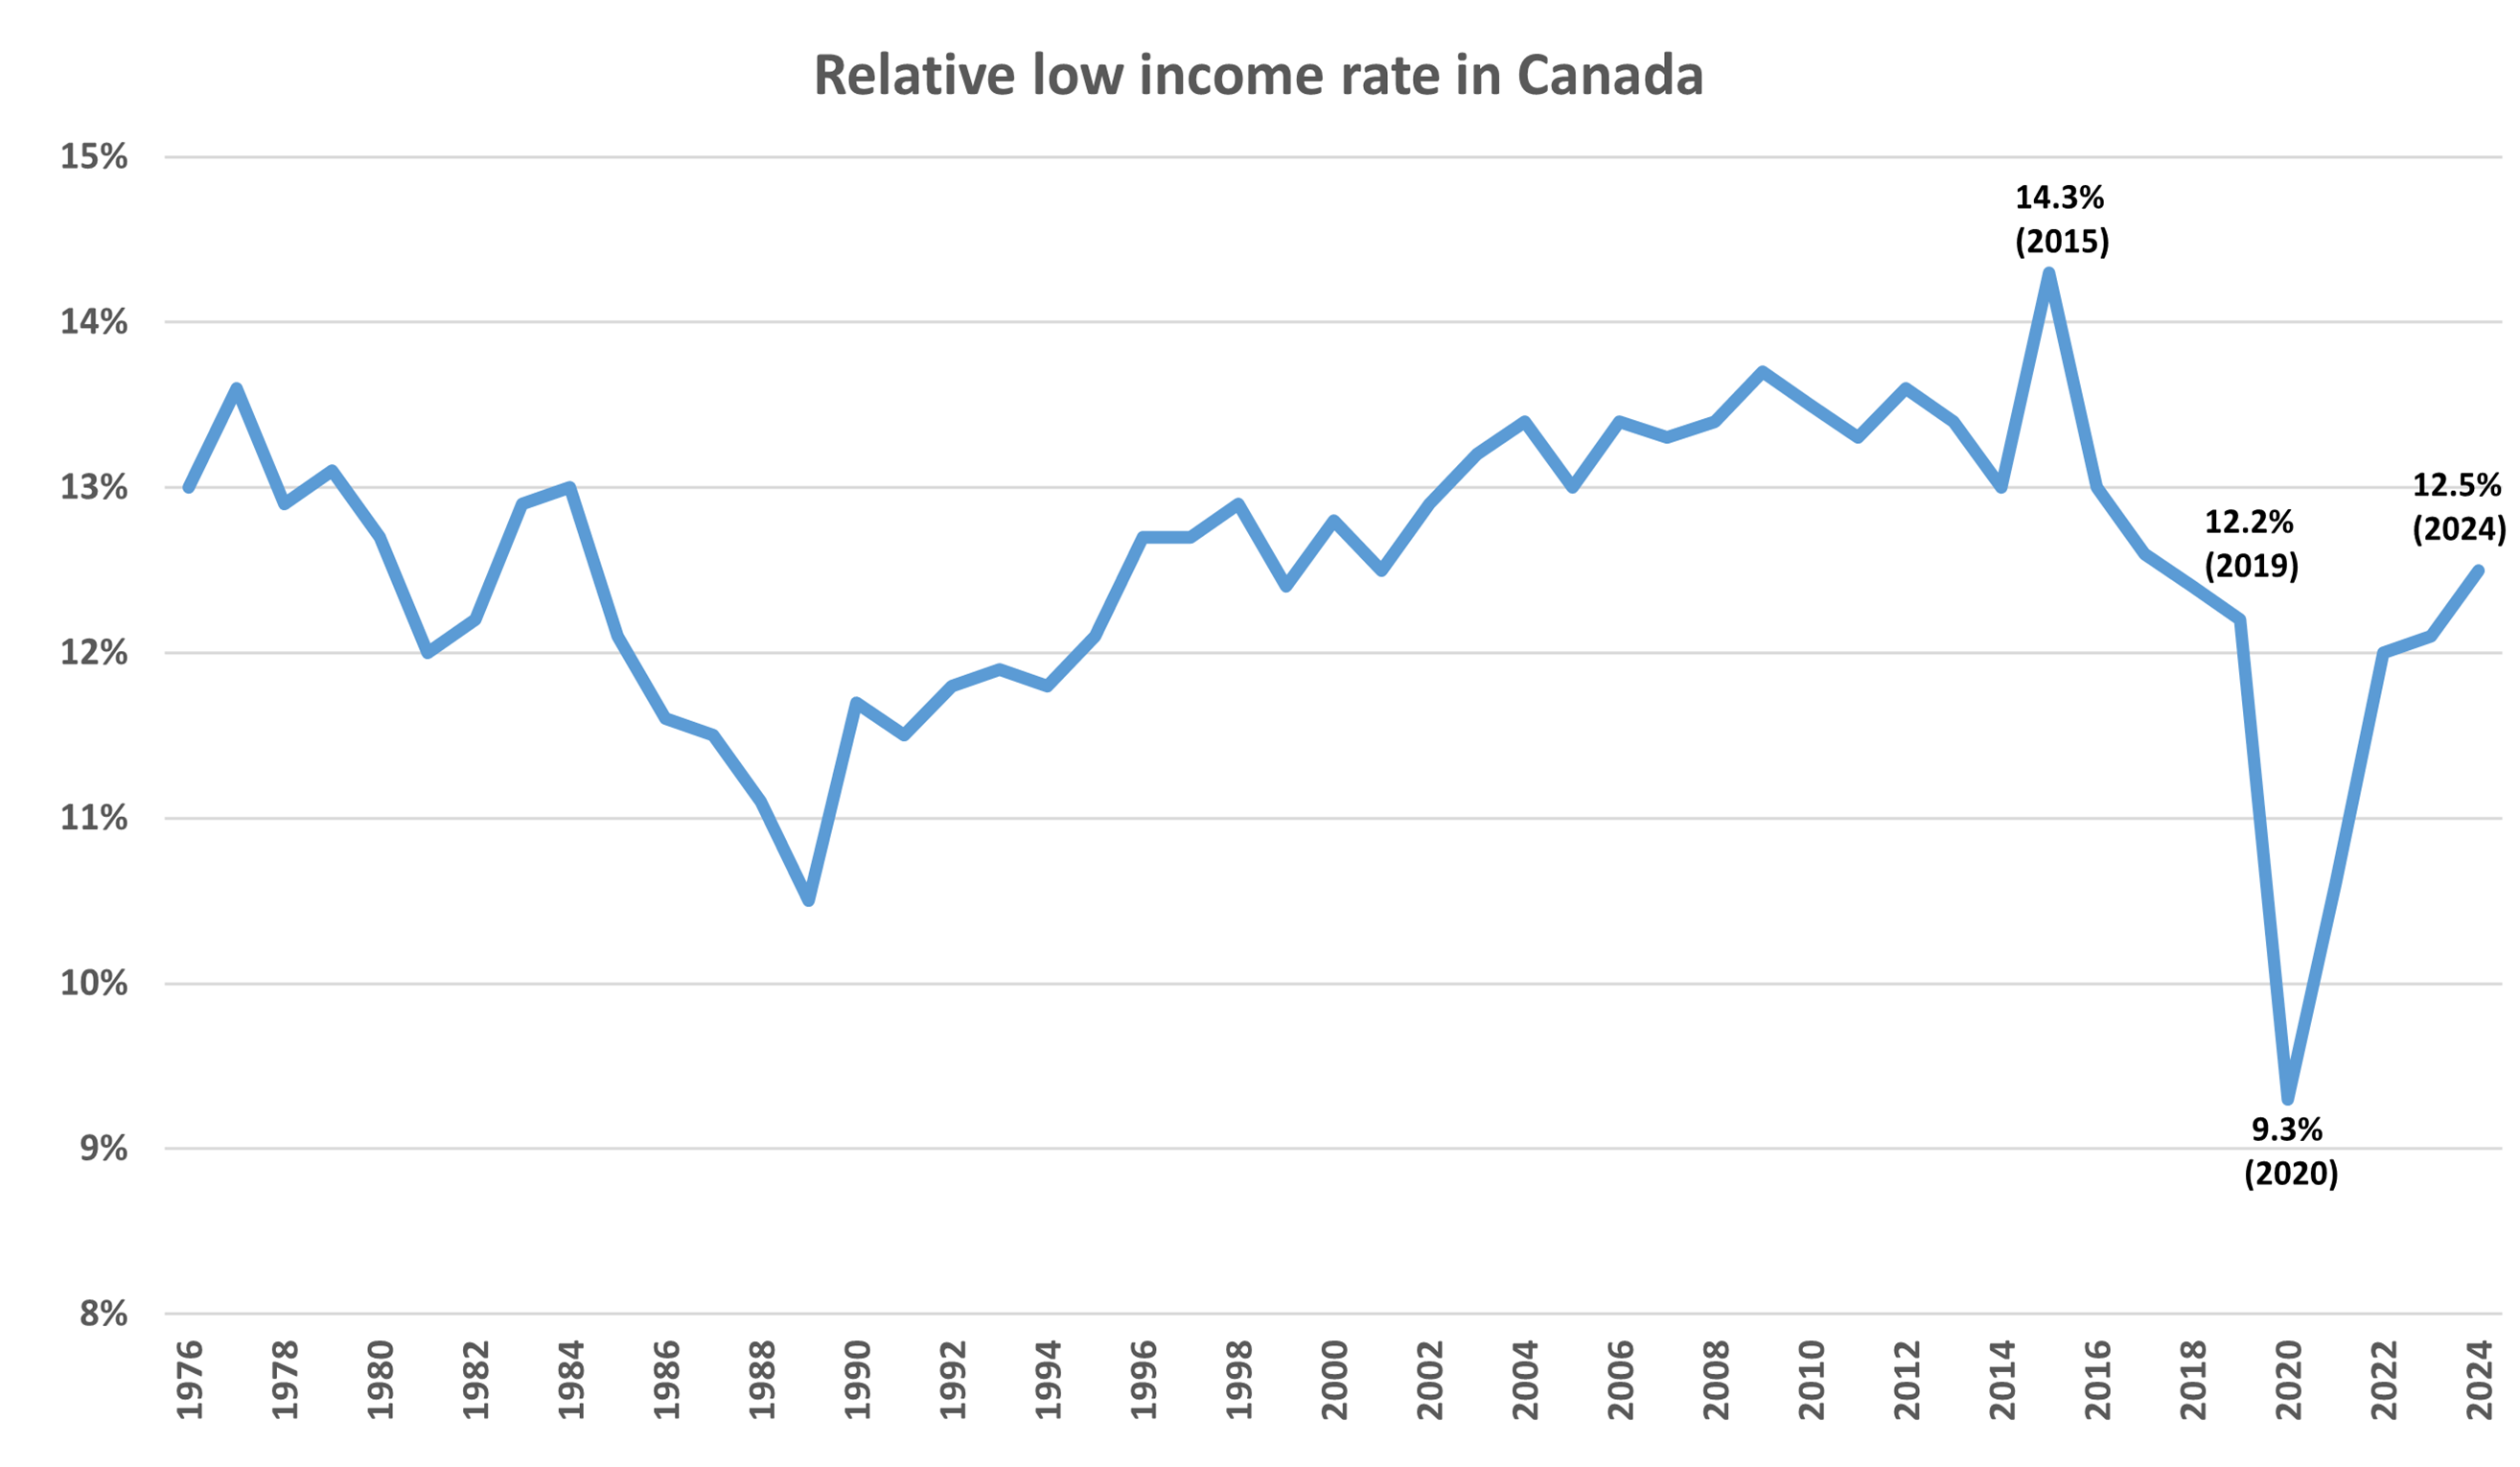
Description - Relative low income rate in Canada
- This line chart shows the relative low income rate in Canada over time.
- It has a vertical axis showing percentages, from 8% to 15%, by increments of 1 percentage point.
- It has a horizontal axis showing years, from 1976 to 2024, by increments of 2 years.
- The line begins at 13.0% and, although fairly jagged, shows a general downward trend until 1989. It then follows a general upward trend to reach 14.3% in 2015, before dropping to a low of 9.3% in 2020 and then increasing again until 2024, to 12.5%.
- Four recent data points are highlighted: 14.3% in 2015 (highest point on the chart), 12.2% in 2019, 9.3% in 2020 and 12.5% in 2024.
What is it?
The Relative low income indicator uses Statistics Canada’s Low Income Measure (LIM) to measure the proportion of Canadians living in low income. According to the LIM, individuals live in low income if their household after-tax income falls below half of the median after-tax income, adjusting for household size. The median income is the middle of the income distribution: it is the amount at which half the population has more income and half the population has less income.
Why is it important?
The Relative low income is one of the four inter-related indicators found in the Opportunity and Inclusion pillar of Opportunity for All – Canada's First Poverty Reduction Strategy. The indicators in the Opportunity and Inclusion pillar are meant to track the progress of initiatives used to help Canadians join the middle class by promoting full participation in society and equality of opportunity.
Program
Canadian Income Survey - Annually
Source
Statistics Canada. Table 11-10-0135-01 Low income statistics by age, gender and economic family type.
Note: 2025 data will be available in spring 2027.
Bottom 40% income share
In 2024, 20.8% of total after-tax income went to Canadians in the bottom 40% of the income distribution, slightly down from 21.0% in 2023. More information on Bottom 40% income share
More information on bottom 40 percent income share
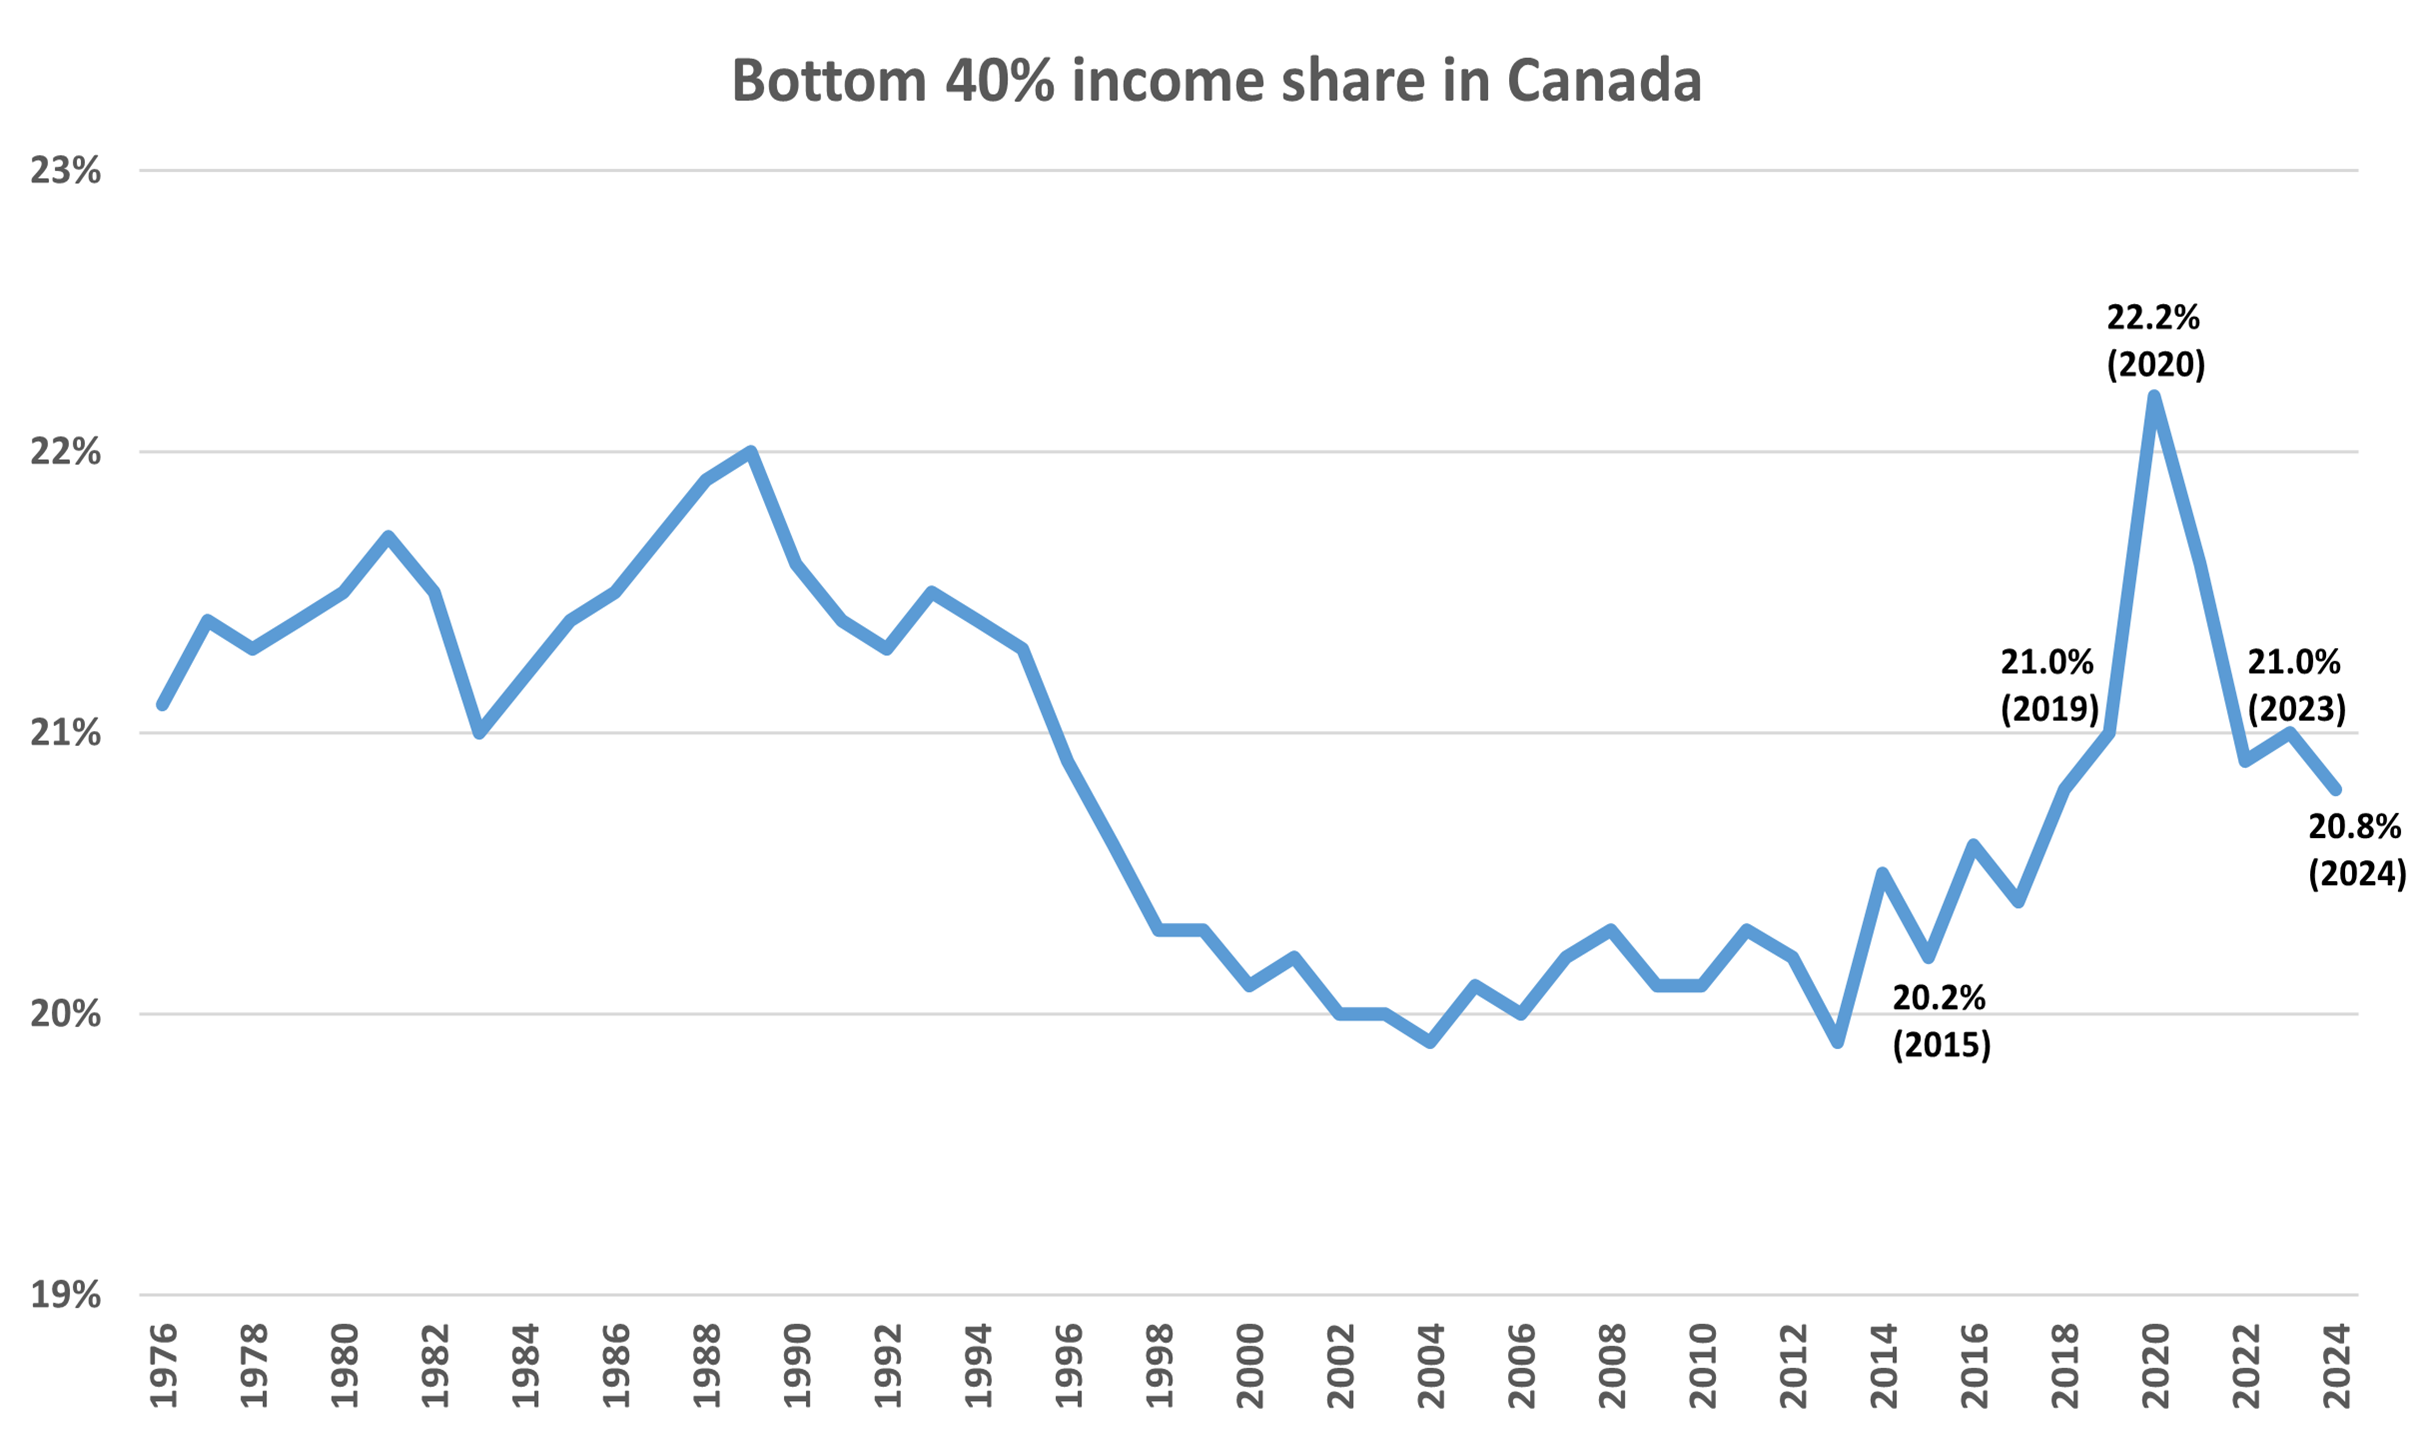
Description - Bottom 40% share in Canada
- This line chart shows the bottom 40% share rate in Canada over time.
- It has a vertical axis showing percentages, from 19% to 23%, by increments of 1 percentage point.
- It has a horizontal axis showing years, from 1976 to 2024, by increments of 2 years.
- Five recent data points are highlighted: 20.2% in 2015, 21.0% in 2019, 22.2% in 2020, 21.0% in 2023 and 20.8% in 2024.
What is it?
The Bottom 40% income share indicator measures the share of total after-tax income held by the 40% of the population at the bottom of the income distribution. The after-tax income is adjusted for household size in order to take into account the economies of scale present in larger households.
Why is it important?
The bottom 40% income share is one of the four inter-related indicators found in the Opportunity and Inclusion pillar of Opportunity for All – Canada's First Poverty Reduction Strategy. The indicators in the Opportunity and Inclusion pillar are meant to track the progress of initiatives used to help Canadians join the middle class by promoting full participation in society and equality of opportunity.
Program
Canadian Income Survey - Annually
Source
Statistics Canada. Table 11-10-0193-01 Upper income limit, income share and average of adjusted market, total and after-tax income by income decile.
Note: 2025 data will be available in spring 2027.
Youth engagement
In 2025, 10.3% of Canadian youth (aged 15 to 24) were not in employment, education or training, up from 9.8% in 2024. More information on Youth engagement
More information on youth engagement
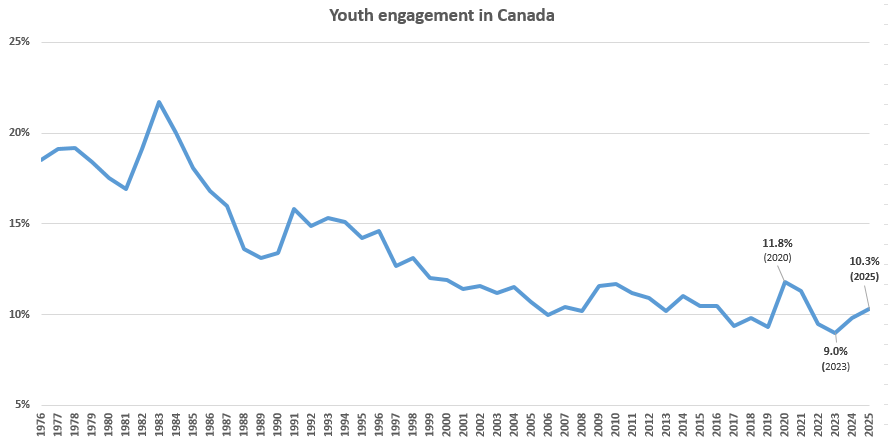
Description - Youth engagement in Canada
- This line chart shows the change in the youth engagement rate in Canada over time.
- It has a vertical axis showing percentages, from 5 to 25, by increments of 5 percentage points.
- It has a horizontal axis showing years, from 1976 to 2025, by increments of 1 year.
- The line begins at 18.5% in 1976. There has been a general downward trend from 1976 to 2025. In 2020, there was a recent high of 11.8%.
- Three recent data points are highlighted: 11.8% in 2020, 9.0% in 2023 and 10.3% in 2025.
What is it?
The Youth engagement indicator measures the proportion of youth aged 15 to 24 who are not in employment, education or training (NEET).
Why is it important?
The Youth engagement is one of the four inter-related indicators found in the Opportunity and Inclusion pillar of Opportunity for All – Canada's First Poverty Reduction Strategy. The indicators in the Opportunity and Inclusion pillar are meant to track the progress of initiatives used to help Canadians join the middle class by promoting full participation in society and equality of opportunity.
Program
Labour Force Survey – monthly with indicator being updated annually
Source
Statistics Canada. Custom tabulation.
Note: 2026 data will be available in Spring 2026.
Literacy and numeracy
In 2022, 18.1% of 15-year-old Canadians had low literacy skills, up from 13.8% in 2018. The percentage of adults (aged 16 to 65) with low literacy skills was 17.8% in 2022, compared with 16.5% in 2012.
Among 15-year-old Canadians, 21.6% had low numeracy skills in 2022, an increase from 16.3% in 2018. The percentage of adults (aged 16 to 65) with low numeracy skills was 19.0% in 2022, down from 22.5% in 2012. More information on Literacy and numeracy
More information on literacy and numeracy
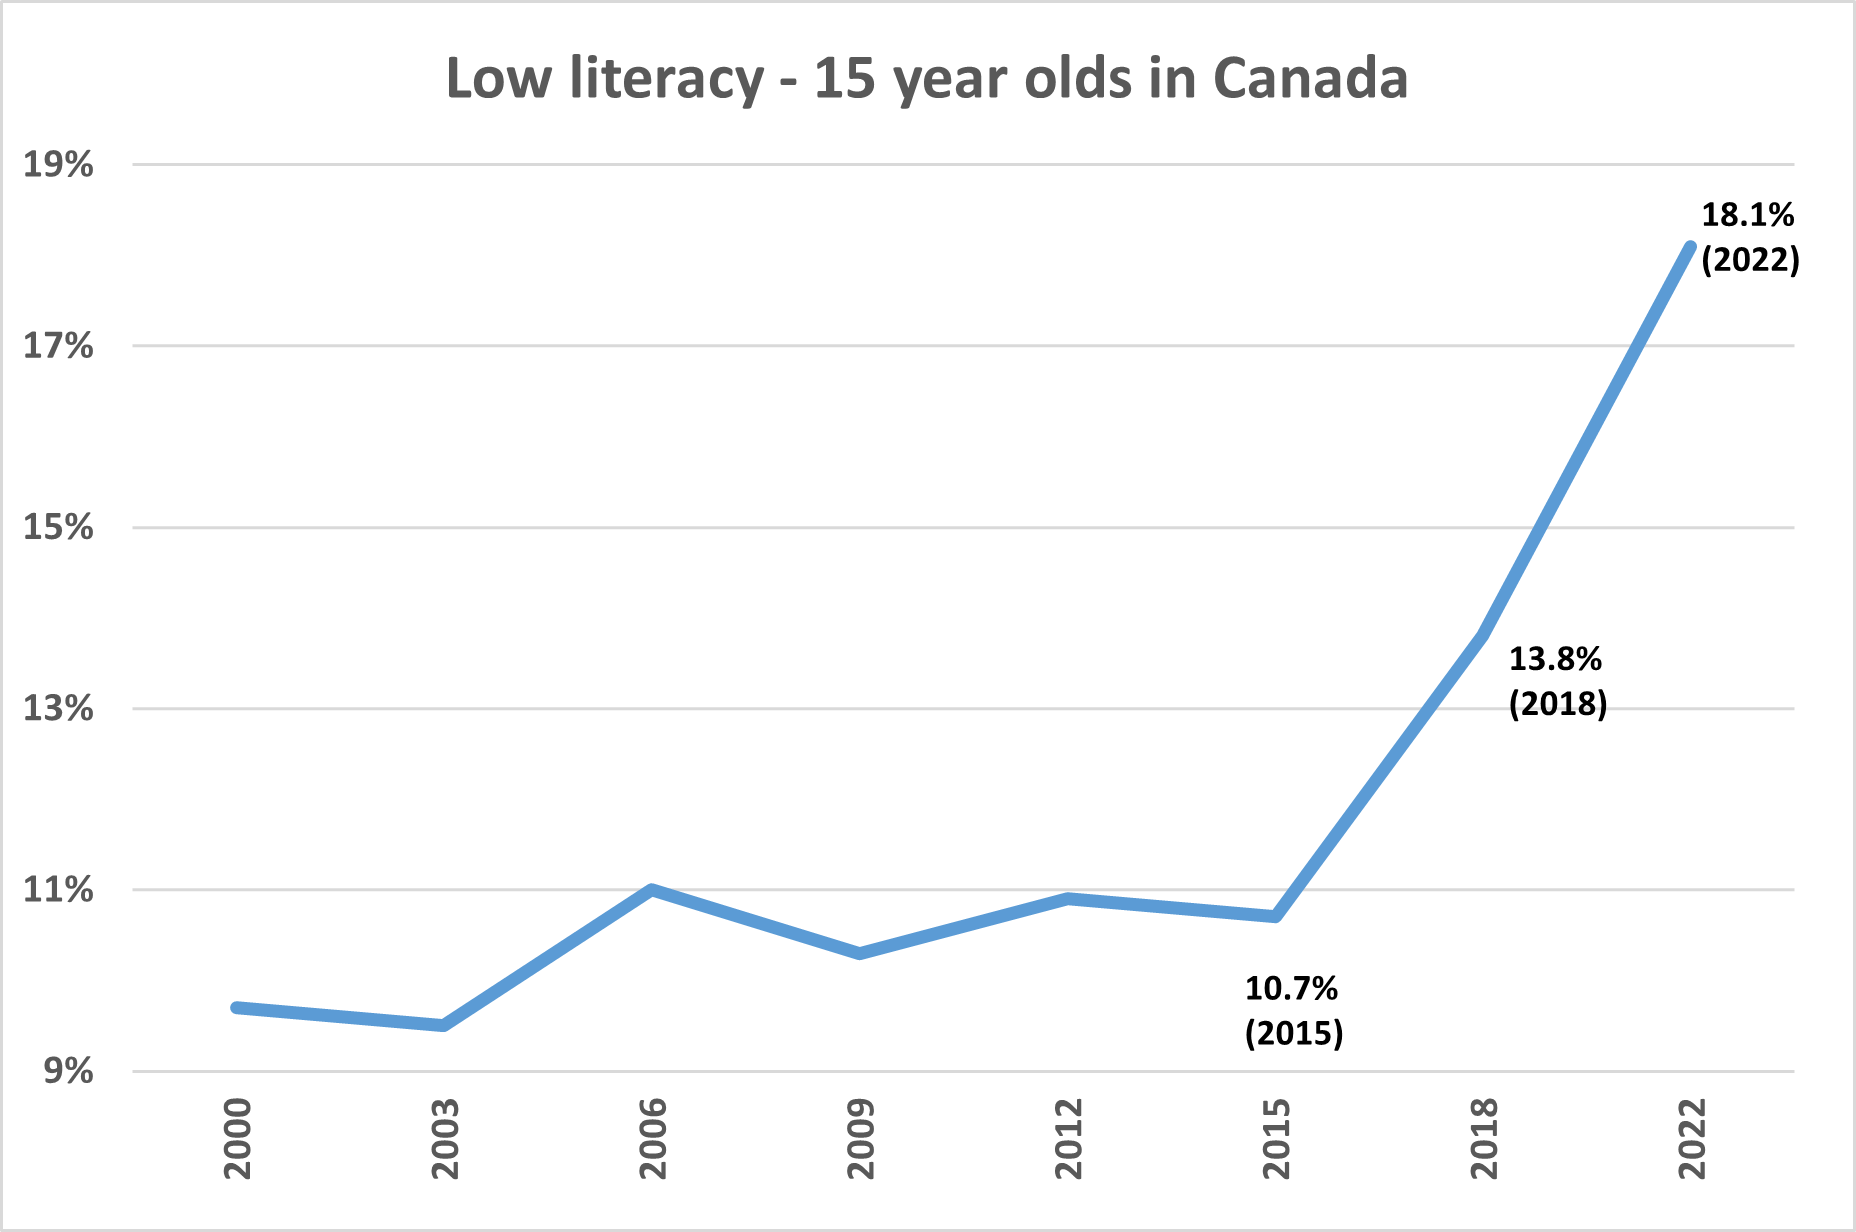
Description - Low literacy – 15 year olds in Canada
- This line chart shows the low literacy rate for 15-year-olds in Canada over time.
- It has a vertical axis showing percentages, from 9% to 19%, by increments of 2 percentage points.
- It has a horizontal axis showing years, from 2000 to 2022, by increments of 3 years (4 years between 2018 and 2022).
- The line shows that the low literacy rate for 15-year-olds was 9.7% in 2000. There were a few slight increases and decreases until 2015, when the rate was 10.7%. The low literacy rate then increased to 13.8% in 2018, and to 18.1% in 2022.
- The three most recent data points are highlighted: 10.7% in 2015, 13.8% in 2018 and 18.1% in 2022.
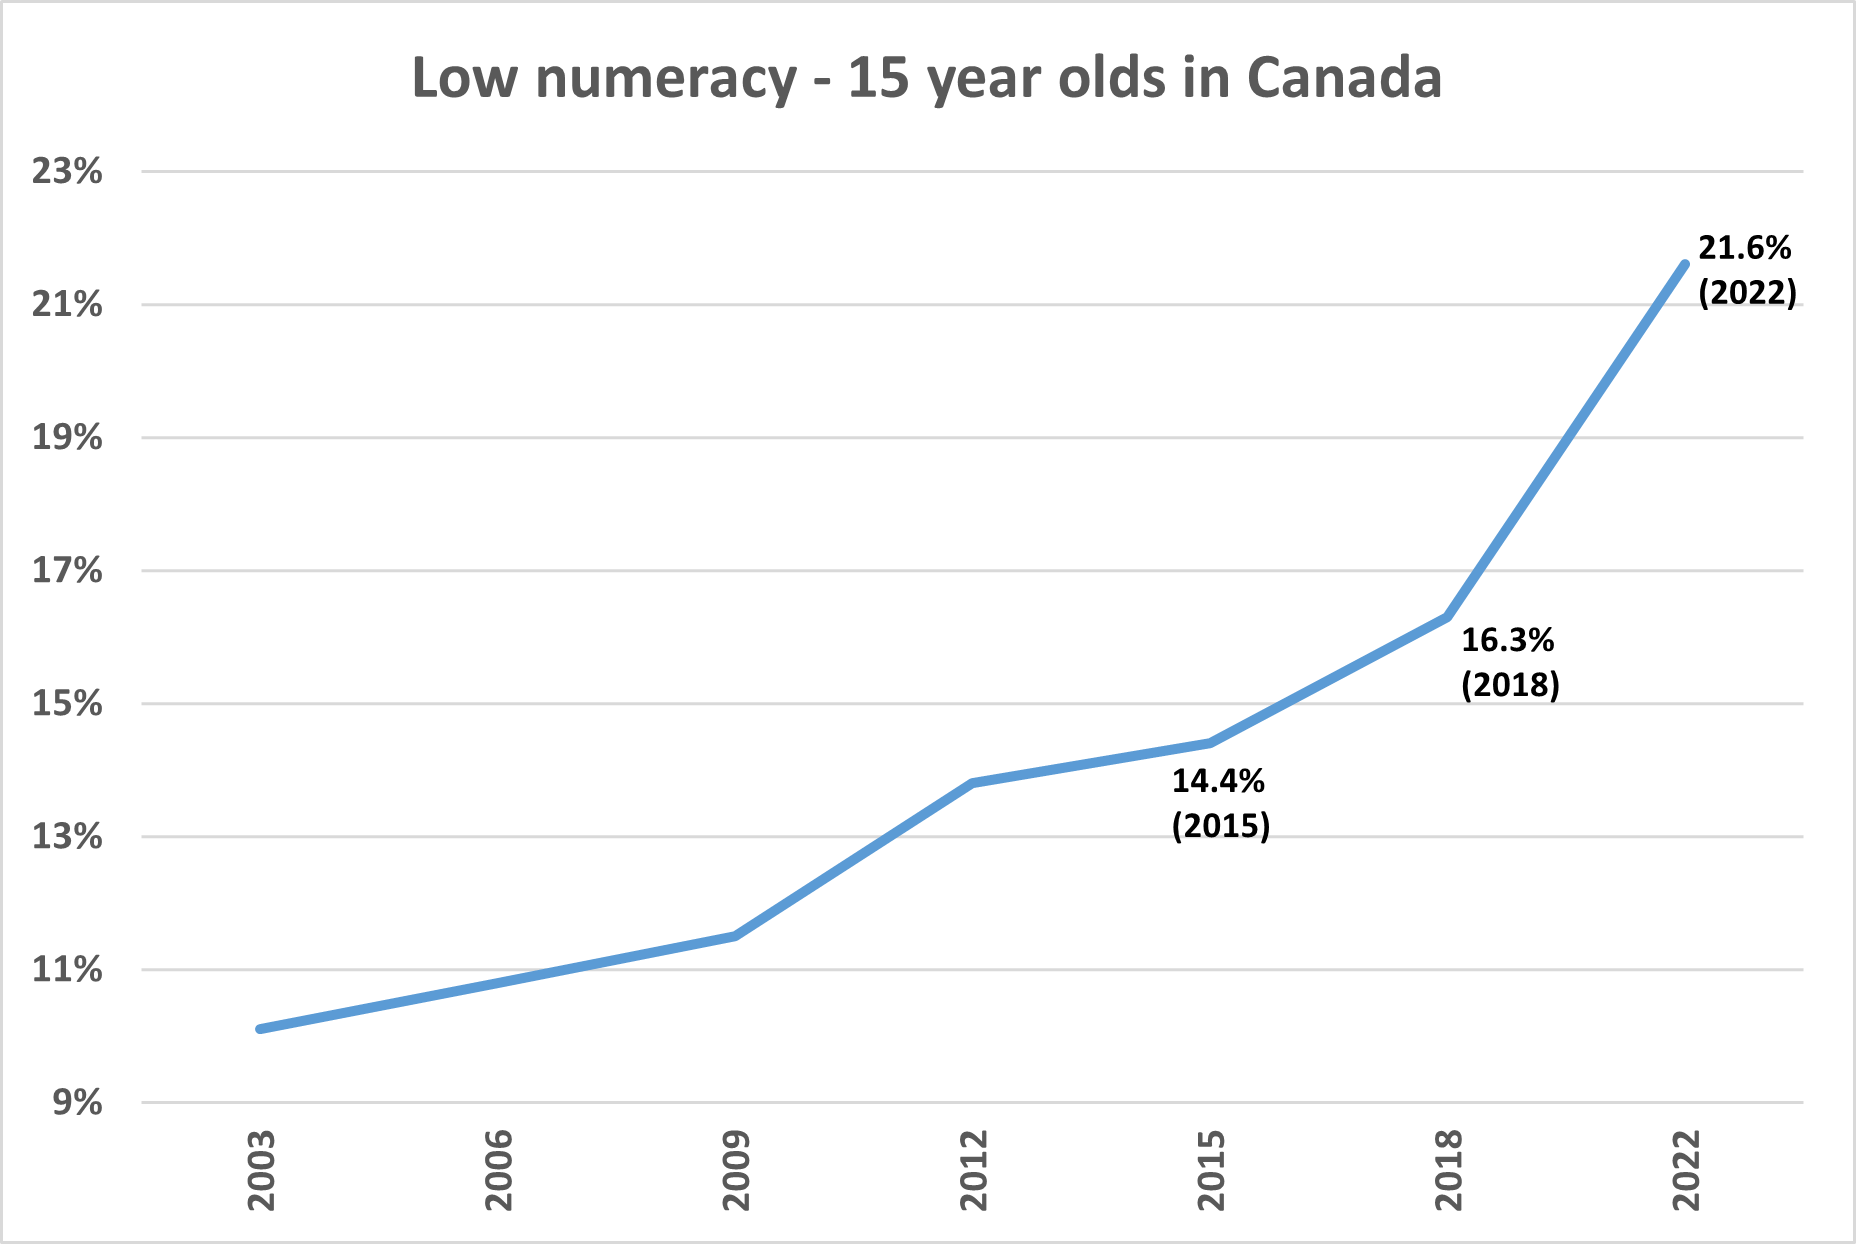
Description - Low numeracy – 15 year olds in Canada
- This line chart shows the low numeracy rate for 15-year-olds in Canada over time.
- It has a vertical axis showing percentages, from 9% to 23%, by increments of 2 percentage points.
- It has a horizontal axis showing years, from 2003 to 2022, by increments of 3 years (4 years between 2018 and 2022).
- The line shows that the low numeracy rate was 10.1% in 2003. It followed an upward trend until 2022, when the rate reached 21.6%.
- The three most recent data points are highlighted: 14.4% in 2015, 16.3% in 2018 and 21.6% in 2022.
What is it?
The Literacy and Numeracy indicator measures the proportion of individuals who have a level of knowledge and skills in reading, writing and mathematics to permit them to fully participate in society. Low literacy indicates limited ability in understanding, using, reflecting on and engaging with written text which enable basic participation in society. Low numeracy indicates limited ability in communicating, using and interpreting mathematics in daily life.
Why is it important?
The Literacy and Numeracy indicator is one of the four inter-related indicators found in the Opportunity and Inclusion pillar of Opportunity for All – Canada's First Poverty Reduction Strategy. The indicators in the Opportunity and Inclusion pillar are meant to track the progress of initiatives used to help Canadians join the middle class by promoting full participation in society and equality of opportunity.
Program
Program for International Student Assessment – Every three years
Source
OECD. Programme for International Student Assessment (PISA).
Note: 2025 data will be available in 2026.
For data on adults, the Program for the International Assessment of Adult Competencies occurs every 10 years. To allow for comparisons between the 2012 and 2022 cycles, territories were excluded because they were not collected in 2022. In addition, cases done through a doorstep interview were excluded from the 2022 data. Please see Literacy, numeracy and adaptive problem-solving skills of Canadians: Results from the 2022 Programme for the International Assessment of Adult Competencies for more information.
Resilience and security
Supporting the middle class by protecting Canadians from falling into poverty and by supporting income security and resilience.
Median hourly wage
In 2025, the median hourly wage for Canadian employees was $30.77, slightly up from $30.62 in 2024 (in 2025 dollars). More information on Median hourly wage
More information on median hourly wage
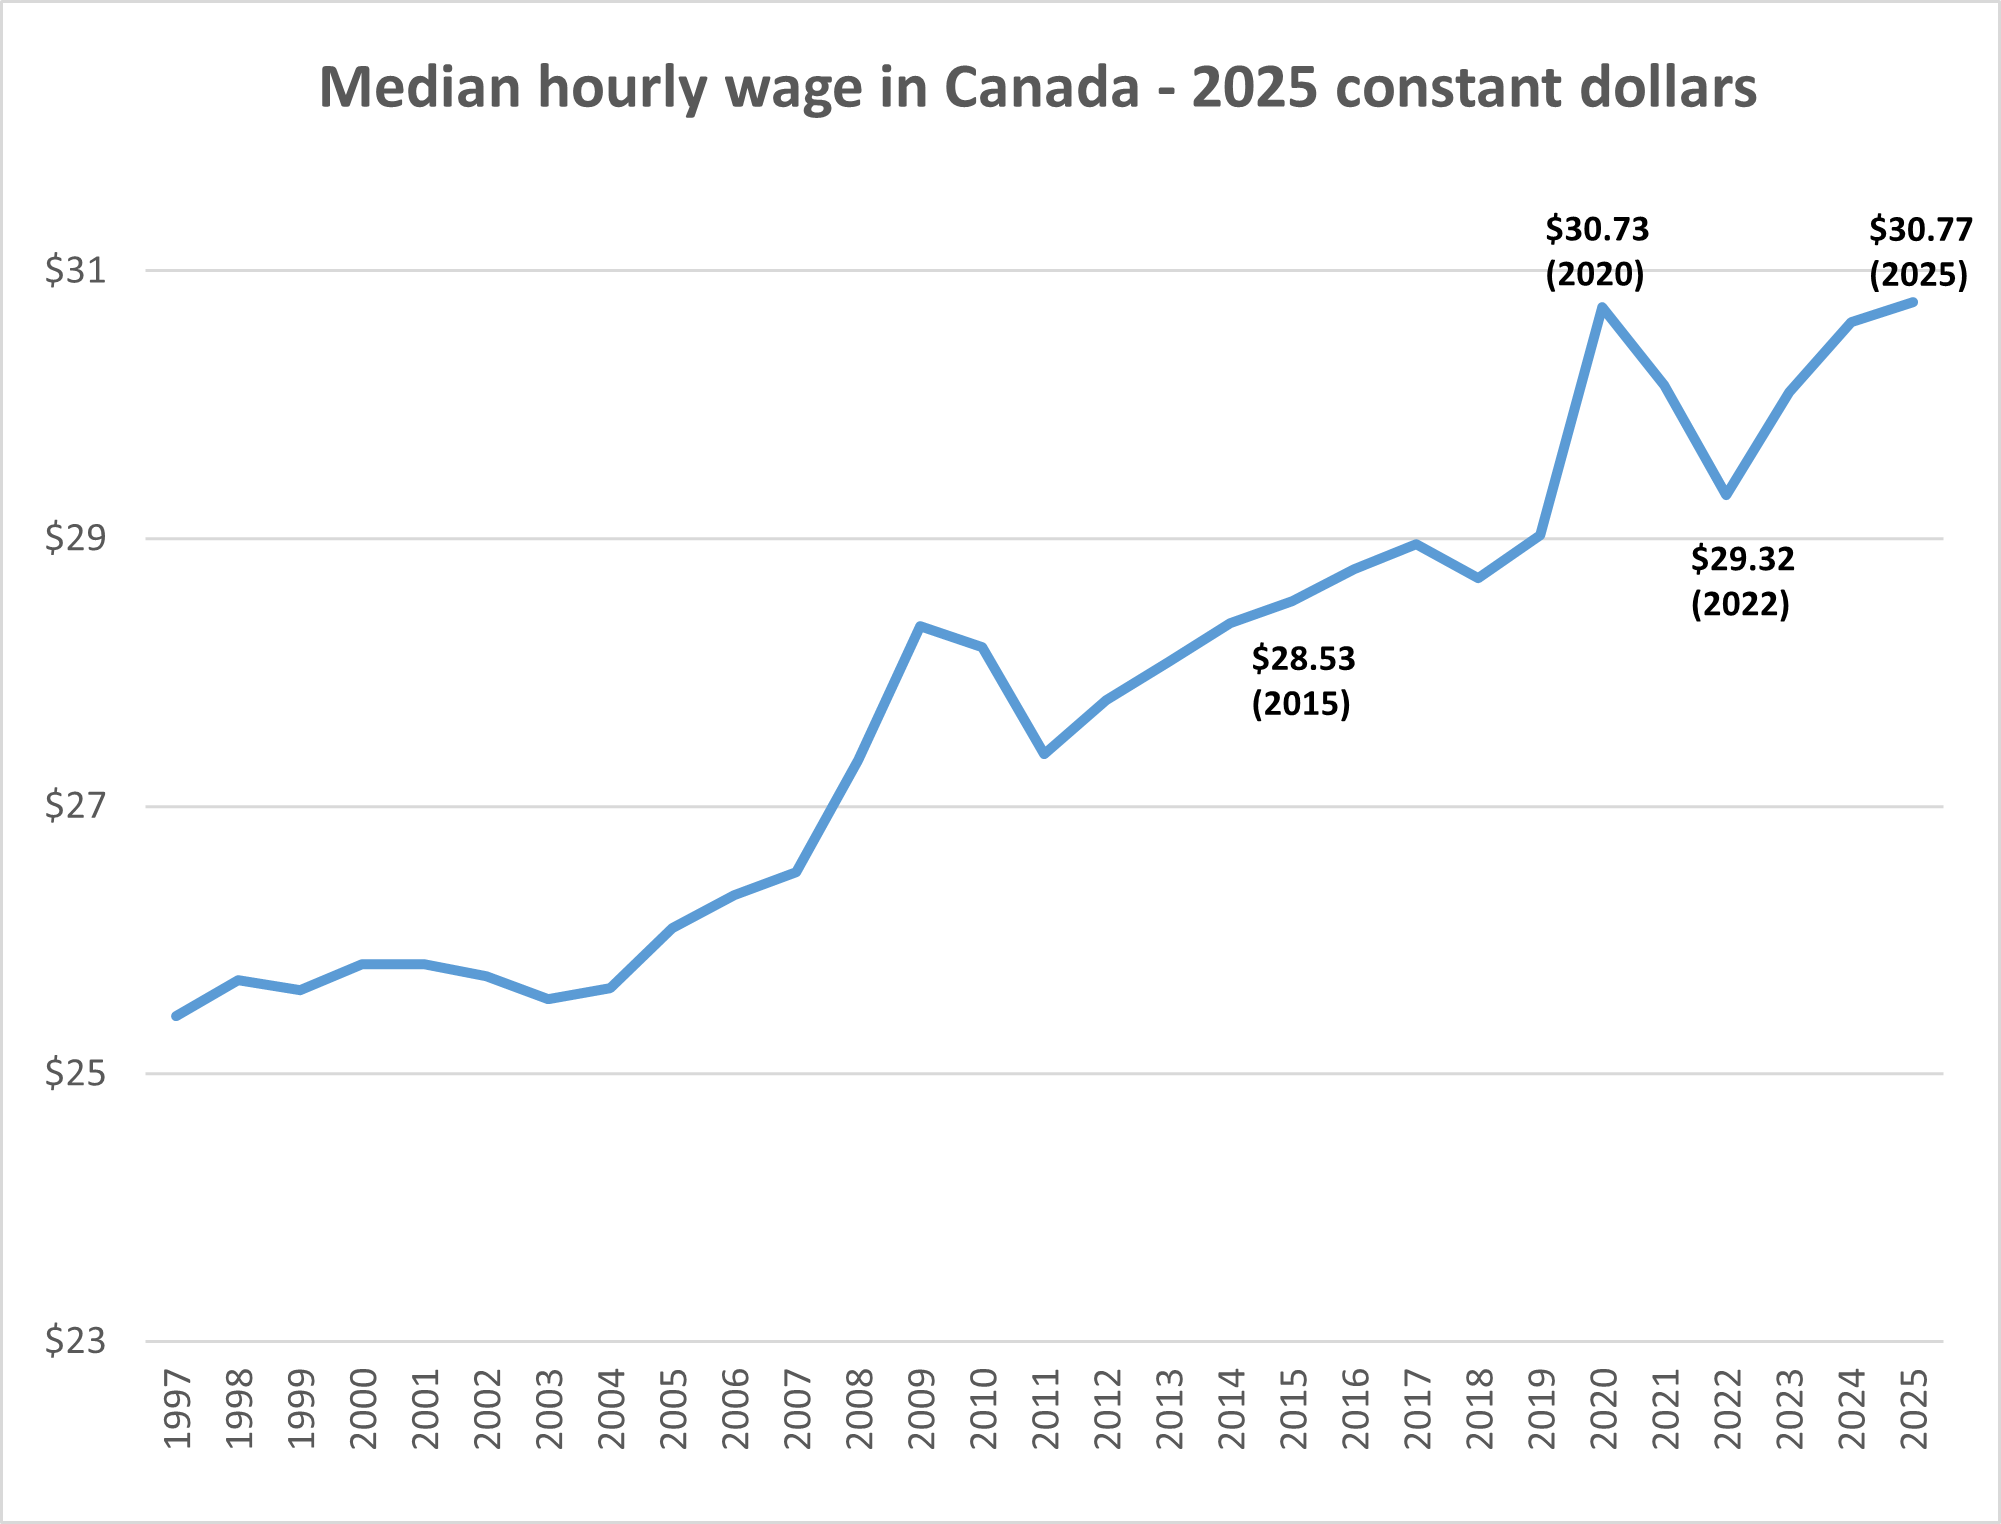
Description - Median hourly wage in Canada - 2025 constant dollars
- This line chart shows the median hourly wage rate in 2025 constant dollars in Canada, over time.
- It has a vertical axis showing dollars, from 23 to 31, by increments of 2 dollars.
- It has a horizontal axis showing years, from 1997 to 2025, by increments of 1 year.
- The line shows that the median hourly wage was $25.43 in 1997 and $25.64 in 2004. From 2004 to 2009, it rose steadily to $28.35. It dropped to $27.39 in 2011, and then followed a slight upward trend until 2017, before increasing sharply to $30.73 in 2020. Following 2020, the line decreased to $29.32 in 2022, before increasing to $30.77 in 2025.
- Four data points are highlighted: $28.53 in 2015, $30.73 in 2020, $29.32 in 2022 and $30.77 in 2025.
What is it?
The hourly wage at which half the population has a higher wage and half the population has a lower wage.
Why is it important?
The Median hourly wage indicator is one of the four inter-related indicators found in the Resilience and Security pillar of Opportunity for All – Canada's First Poverty Reduction Strategy. The indicators in the Resilience and Security pillar are meant to track the progress of initiatives used to support the middle class by protecting Canadians from falling into poverty and by supporting income security and resilience.
Notes
The annual Canada-level Consumer Price Index (CPI) value was used to convert current dollars into constant dollars.
For example, to convert the 2024 current dollar value into 2025 constant dollars, the following was done: $30.00 (2024 value), divided by 160.9 (2024 CPI), multiplied by 164.2 (2025 CPI) = $30.62 (2024 value converted to 2025 dollars).
Program
Labour Force Survey – monthly with indicator being updated annually
Source
Labour Force Survey, Statistics Canada. Table 14-10-0417-01 Employee wages by occupation, annual.
Consumer Price Index, Statistics Canada. Table 18-10-0005-01 Consumer Price Index, annual average, not seasonally adjusted.
Average poverty gap
In 2024, Canadian families and unattached individuals with incomes below the poverty line were, on average, 34.1% below this line, up from 33.1% in 2023, using the 2023-base MBM methodology. More information
More information on average poverty gap
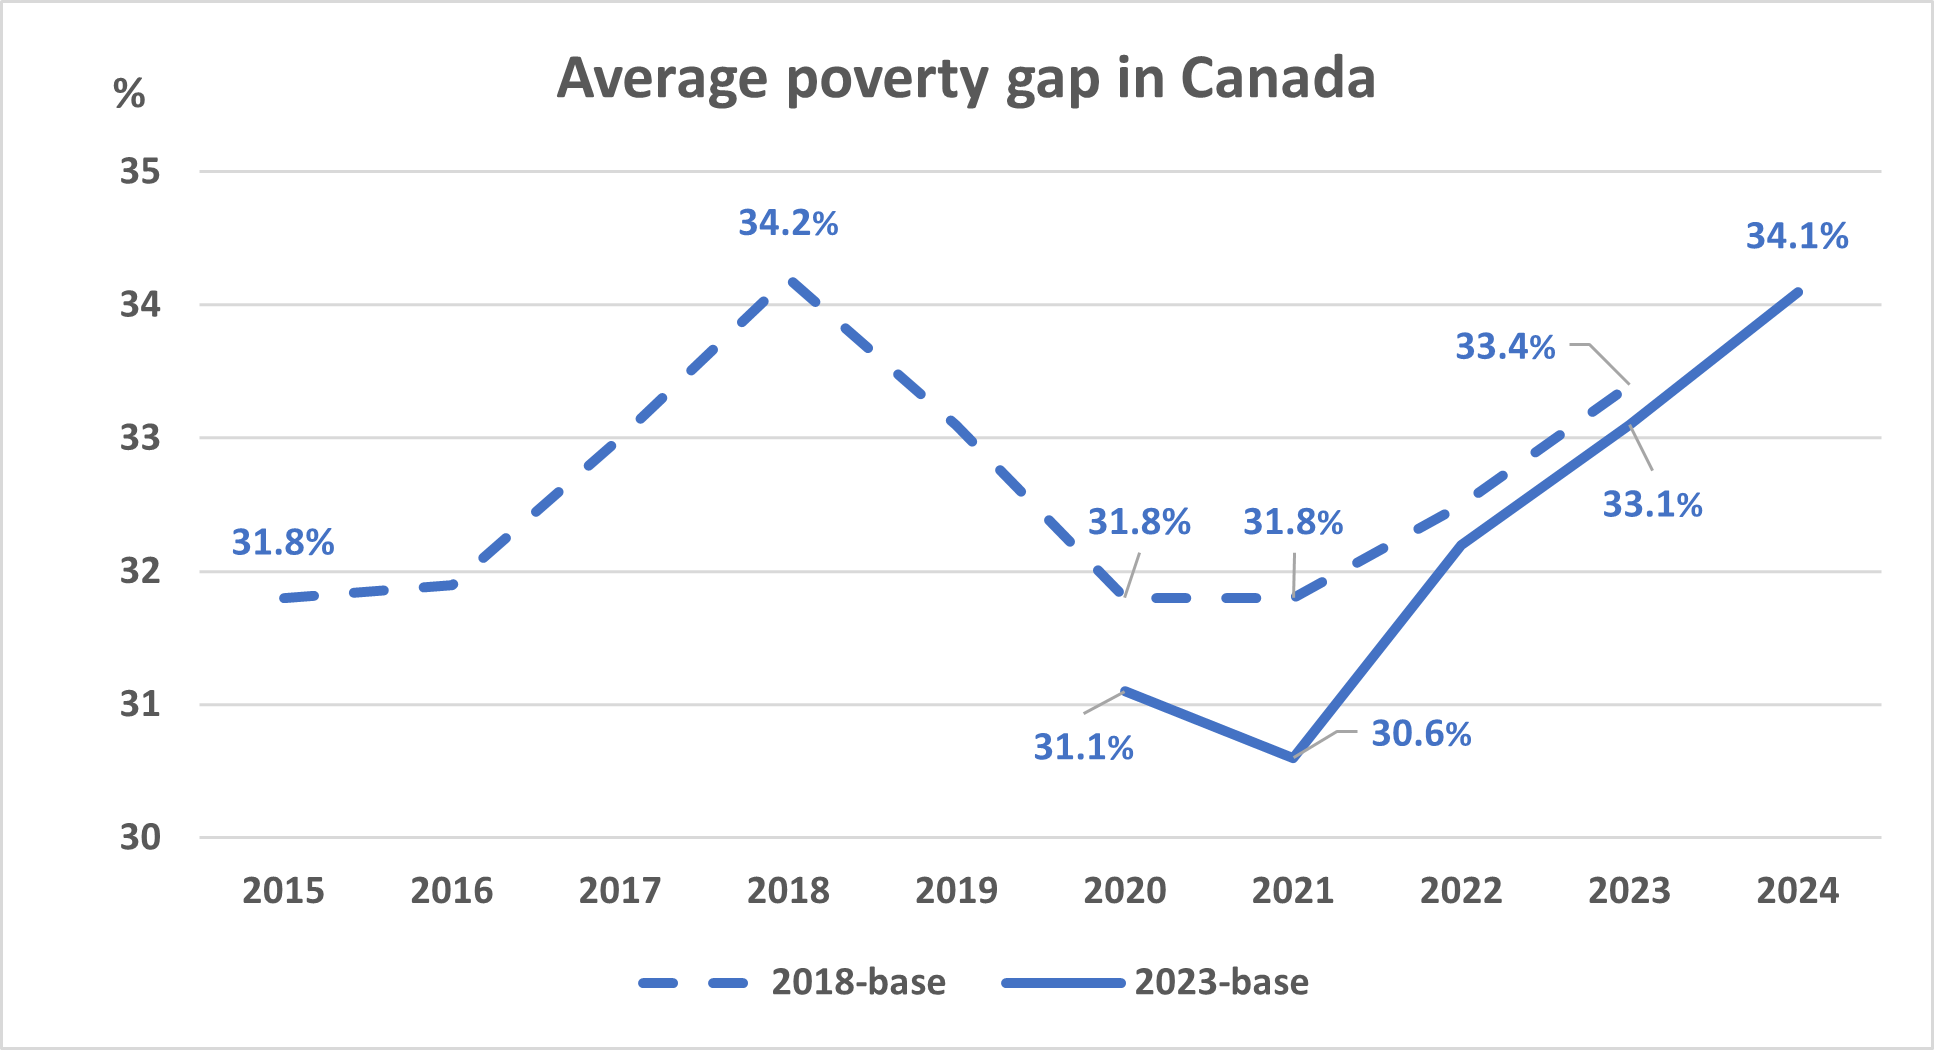
Description - Average poverty gap in Canada
- This line chart shows the average poverty gap rate in Canada over time.
- It has a vertical axis showing percentages, from 30% to 35%, by increments of 1 percentage point.
- It has a horizontal axis showing years, from 2015 to 2024, by increments of 1 year.
- The dashed line (2018-base) shows that the average poverty gap rate was 31.8% in 2015, before increasing to 34.2% in 2018, and falling back to a low of 31.8% in 2020 and 2021. The average poverty gap rate then increased again to reach 33.4% in 2023.
- The solid line (2023-base) shows that the average poverty gap rate was 31.1% in 2020, the first available reference year for the 2023-base MBM methodology. In 2021, it falls to 30.6% and has since been increasing to 34.1% in 2024.
- The dashed line (2018-base) has five data points highlighted: 31.8% in 2015, 34.2% in 2018, 31.8% in 2020 and 2021 and 33.4% in 2023.
- The solid line (2023-base) has four data points highlighted: 31.1% in 2020, 30.6% in 2021, 33.1% in 2023 and 34.1% in 2024.
What is it?
The Average poverty gap indicator measures the average shortfall below Canada’s Official Poverty Line for those living in poverty.
Once it has been determined that an individual is living below the poverty line, the poverty gap ratio can be calculated by using the amount that the person’s family disposable income is below the poverty line, expressed as a percentage of the poverty line. For example, an individual living in a family with disposable income of $15,000 and a poverty line of $20,000 would have a poverty gap of $5,000. In percentage terms, the “gap ratio” would be 25%. The average gap ratio for a given population is the average of these values as calculated for each person.
Why is it important?
The Average poverty gap is one of the four inter-related indicators found in the Resilience and Security pillar of Opportunity for All – Canada's First Poverty Reduction Strategy. The indicators in the Resilience and Security pillar are meant to track the progress of initiatives used to support the middle class by protecting Canadians from falling into poverty and by supporting income security and resilience. A smaller average poverty gap from one time period to the next generally indicates that Canadians living in poverty have seen their incomes increase and move closer to the poverty line.
Program
Canadian Income Survey - Annually
Source
Statistics Canada. Table 11-10-0136-01 Low income statistics by economic family type.
Note: 2025 data will be available in spring 2027.
Asset resilience
In 2023, 71.4% of Canadians were asset resilient, up from 67.1% in 2019, meaning they had enough savings to cover three months of the low income measure. More information on Asset resilience
More information on asset resilience
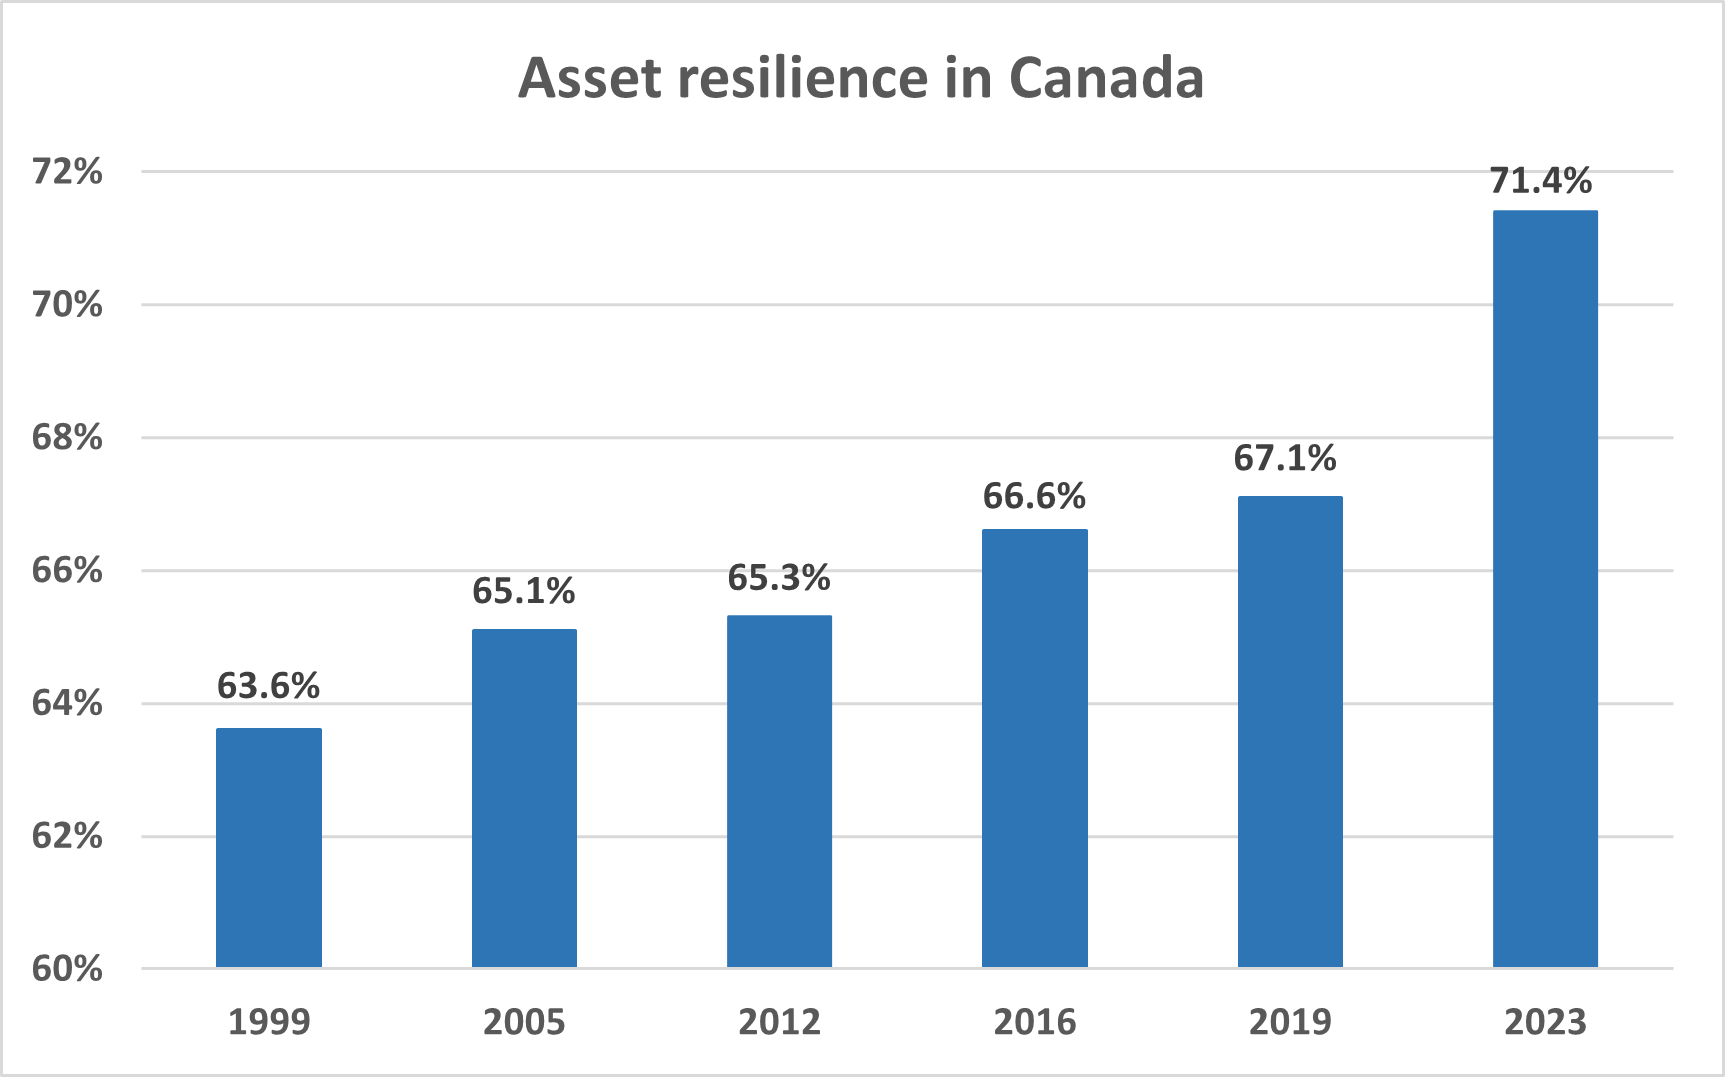
Description - Asset resilience in Canada
- This bar chart shows the change in the asset resilience rate in Canada over time.
- It has a vertical axis showing percentages, from 60% to 72%, by increments of 2 percentage points.
- It has a horizontal axis showing six years: 1999, 2005, 2012, 2016, 2019 and 2023.
- The rate was 63.6% in 1999, 65.1% in 2005, 65.3% in 2012, 66.6% in 2016, 67.1% in 2019 and 71.4% in 2023.
What is it?
This indicator reports on the ability of Canadians to cover unexpected expenses, or reduced income, by drawing from assets (e.g. a bank account) for a period of three months. (Savings of approximately $6,900 for the three months, based on the after-tax low income measure estimate for 2023.)
Why is it important?
The Asset resilience indicator is one of the four inter-related indicators found in the Resilience and Security pillar of Opportunity for All – Canada's First Poverty Reduction Strategy. The indicators in the Resilience and Security pillar are meant to track the progress of initiatives used to support the middle class by protecting Canadians from falling into poverty and by supporting income security and resilience.
Notes
This indicator represents the proportion of people who have enough liquid financial assets to cover at least three months of the after-tax low income measure. Liquid financial assets include bank accounts, term deposits, treasury bills, tax-free savings accounts, stocks and bonds (in mutual funds or not), and registered retirement savings plans.
Liquid financial assets can provide some relief for families faced with a disruption to their primary source of income, so they can continue to meet their essential needs and financial obligations. Therefore, families with lower liquid financial assets may be more vulnerable to a disruption in income than families with higher liquid financial assets.
In March 2021, the methodology used to estimate the asset resilience indicator was updated to include data from 2019. Historical data was also updated to ensure comparability over time. For more information please see: Asset resilience of Canadians, 2019.
Program
Survey of Financial Security – Every three years
Source
Statistics Canada. Table 11-10-0082-01 Percentage of persons who are asset resilient, Canada.
Note: 2025 data will be available in December 2026.
Low income entry and exit rates
Between 2022 and 2023, 4.1% of tax filers (0.98 million), who were not in low income in 2022, entered low income in 2023.
Between 2022 and 2023, 34.9% of tax filers (1.55 million), who were in low income in 2022, left low income in 2023. More information on Low income entry and exit rates
More information on low income entry and exit rates
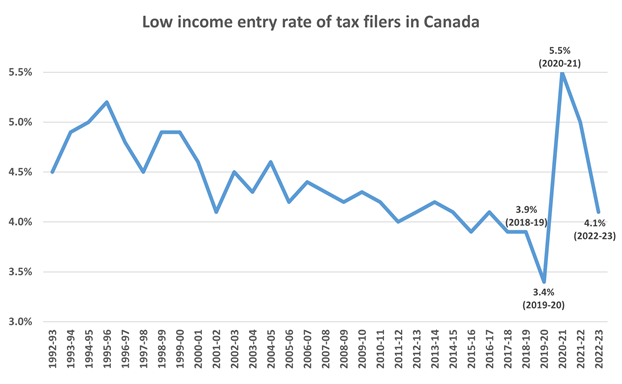
Description - Low income entry rate of tax filers in Canada
- This line chart shows the proportion of tax filers who entered low income over time.
- It has a vertical axis, showing percentages, from 3.0% to 5.5%, by increments of 0.5 percentage points.
- It has a horizontal axis showing time periods, from 1992-1993 to 2022-2023, in one-year increments.
- The line shows that, in 1992-1993, the low income entry rate was 4.5%. It increased to 5.2% in 1995-1996, and then followed a general downward trend until 2019-2020, despite many peaks and troughs. The lowest value was in 2019-2020, at 3.4%, followed by a large increase in 2020-2021 (5.5%). There was a decrease in 2022-2023 to 4.1%.
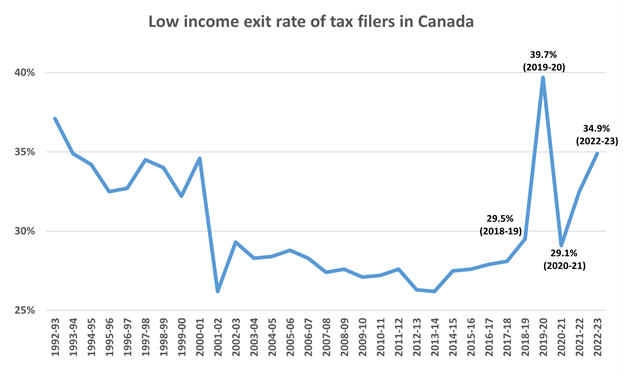
Description - Low income exit rate of tax filers in Canada
- This line chart shows the proportion of tax filers who exited low income over time.
- It has a vertical axis, showing percentages, from 25% to 40%, by increments of 5 percentage points.
- It has a horizontal axis showing time periods, from 1992-1993 to 2022-2023, in one-year increments.
- The line shows that the low income exit rate was 37.1% in 1992-1993. The line fluctuated slightly but trended downwards, until there was a large drop in 2001-2002, when it went from 34.6% to 26.2%. While there are minor peaks and troughs, it remained fairly stable from 2002-2003 until 2018-2019. The 2018-2019 value was 29.5%. It increased sharply to 39.7% in 2019-2020, and then dropped to 29.1% in 2020-2021. It increased to 34.9% in 2022-2023.
What is it?
The low income entry and exit rates describe how Canadian tax filers' low income status changed from one year to another. These rates are estimated for Canadians who filed tax returns for two consecutive years, while those that did not file tax returns for two consecutive years are excluded from the calculations.
The low income entry rate is, out of those who were not in low income in the first year, the proportion who entered low income in the second year.
The low income exit rate is, out of those who were in low income in the first year, the proportion who exited low income in the second year.
Why is it important?
Low income entry and exit rates are one of the four inter-related indicators used to track progress of the resilience of Canadian households. These indicators are meant to track the proportion of non-low income Canadians in one year who fall into low income the following year as well as the proportion of low-income Canadians in one year who exit low income the next year.
Program
Longitudinal Administrative Databank – Annually
Source
Statistics Canada. Table 11-10-0024-01 Low income entry and exit rates of tax filers in Canada.
Note: Low income entry and exit rates are based on the Low Income Measure. The indicator is not currently available using Canada's Official Poverty Line, and it is not available in the territories. Data on low income entry and exit rates for 2023-2024 will be published in spring 2027.
Opportunity for All

In August 2018, the Canadian government released Opportunity for All – Canada's First Poverty Reduction Strategy. Opportunity for All is a whole-of-government strategy that involves actions and investments that span across the federal government.
Sustainable Development Goals and Poverty

Goal 1 - No poverty of the Sustainable Development Goals is to end poverty in all its forms everywhere.
Canadian Income Survey

Canada’s official poverty estimates are produced using income data linked to the Canadian Income Survey (CIS). The CIS is a cross-sectional survey developed to provide a portrait of the income and income sources of Canadians, with their individual and household characteristics. For more information on the CIS, please contact statcan.cisquestions-questionsecr.statcan@statcan.gc.ca.