
Evaluation Report
March 2020
- The report in short
- What is covered
- What we learned
- 1.1 2016 Census of Agriculture dissemination strategy
- 1.2 Design and delivery: Census of Agriculture migration to the Integrated Business Statistics Program
- 1.3 Agriculture Statistics Program projects supporting the modernization initiative
- How to improve the program
- Management response and action plan
- Appendix A: Integrated Business Statistics Program (IBSP)
- Appendix B: List of products released (2016 CEAG)
- Appendix C: Governance and management structures (Census of Agriculture and the Integrated Business Statistics Program)
- Appendix D: Innovation Maturity Survey
Initialisms
- AAFC
- Agriculture and Agri-Food Canada
- ACS
- Assistant Chief Statistician
- AD
- Assistant Director
- Ag-DI
- Agriculture Data Integration
- AG-Zero
- Agriculture-Zero
- ASP
- Agriculture Statistics Program
- ATDP
- Agriculture Taxation Data Program
- BCP
- Business Collection Portal
- CEAG
- Census of Agriculture
- CMP
- Collection Management Portal
- DPMF
- Departmental Project Management Framework
- DPMO
- Departmental Project Management Office
- ESD
- Enterprise Statistics Division
- Field 5
- Economic Statistics
- FIPS-DI
- Farm Income and Prices Section Data Integration
- IBSP
- Integrated Business Statistics Program
- IT
- Information technology
- QIMI
- Quality Indicators and Measures of Impact
- WG
- Working group
The report in short
The Agriculture Statistics Program (ASP) is comprised of an integrated set of components including crop and livestock surveys, farm economic statistics, agri-environmental statistics, tax and other administrative data, research and analysis, remote sensing and the Census of Agriculture (CEAG). The statistical information produced by the CEAG is unique in its ability to provide a comprehensive snapshot of the industry and its people, as well as small area data, both of which are instrumental not only to the agricultural industry, but also for meeting the data requirements of environmental programs, health programs, trade and crisis management. ASP statistical information is used by a wide range of organizations, including different levels of government, not-for-profit and private organizations, academic institutions, and individual Canadians.
This evaluation was conducted by Statistics Canada in accordance with the Treasury Board Secretariat's Policy on Results (2016) and Statistics Canada's Risk-Based Audit and Evaluation Plan (2019/2020 to 2023/2024). The main objective of the evaluation was to provide a neutral, evidence-based assessment of the 2016 CEAG dissemination strategy, and of the design and delivery of the CEAG migration to the Integrated Business Statistics Program (IBSP). The evaluation also assessed projects in the broader ASP, with a focus on projects supporting Statistics Canada's modernization initiative.
The evaluation methodology consisted of a document review, administrative reviews and key informant interviews with Statistics Canada professionals working in the Agriculture Division, and other relevant divisions. Additionally, interviews were conducted with key users and partners external to Statistics Canada. The triangulation of these data collection methods was used to arrive at the overall evaluation findings.
Key findings and recommendations
Census of Agriculture dissemination strategy
CEAG data are used by a wide range of organizations to understand and monitor trends, formulate advice on policies and programs, and address requests from stakeholders. The majority of interviewees were satisfied with the dissemination of the 2016 CEAG and noted it was an improvement over 2011. Data tables were identified as the most used product while other products were relevant but less useful. In terms of timeliness, interviewees were satisfied with the release of the first set of tables (farm operator data - one year after Census Day); however, the timeframe for releasing the remaining two sets of data tables affected their usefulness (2.5 years after Census Day for the last data table release with socioeconomic data). They also noted that there were gaps in cross-analysis with non-agricultural sectors and in emerging sectors. Finally, web tools were not being used because of a lack of guidance on how to use them and how to interpret the data.
The Assistant Chief Statistician (ACS), Economic Statistics (Field 5), should ensure that:
Recommendation 1
For the 2021 CEAG, the Agriculture Division explore ways to improve the timeliness of the last two sets of data tables (historical data, and socio-economic data) and increase cross-analysis with non-agricultural sectors.
Recommendation 2
Web tools include guidance on how to use them and how to interpret data from them. A proactive approach to launching new tools should be taken. Webinars were identified as an effective channel and the use of other channels would allow for even a wider coverage.
Census of Agriculture migration to the Integrated Business Statistics Program
The CEAG migration to the IBSP was proceeding as planned at the time of the evaluation. The transition phase was complete and the integration phase was well underway. Governance structures were in place and deliverables and schedules were being managed effectively. Efforts to resolve issues, such as those related to compatibilities between the Collection Management Portal (CMP) and the IBSP, and the availability of tools and capacity to support data quality assessments, were continuing. The start of the production phase will bring additional risks as new resources become involved and time pressures increase.
The ACS, Field 5, should ensure that:
Recommendation 3
Unresolved issues for the migration to the IBSP, including incompatibilities between the IBSP and the CMP as well as the IBSP processing capacity, are addressed prior to the production phase.
Recommendation 4
Significant risks during the production phase, particularly with regard to data quality assessments and the exercising of roles and responsibilities, are monitored and mitigated.
Projects supporting the modernization initiative
All five projects reviewed were aligned with the modernization pillars and expected results. Most of the projects focussed on increasing the use of data from alternative sources and integrating data. The evaluation found that while governance structures existed and regular monitoring was taking place, project management practices could be strengthened. For example, clearly defined measurable outcomes were often missing, best practices were not being systematically documented, shared or leveraged, and risk management was ad-hoc in some cases. Project management is perceived to be time and resource consuming in an environment focussed on expediency.
The ACS, Field 5, should ensure that:
Recommendation 5
Planning processes for future projects falling outside the scope of the Departmental Project Management FrameworkFootnote 1 include an initial assessment that takes into account elements such as risk, materiality, public visibility and interdependencies. The assessment should then be used to determine the appropriate level of oversight and project management.
Recommendation 6
Processes and tools for documenting and sharing of best practices are implemented and lessons learned from other organizations (internal and external) are leveraged.
What is covered
The evaluation was conducted in accordance with the Treasury Board Secretariat's Policy on Results (2016) and Statistics Canada's Integrated Risk-Based Audit and Evaluation Plan (2019/2020 to 2023/2024). In support of decision making, accountability, and improvement, the main objective of the evaluation was to provide a neutral, evidence-based assessment of the 2016 Census of Agriculture (CEAG) dissemination strategy, and of the design and delivery of the CEAG migration to the Integrated Business Statistics Program (IBSP)Footnote 2. The evaluation also assessed projects in the broader Agriculture Statistics Program (ASP), with a focus on projects supporting Statistics Canada's modernization initiative.
The Agriculture Statistics Program
The mandate of the ASP is to provide economic and social statistics pertaining to the characteristics and performance of the Canadian agriculture sector and its people. It aligns with section 22 of the Statistics Act, which stipulates that Statistics Canada shall "collect, compile, analyse, abstract and publish statistics in relation to all or any of the following matters in Canada: (a) population, (b) agriculture." It also aligns with section 20Footnote 3 of the Statistics Act, which requires Statistics Canada to conduct a CEAG. A CEAG has been conducted nationally and concurrently with the Census of Population since 1951Footnote 4.
According to the ASP Performance Information Profile, the ASP provides data to support and evaluate the fulfillment of requirements or objectives contained in other legislation such as the Farm Products Agencies Act, the Agricultural Products Marketing Act, and the Pest Control Products Act. The ASP also supplies the Canadian System of Macroeconomic Accounts with data required under the Federal-Provincial Fiscal Arrangements Regulations and the International Monetary Fund's Special Data Dissemination Standard.
The ASP includes an integrated set of components that includes crop and livestock surveys, farm economic statistics, agri-environmental statistics, tax and other administrative data, research and analysis, remote sensing and, the CEAG.
The Census of Agriculture
The CEAG collects data on the state of all agricultural operations in CanadaFootnote 5 including: farms, ranches, dairies, greenhouses, and orchards. The information is used to develop a statistical portrait of Canada's farms and agricultural operators. Typically, data are collected on: size of agricultural operation, land tenure, land use, crop area harvested, irrigation, livestock numbers, labour, and other agricultural inputs. Its "whole farm" approach to capturing data directly from agricultural producers provides a comprehensive count of the major commodities of the industry and its people, and a range of information on emerging crops, farm finances, and uses of technologies in agricultural operations.
The objectives of the CEAG are
- to maintain an accurate and complete list of all farms and types of farms for the purpose of ensuring optimal survey sampling - at the lowest cost and response burden - through categorization of farms by type and sizeFootnote 6
- to provide comprehensive agriculture information for detailed geographic areas such as counties - information for which there is no other source and that is critical to formulating and monitoring programs and policies related to the environment, health, and crisis management for all levels of government
- to provide measurement of rare or emerging commodities, which is essential for disease control and trade issues
- to provide critical input for managing federal and provincial government expenditures in the agriculture sector.
The Agriculture Division of the Agriculture, Energy and Environment Statistics Branch is responsible for the ASP. The division has many long-standing strategic partnerships with key stakeholders and data users, including federal departments and agencies, provincial and territorial agriculture ministries, local and regional governments, farmers' associations, the agriculture industry, universities, and researchers. The division has established forums to obtain feedback on emerging issues and needs. These include the Advisory Committee on Agriculture and Agri-Food Statistics and the Federal-Provincial-Territorial Committee on Agriculture Statistics. Internal governance bodies such as the CEAG Steering Committee are also in place to help direct and monitor implementation.
The Evaluation
The scope of the evaluation was established based on meetings and interviews with divisions involved in the ASP. The following areas were identified for review:
| Evaluation issues | Evaluation questions |
|---|---|
| 2016 CEAG dissemination strategy | To what extent did the 2016 CEAG dissemination strategy address the needs of key users in the following areas?
|
| Design and delivery: CEAG migration to the IBSP | To what extent are governance structures for collection and processing (migration to the IBSP) designed to contribute to an effective and efficient delivery of the 2021 CEAG? |
| ASP projectsFootnote 7 supporting the modernization initiative | To what extent are there effective governance, planning and project management practices in place to support modernization projects within the ASP? |
Guided by a utilization-focused evaluation approach, the following quantitative and qualitative collection methods were used:
Administrative reviews
Review of ASP administrative data on activities, outputs and results.
Document review
Review of internal agency strategic documents.
Key informant interviews (external) n=28
Semi-structured interviews with key users from federal departments, provincial and local governments, farm associations, private sector organizations and research institutions.
Key informant interviews (internal) n=14
Semi-structured interviews with individuals working in the Agriculture Division and partner divisions.
Four main limitations were identified, and mitigation strategies were employed:
| Limitations | Mitigation strategies |
|---|---|
| Because of the large number of users and partners using data, the perspectives gathered through external interviews may not be fully representative. | External interviewees were selected using specific criteria to maximize a strategic reach for the interviews. Different types of organizations from a wide range of locations across Canada, and that use CEAG data extensively were selected. Evaluators were able to find consistent overall patterns. |
| Key informant interviews have the possibility of self-reported bias, which occurs when individuals who are reporting on their own activities portray themselves in a more positive light. | By seeking information from a maximized circle of stakeholders involved in the ASP, including the CEAG migration to the IBSP (e.g. the main groups involved, multiple levels within groups), evaluators were able to find consistent overall patterns. |
| Limited documentation was available on the projects sampled for the evaluation. | Key staff working on ASP projects were interviewed and a strategy to gather additional documents during the interview sessions was put in place. Additional interviews were conducted, as needed, to fill the gaps. |
| The scope of the evaluation related to innovation reflected only a select number of topics (i.e., alignment, project management) rather than the full spectrum of factors which may have an impact. | The evaluation methodology was conducted in such a way that other topics related to innovation could be identified and considered. |
What we learned
1.1 2016 Census of Agriculture dissemination strategy
Evaluation question
To what extent did the 2016 CEAG dissemination strategy address the needs of key users in the following areas?
- Timeframe of releases (i.e., for all releases, between each release)
- Coverage and level of detail
- Types and formats of products
- Cross-analysis with non-agricultural sectors
- Access to data
Summary
To inform the 2021 CEAG dissemination strategy the evaluation assessed the extent to which the 2016 dissemination strategy addressed the needs of key users in different areas. The majority of users considered the 2016 CEAG an improvement compared with the 2011 CEAG and were satisfied with the overall approach taken. However, the evaluation found some areas for improvement, particularly with regard to the timeframe of releases, coverage, and guidance on web tools.
Census of Agriculture data are used for multiple purposes with data tables being the product of choice
CEAG data are used by organizations to portray the agriculture sector in their jurisdiction or sector of the economy. For provincial government departments, their portrait allows them to understand trends within their province and to compare them with other jurisdictions. Subprovincial data are also available for analysis of smaller geographic areas. For farm associations, data allow them to monitor trends within their area of interest. Overall, CEAG statistical information is used for identifying and monitoring trends, providing advice on policies and programs, addressing requests or questions from various stakeholders, and informing internal or public communications.
A large majority of external interviewees mentioned that, in general, the 2016 CEAG products and statistical information shed light on the issues that were important for their organization. The evaluation found that the data tables from Statistics Canada's website were the products of greatest utility to users. In particular, the Farm and Farm Operator Data tables were identified as the products most used. This was especially true for organizations that had internal capacities to conduct their own analysis. The analytical products and The Daily releases were identified as being less useful, but still relevant since they provided a different and objective perspective on specific topics. This was true for other products as well (e.g., maps, infographics) - interviewees responded that they used them only occasionally or rarely but still believed they were useful. Finally, a number of provincial users also mentioned that they received a file containing CEAG statistical information, which helped facilitate their ability to conduct their own analyses.
| Products | Extensively | Occasionally | Rarely | Don't know |
|---|---|---|---|---|
| Data tables from the website | 17 | 6 | 1 | 0 |
| The Daily releases | 9 | 5 | 10 | 0 |
| Boundary files | 7 | 6 | 11 | 0 |
| Analytical products | 5 | 12 | 7 | 0 |
| Thematic maps | 4 | 8 | 12 | 0 |
| Infographics | 3 | 9 | 12 | 0 |
| Dynamic web application | 3 | 6 | 14 | 1 |
Besides CEAG statistical information, a majority of users mentioned that they consulted additional sources of information, either from Statistics Canada or other national and international organizations, to fill gaps. This included information on commodity prices, imports and exports of agricultural products, land values, and interest rates. Users consulted international sources to compare data with other countries (e.g., United States and Australia) or to assess global market demand for certain agricultural commodities (e.g., livestock, crops, etc.).
Historical and socioeconomic data tables wanted sooner
Three data table releases took place for the 2016 CEAG: Farm and Farm Operator Data (May 10, 2017 - one year after Census Day); select historical data (December 11, 2017 – approximately one and a half years after Census Day); and a socioeconomic portrait of the farm population (November 27, 2018 – approximately two and a half years after Census Day). It should be noted that the tool used to create the socioeconomic portrait of the farm population was not part of the original scope for the 2016 CEAG but was added later - thus the reason for the relatively late release.
The majority of interviewees believed the time lapse to receive the first set of data tables was satisfactory given the quality of information they received. While they would have welcomed an earlier release, they recognized the level of effort required to produce the information and felt the time lapse was reasonable given the quality of information they received. However, overall, interviewees believed that the time lapse between Census Day and the final data table releases, specifically for the socioeconomic tables, affected the usefulness of the statistical information. In particular, organizations developing policies or programs targeting young farmers, specific population groups, or educational advancements would have benefited from timelier data.
Figure 1: Dissemination schedule (refer to Appendix B for additional details)
May 10, 2016
Launch of the 2016 Cencus of Agriculture and the 2016 Census of Population.
May 10, 2017
The first set of products for the 2016 CEAG - including a Daily release, farm and farm operator data (47 data tables), provincial and territorial trends (11 analytical products) and provincial reference maps (34 maps).
May - June 2017
A series of weekly analytical articles were released covering different topics, including an infographic titled 150 Years of Canadian Agriculture.
September - November 2017
A boundary file and analytical products were released.
December 11, 2017
Select historical data were released.
December 2017 – April 2018
A number of maps along with an analytical article were released.
November 27, 2018
The Agricultural Stats Hub, a dynamic web application, was released as well as a Daily article, 13 data tables and 3 infographics. The application provided a socioeconomic overview of the farm population by linking agricultural and population data.
December 2018 – March 2019
A number of analytical articles were released
July 3, 2019
Last release from the 2016 CEAG
| How satisfied are you with the following? | Satisfied | Somewhat satisfied | Not satisfied | Unsure |
|---|---|---|---|---|
| Time lapse between Census Day and first release | 15 | 5 | 3 | 1 |
| Time lapse between each release | 13 | 5 | 2 | 4 |
| Time lapse between Census Day and release of all data | 6 | 11 | 4 | 3 |
Some interest in preliminary estimates, so long as differences are small
Users were asked about the possibility of releasing preliminary estimates for specific high-level variables. The estimates would differ from the final data released, however no specific examples of variables were provided to interviewees for consideration.
Half of the interviewees were not interested, with a large proportion advising against it. Several explained that the release of preliminary estimates would create confusion within their organizations and they would be required to explain the differences between the preliminary and final data. Most interviewees noted that any policy decision-making and trend analysis would continue to be based solely on final data.
Those who were either "very interested" or "slightly interested" indicated that the difference between the estimates and the final data would need to be small, otherwise they would prefer the status quo.
Some gaps remain
The Agriculture Division has several mechanisms in place to identify information gaps including: regular pre-census cycle consultations, the Federal-Provincial-Territorial Committee on Agriculture Statistics, the Advisory Committee on Agriculture Statistics, and engagement with national farm organizations. Based on these mechanisms, the CEAG builds on the content approved for the previous cycle to better address new and emerging agricultural activities. In addition, projects recently implemented by the Agriculture Division, particularly the Agriculture-Zero project, have filled several gaps (e.g., temporary foreign workers data).
The majority of interviewees were satisfied with the diversity of topics and themes covered. However, a number of information gaps were identified, particularly regarding emerging operations and fast-growing sectors such as organic farming. Additional statistical information and further analysis were also identified related to farm succession, labour (e.g., foreign and contract workers), pesticide use, and new land use categories (e.g., loss of land to urbanization). Additional variables covered over time (i.e., historical data) was also identified as a need. Finally, all interviewees wanted more granular data, although they recognized there are limitations related to confidentiality.
| How satisfied are you with the following? | Satisfied | Somewhat satisfied | Not satisfied | Unsure |
|---|---|---|---|---|
| Types of agricultural operations covered | 15 | 9 | 0 | 0 |
| Number of topics or themes covered in each release | 15 | 5 | 0 | 4 |
| Cross-analysis with other topics and other agricultural surveys | 10 | 7 | 2 | 5 |
Interviewees also wanted additional cross-cutting analysis between the agricultural sector and other sectors. For the 2016 CEAG, analysis with non-agricultural data, such as technology, innovation, and socioeconomic issues was provided to users. This approach was highly regarded by those interviewed - but they wanted more. Evidence suggests that there is a growing appetite for cross-cutting analysis in areas such as technology, farm profitability, demographic shifts, transportation, and the environment.
Increased guidance on tools is needed
Two web tools were released for the 2016 CEAG: boundary files and the Agriculture Stats Hub. The evaluation found relatively low use of these two products when compared with other products such as data tables. Although some interviewees used the boundary files, the majority rarely did. Similarly, few interviewees used the Agriculture Stats Hub. A lack of guidance on how to use the tools and how to interpret the data were noted as key impediments. The lengthy timeframe for releasing socioeconomic data, which included the Agriculture Stats Hub, was also identified as a factor that limited the use of the Hub.
Although the use of existing web tools for the 2016 CEAG was somewhat limited, a majority of interviewees were interested in having additional web-based tools, such as interactive maps, custom table building, and query tools, which would allow for the increased customization of products. As data tables were the product most used, tools attached to the tables would greatly benefit users. However, guidance and support must accompany the tools, and a more active approach to launching the tools would be recommended.
More prominent communication of methodological information would be useful
Although methodological information is generally available, some interviewees noted that it would be useful to have it more prominently displayed in the products that are released, either in The Daily or as footnotes in the data tables. For example, since definitions used by Statistics Canada may differ from definitions used by farmer associations (e.g., how farm operator counts are calculated), information to explain the differences would be helpful.
Users were aware of releases, and data were accessible
The evaluation found a high level of satisfaction with the accessibility of statistical information even though Statistics Canada's website was identified as being a challenge. A high level of satisfaction was also reported for any custom data received. Interviewees were highly satisfied with the time lapse between first contact with Statistics Canada and the delivery of the product, the quality of the product, and the level of detail provided.
In terms of awareness of releases, the majority of interviewees stated that they were informed far enough in advance and were satisfied with the channels used. Most interviewees identified reminder emails as the most effective channel for being kept informed about releases.
| Best way to be informed of releases | Number of Respondents |
|---|---|
| Reminder emails | 20 |
| Calendar invites | 7 |
| Webinars | 5 |
| Social media posts | 3 |
In addition, those who participated in webinars were very satisfied since the webinars provided additional information on the data available and major trends observed. Webinars were identified as opportunities to raise awareness of the products and data that will be available and to facilitate interpretation of the data and the use of the web tools.
1.2 Design and delivery: Census of Agriculture migration to the Integrated Business Statistics Program
Evaluation question
To what extent are governance structures for collection and processing (migration to the IBSP) designed to contribute to an effective and efficient delivery of the 2021 CEAG?
Summary
The evaluation assessed whether the governance structures associated with the CEAG's migration to the IBSP - including roles and responsibilities, interdependencies, and project management practices - will contribute to an effective and efficient delivery of the 2021 CEAG. The evaluation found some areas of risk that could have a negative impact on the delivery of the 2021 CEAG.
Migrating the Census of Agriculture to the Integrated Business Statistics Program is expected to create benefits
At the time of the evaluation, the Agriculture Division had already successfully migrated all of its surveys to the IBSP. The last component to be migrated is the CEAG; migration work began in fiscal year 2018/2019 and is expected to continue until fiscal year 2022/2023. The IBSP migrations are conducted in three phases: transition (defining program-specific requirements), integration (development and testing activities), and production (collection and processing tasks are implemented through the IBSP).
Because of its five-year cycle, the CEAG is considered an ever-migrating component to the IBSP. Similar to the divisional surveys that have already been migrated, it is expected that migration of the CEAG to the IBSP will create specific benefits for the CEAG:
- reduced number of systems for collection, processing and storage through the adoption of common tools and statistical methods
- facilitated integration and harmonization of data with all programs in the IBSP, including agriculture surveys
- increased corporate support for systems, particularly when significant changes occur (e.g., cloud technology)
- a more targeted approach for collection (i.e., follow-up operations) through the IBSP's Quality Indicators and Measures of Impact (QIMI) feature.
Roles and responsibilities are a risk during the production phase
For previous CEAG cycles, the Agriculture Division was responsible for designing, planning, implementing, and managing all required tasks, such as content determination, collection, processingFootnote 8, data quality assessmentFootnote 9, and dissemination. The migration to the IBSP for the 2021 cycle will change the governance of collection and processing tasks (and associated roles and responsibilities) because the Enterprise Statistics Division (ESD) is responsible for managing the IBSP.Footnote 10
The shift of processing responsibilities to ESD affect the CEAG team since it will now act only in an advisory capacity for this task, rather than being fully responsible for it. The same structures for the overall management of the CEAG will remain within the Agriculture Division while the migration to the IBSP brings in governance structures already established within ESD.Footnote 11
The evaluation found that the early part of the transition phase was challenging for the CEAG team as they were not familiar with the implications of migrating the processing activities to a different system run by another division. The CEAG's management team and ESD were key in resolving early challenges in the transition. In particular, both groups showed leadership in explaining potential benefits and impacts of the migration while ensuring that roles and responsibilities were well communicated and understood. Governance structures are also adequate. The leadership demonstrated during the transition phase facilitated the start of the second phase of the project – the integration phase.
The evaluation found that there are concerns regarding roles and responsibilities during the production phase as new individuals, such as subject-matter experts within the Agriculture Division and the IBSP production team within ESD, become involved while others leave the project as the integration phase ends. Based on previous survey migrations to the IBSP, the roles and responsibilities during the production phase are typically less clear than during previous phases. To help with this, a good practice identified during interviews is the involvement of production staff during the integration phase to help build continuity and understanding – this took place when the surveys conducted by the ASP were migrated to the IBSP. With the CEAG, most of the divisional staff participating in the integration phase are also part of the team for the production phase.
ESD's Change Management Committee, which is responsible for the triage of required changes, will be involved during the production phase. Consideration of escalation processes is required when multiple committees (i.e., the CEAG Steering Committee, the IBSP Project Management Team and the Change Management Committee) are involved in the decision-making process, particularly during crunch periods typically observed in the production phase. Although the change management process has been defined and cross-membership within committees and working groups was identified as a mitigating factor, the risk of ineffective and inefficient decision-making because of an increased number of governing bodies remains.
Deliverables and associated schedules are well-managed
The migration of the CEAG to the IBSP is managed by the existing working groups. So far, for the transition and integration phases, effective practices were in place to manage deliverables, associated schedules, and outstanding issues. The transition phase, led by ESD in collaboration with the Agriculture Division, worked as planned. Activities for the integration phase, which were being implemented at the time of the evaluation, were also working as planned. The current IBSP integration schedule is seen as robust and includes the first set of processing activities. The schedule for the production phase is in place and is reviewed and updated regularly. While deliverables, schedules, and outstanding issues are being managed effectively, the differentiation between outstanding issues and risks inherent to the migration, particularly for the production phase, have yet to be clearly articulated.
In addition to the IBSP migration schedules, two other schedules come into play. As collection for the 2021 Census of Population and the 2021 CEAG are conducted in parallel, the Census of Population schedule is a crucial element for the development and implementation of the CEAG's internal schedule. All three schedules have varying levels of flexibility: the Census of Population schedule is inflexible and the CEAG schedule is flexible while the IBSP, given its focus on collection and processing, is considered to be moderately flexible. The Agriculture Division is the main conduit for the alignment of all schedules. Requirements from the Census of Population schedule are assessed on a continuous basis and discussions are held with ESD, as needed, to modify the IBSP schedule and the CEAG schedule. At the time of the evaluation, no major changes to the schedules were required, but it is expected that shifts will occur during the production phase. JIRA, which is the system used for change management (e.g., outstanding issues, schedules, deliverables) by the CEAG, the IBSP, and the Census of Population is seen as an effective tool.
Incompatibilities between the Collection Management Portal and the Integrated Business Statistics Program to be resolved
A unique approach for data collection will be used for the 2021 CEAG - different from the one used for the 2016 CEAG and different from other Statistics Canada surveys that have migrated to the IBSP. For the 2016 CEAG, collection was under the responsibility of the Agriculture Division and took place through the Collection Management Portal (CMP) – a shared collection platform with the Census of Population. The CEAG team was responsible for monitoring collection and the management of follow-up operations. Because of synchronicity with the Census of Population, the CMP will continue to be used for CEAG collection in 2021.
Surveys under the IBSP (which are business-focused in nature) are typically collected through a different platform, the Business Collection Portal. New and unique linkages between the CMP and the IBSP need to be designed, tested, and operationalized for the 2021 CEAG collection operations. Links were still under development at the time of the evaluation. Although some functionalities are now operational, there is still development work to be done. For example, paradata from the CMP (e.g., information related to the collection process, such as attempts to contact someone, comments provided to an interviewer, completion rate) were not compatible with the IBSP at the time of the evaluation. Although work is being done to resolve the issue, the incompatibility of CMP paradata would disable the IBSP's QIMI feature, which allows for a targeted process for follow-up operations (i.e., prioritizing follow-up operations to target units that have the most effect on the data). QIMI is an effective tool used to support data quality, the 2021 CEAG data quality assessment strategy would need to be adapted should it not be available. There is a risk that some of the relationships between the CMP and the IBSP will not be fully developed or tested in time for the production phase.
Integrated Business Statistics Program processing capacity and available tools will affect data quality assessment activities
Data quality assessment activities will remain under the responsibility of the Agriculture Division. While the IBSP is designed for data collection and processing, it also includes features supporting data quality assessments, such as QIMI, rolling estimates, inclusion of non-response variances, and values attributed by imputation. However, given the volume of data with the CEAG, some validation processes will not be usable, and alternative tools outside the IBSP will need to be developed and tested. The use of alternative tools will require a reconfiguration of the data quality assessment strategy.
Although the generation of rolling estimates is seen as an important step to ensuring data quality, concerns were raised about the IBSP's processing capacity. In previous cycles, the CEAG team was able to impute, run, and analyze data at a higher rate than is currently possible under the IBSP. As data change from the generation of a rolling estimate and its completion, there is a concern that subject-matter experts will be validating outdated data. Although the IBSP's processing capacity has improved since the start of the CEAG migration and further improvements are expected, concerns remain.
Lessons learned from past migrations to the IBSP suggest that the level of effort required for data quality assessments is either similar to or greater than what is typical. A number of large surveys that have migrated to the IBSP in the past have encountered delays during the production phase because of challenges associated with the data quality assessment task.Footnote 12 At the time of the evaluation, the data quality assessment strategy was being developed.
Migration will benefit from an extended timeframe and experience
Migration activities started in fiscal year 2018/2019 and will continue until 2022/2023. Testing activities will also continue, as needed, during collection. The extended timeframe available for testing (because of the CEAG's five-year cycle) will allow for additional testing activitiesFootnote 13 (i.e., with simulated data, actual data from the 2016 CEAG, and data from content tests conducted in 2019). However, the production phase will be implemented with real 2021 data, with no options available for parallel testing.
Finally, since approximately 30 surveys from the Agriculture Division have already migrated to the IBSP, expertise has been built within the division and ESD. Knowledge gained from previous experience will contribute to the successful migration of the CEAG.
Additional pressures may affect the migration
A risk that could affect the CEAG's migration to the IBSP is the move to cloud technology. Although there are no specific scheduled implementation dates for Statistics Canada programs, any move of IBSP components to the cloud technology during the production phase, where most testing will have been completed, would affect the migration. At the time of the evaluation, this topic was still under discussion.
Another element that is noted for every CEAG cycle is the timeliness of content approval. Any changes to content will affect various elements, including the questionnaire and systems.
1.3 Agriculture Statistics Program projects supporting the modernization initiative
Evaluation question
To what extent are there effective governance, planning and project management practices in place to support modernization projects within the ASP?
Summary
The evaluation reviewed a sample of ongoing and completed projects undertaken within the ASP to examine their relationship to Statistics Canada's modernization pillars and expected resultsFootnote 14, and to identify areas for improvement regarding governance, planning and project managementFootnote 15 practices. The evaluation found that the projects were aligned with the modernization initiative and that governance is in place, but project management practices could be improved.Footnote 16
Projects are aligned with the modernization pillars and expected results
Statistics Canada's modernization initiative supports a vision for a data-driven society and economy. The modernization of Statistics Canada's workplace culture and its approach to collecting and producing statistics will result in "greater and faster access to needed statistical products for Canadians."Footnote 17 Five modernization pillars along with expected results have been articulated to guide the modernization initiative (Figure 2).
Figure 2: Statistics Canada modernization initiative

Description for Figure 2: Statistics Canada modernization initiative
The Vision: A Data-driven Society and Economy
Modernizing Statistics Canada's workplace culture and its approach to collecting and producing statistics will result in greater and faster access to needed statistical products for Canadians. Specifically, the initiative and its projects will:
- Ensure more timely and responsive statistics – Ensuring Canadians have the data they need when they need it!
- Provide leadership in stewardship of the Government of Canada's data asset: Improve and increase alignment and collaboration with counterparts at all levels of government as well as private sector and regulatory bodies to create a whole of government, integrated approach to collection, sharing, analysis and use of data
- Raise the awareness of Statistics Canada's data and provide seamless access
- Develop and release more granular statistics to ensure Canadians have the detailed information they need to make the best possible decisions.
The Pillars:
User-Centric Delivery Service:
- Users have the information/data they need, when they need it, in the way they want to access it, with the tools and knowledge to make full use of it.
- User-centric focus is embedded in Statistics Canada’s culture.
Leading-edge Methods and Data Integration:
- Access to new or untapped data modify the role of surveys.
- Greater reliance on modelling and integration capacity through R&D environment.
Statistical Capacity Building and Leadership:
- Whole of government, integrated approach to collection, sharing, analysis and use of data.
- Statistics Canada is the leader identifying, building and fostering savvy information and critical analysis skills beyond our own perimeters.
Sharing and Collaboration:
- Program and services are delivered taking a coordinated approach with partners and stakeholders.
- Partnerships allow for open sharing of data, expertise and best practices.
- Barriers to accessing data are removed.
Modern Workforce and Flexible Workplace:
- Organization is agile, flexible and responsive to client needs.
- Have the talent and environment required to fulfill our current business needs and be open and nimble to continue to position ourselves for the future.
Expected Outcome
Modern and Flexible Operations: Reduced costs to industry, streamlined internal processes and improved efficiency/support of existing and new activities.
Most of the projects examined focus on increasing the use of administrative data and integrating data into centralized systems. The evaluation selected a sample of projects through an objective methodology using the following criteria: level of priority for the ASP, budget, expected impact (e.g., data users, respondents, data quality, and costs) and the perceived contribution to modernization. Additional criteria, such as length, start date, and project stage were also considered. Based on this methodology, five projects were selected:
- The Agriculture-Zero (Ag-Zero) project is a 7-year project which received funding commencing fiscal year 2019/2020. It is designed to reduce response burden by replacing survey data with data from other sources. The purpose of AG-Zero is to undertake multiple pilot projects involving the acquisition and the extensive use of satellite imagery, scanner and other administrative data, and models to serve as inputs to the ASP in place of direct data collection from farmers. The project aims to reduce response burden on farmers to as close to zero as possible by 2026, while maintaining the amount and quality of information available.
The project adopts a "collect once, use multiple times" approach. Administrative data will be used to directly replace survey data, to model estimates that are currently generated using survey data, and to produce value-added statistical products for stakeholders. Under the umbrella of Ag-Zero, a series of subprojects are planned to be implemented over the seven year periodFootnote 18; at the time of the evaluation, three had been initiated. The following two were selected for review:
- Pig Traceability uses administrative data to model estimates of pig inventories and has the potential to replace biannual survey estimates with near real-time estimates. The source data are pig trace data collected under the Health of Animals Act.
- In-season Weekly Yield Estimates uses a combination of satellite imagery, administrative data from crop insurance corporations, and modelling to create in-season estimates of crop yields and area.
- The Agriculture Taxation Data Program (ATDP) is being redesigned to move from a survey-based to a census-based activity that uses tax records to estimate a range of financial variables including revenues, expenses, and income. The ATDP's redesign to a census-based activity will support replacement of financial data in the CEAG.
- The Agriculture Data Integration (Ag-DI) project will integrate agriculture commodity surveys that require processing outside the IBSP into the existing Farm Income and Prices Section Data Integration (FIPS-DI) system. The system will combine data from over 100 sources to produce aggregate integrated data for the System of National Accounts. The project will involve the integration of a multitude of spreadsheets and other systems into one common divisional tool. The project will also update the formulas in FIPS-DI to accept the naming convention used by the IBSP or other data sources loaded directly to FIPS-DI. It is expected that cross-analysis between data-sets will be facilitated, particularly when the CEAG will be migrated to the IBSP.
| Project | Timeframe | Alignment with modernization pillars |
|---|---|---|
| Ag-Zero Budget - $ 2.8M |
Start: 2019/2020 Length: 7 years Stage: Planning |
Leading-edge methods & data integration: This project involves the use of new sources of data and new methods for collecting data. Extensive use of modelling, machine learning, and data integration are also featured. Sharing and collaboration: A key element of this project involves the establishment and maintenance of mutually beneficial partnerships with other federal departments and industry associations. User-centric service delivery: This project is expected to yield improvements in data quality and timeliness of data releases, as well as offer opportunities for new products. |
| Pig Traceability (AG-Zero sub-project) | Start: 2018/2019 Length: 1 to 3 years Stage: Execution |
|
| In-Season Weekly Yield Estimates(AG-Zero sub-project) | Start: 2019/2020 Length: 1 to 3 years Stage: Initiation |
|
| Redesign of the ATDP Budget - $ 1M (approx.)Footnote 19 |
Start: 2015/2016 Length: 3 to 5 years Stage: Close-out |
User-centric service delivery: Consultations were held with Agriculture and Agri-Food Canada (AAFC) on priorities for the project. AAFC is the primary client and sponsor of the project. Leading-edge methods and data integration: This project relied heavily on modelling and the integration of agriculture data (CEAG) and tax data. |
| Ag-DI Budget - $ 696K (approx.) |
Start: 2015/2016 Length: 3 to 5 years Stage: Execution |
Leading-edge methods and data integration: This project features data integration from an operational point of view. The integration will affect efficiency, data quality, and coherence of the data. It will also enable further cross-analysis opportunities. |
Governance is in place
Overall, the evaluation found that governance structures are in place to support the projects. Similarly, schedules are developed and regular meetings take place to monitor progress, budgets and outstanding issues.
The projects employ different governance structures. AG-Zero is monitored under the Departmental Project Management Framework (DPMF)Footnote 20 and started on April 1, 2019. The first three years of the project are funded by a modernization investment submission while the final four years will be self-funded with savings realized through the first set of subprojects. Some of the subprojects under the AG-Zero umbrella have additional dedicated funding.
For AG-Zero, as required under the DPMF guidelines, detailed project planning documentation is in place including a project charter, Project Complexity and Risk Assessment, and an IT Development Plan. Monthly dashboards are provided to the Departmental Project Management Office (DPMO), reporting on various aspects including timelines, deliverables, expenditures, and risks. Within the division, a governance structure exists that includes working groups, divisional management, and the CEAG Steering Committee. AG-Zero subprojects are managed through the same governance structure. They are discussed within the division, and updates on elements such as deliverables, risks, and schedules are rolled-up into the AG-Zero monthly dashboard, as needed.
The Ag-DI project is also a DPMF project. It is small in scope with one resource working fulltime and no non-salary investment. Oversight and reporting are via the standard governance structure for the Agriculture Division and the DPMF.
Project management for the ATDP takes place via the regular divisional governance structure; it is not a DPMF project. Evidence indicates that project management has improved over time (e.g., budget planning, schedules, assumptions, governance, roles and responsibilities) and that at the time of the evaluation, adequate governance was in place and the project was on track to meet its overall objectives.
Risk assessments are conducted on an ad hoc basis
Risks for AG-Zero as a whole were identified at the outset of the project and are monitored every month as per DPMF requirements. Risks at the subproject level are meant to be rolled-up to inform risk management at the AG-Zero project level. While project-specific risks are identified and entered into JIRA during regular team lead meetings, there is little evidence that initial risk assessments were conducted for the subprojects. As AG-Zero is the sum of its subprojects, informal risk management at the sub-project level limits the effectiveness of risk management.
For example, the interruption of reliable access to administrative data (short-term or long-term) has been identified as a risk for the AG-Zero project overall. The division has developed mitigation and contingency options, including the feasibility or practicality of remaining "survey ready" in the case that this risk materializes. Because the risk has not been fully assessed at the subproject level, the management of this risk is limited. Similarly, risk management for other non-DPMF activities is taking place on an ad hoc informal basis.
Quantifiable objectives and targets are missing
The projects examined have the potential to advance innovation in important areas such as data collection, processing, analysis, and dissemination. The evaluation found that clearly defined, quantifiable expected outcomes have not been articulated in most cases. There is a general understanding of what types of positive effects these projects "might" generate, but there are few specific objectives that quantify the expected level of improvement in areas such as data quality, cost efficiency, response burden, timeliness, or relevance.
For example, while it is generally assumed that the integration of data from alternative sources will eventually lead to savings in data collection costs, there are no documented expectations for what the level of savings will be and when they will be realized. This is especially true for the subprojects under the AG-Zero umbrella. The AG-Zero project, which has a hybrid funding scheme (i.e., approved funding during the first three years, and self-funding for the remaining four years), does not have a clear plan to identify and measure returns on investment.Footnote 21
Finally, the measurement of returns on investment should be thorough and comprehensive. For example, as data from alternative sources are acquired from external sources in exchange for some type of service (such as data cleaning or preparation), the associated cost of the service must be considered. Non-payment for the administrative data does not mean they are free; there is still a cost for the "quid pro quo" service that must be accounted for. Similarly, associated costs for remaining "survey ready" while using administrative data (i.e., the mitigation strategy implemented for the risk associated with the accessibility of administrative data) should be accounted for.
The establishment of overall performance indicators for projects and for key milestones during the timeline of the project is critical for monitoring the progress of the work and, ultimately, for measuring the return to the agency for the initiative. The return can be in the form of data quality improvements, cost reduction, reduction of response burden, improvements to data access and availability, or any other improvement realized by the agency.
Best practices could be better leveraged
The evaluation found little evidence that best practices and lessons learned from the projects are being shared (or were planned to be shared) outside of the division; nor did it appear that the projects took advantage of experiences acquired by other divisions.Footnote 22 Lessons learned and best practices were not being documented. Instead, they were being deferred until there was "more time."
While minimal effort was made in this regard, staff recognized the importance of sharing and benefiting from others and that sharing and using best practices could be improved. Staff were also aware of channels for this purpose, such as the Innovation Radar and the Economic Statistics Forum. In November 2019, the division provided an overview of the Geospatial Statistics Framework (a system built to view and analyze geospatial data) at the Economics Statistics Forum.
When asked about ways to enhance information sharing, a number of suggestions were provided: encourage the use of existing corporate mechanisms such as the Innovation Radar; develop a user-friendly open corporate platform where more detailed information about initiatives organized by themes, including contact information, could be housed; involve partner areas such as the Finance, Planning and Procurement Branch, the Informatics Branch, and the Modern Statistical Methods and Data Science Branch (which support different projects for sound statistical approaches) at the outset of a new initiative since these groups have a corporate perspective of innovative projects.
Focus is on expediency
The level of project management typically reflects several factors including risk, materiality and interdependencies. The evidence suggests that timeliness for delivering results is given the highest priority for the projects and that project management is viewed as being a time consuming onerous task that slows things down. As such, minimal effort is placed on activities such as conducting formal risk assessments, identifying quantifiable goals, undertaking cost-benefit analyses, and sharing best practices (as well as learning from experiences of other divisions). An appropriate balance is missing.
How to improve the program
2016 Census of Agriculture dissemination strategy
The Assistant Chief Statistician (ACS), Economic Statistics (Field 5), should ensure that:
Recommendation 1:
For the 2021 CEAG, the Agriculture Division explore ways to improve the timeliness of the last two sets of data tables (historical data, and socio-economic data) and increase cross-analysis with non-agricultural sectors.
Recommendation 2:
Web tools include guidance on how to use them and how to interpret data from them. A proactive approach to launching new tools should be taken. Webinars were identified as an effective channel and the use of other channels would allow for even a wider coverage.
Design and delivery: Census of Agriculture migration to the Integrated Business Statistics Program
The ACS, Field 5, should ensure that:
Recommendation 3:
Unresolved issues for the migration to the IBSP, including incompatibilities between the IBSP and the CMP as well as the IBSP processing capacity, are addressed prior to the production phase.
Recommendation 4:
Significant risks during the production phase, particularly with regard to data quality assessments and the exercising of roles and responsibilities, are monitored and mitigated.
Agriculture Statistics Program projects supporting the modernization initiative
The ACS, Field 5, should ensure that:
Recommendation 5:
Planning processes for future projects falling outside the scope of the Departmental Project Management Framework include an initial assessment that takes into account elements such as risk, materiality, public visibility and interdependencies. The assessment should then be used to determine the appropriate level of oversight and project management.
Recommendation 6:
Processes and tools for documenting and sharing of best practices are implemented and lessons learned from other organizations (internal and external) are leveraged.
Management response and action plan
Recommendation 1:
For the 2021 CEAG, the Agriculture Division explore ways to improve the timeliness of the last two sets of data tables (historical data, and socio-economic data) and increase cross-analysis with non-agricultural sectors.
Management response
Management agrees with the recommendation.
For the 2016 Census of Agriculture, no funding was provided for the creation and release of the socioeconomic portrait of the farm population; as such, it was not part of the original scope for the 2016 dissemination plan but was added later. The tool used to create the socio-economic dataset from the 2016 CEAG (dealing specifically with the linkage between the Censuses of Agriculture and Population) is specifically in-scope as a deliverable for the 2021 Census of Agriculture.
The 2021 CEAG dissemination strategy and release schedule will be presented to the CEAG steering committee for review and approval. Related processes for the release of selected historical farm and farm operator data will also be reviewed and the timeline for releases will be adjusted based on feedback from the Federal Provincial Territorial partners (key users of the data).
Agriculture Division has already taken steps to increase cross-sectoral analysis with non-agricultural sectors, including the infographics on:
- Which came first: The chicken or the egg? Poultry and eggs in Canada
- Thanksgiving: Around the Harvest Table.
The CEAG will continue to build on this initiative by developing cross-sectoral infographics, analytical studies, Daily releases and interactive data visualization for the 2021 CEAG data release.
Deliverables and timelines
The Assistant Chief Statistician, Economic Statistics (Field 5) will ensure the delivery of
- The approved Dissemination strategy (December 2020)
- A proposal for cross-analysis such as Infographics, analytical studies, and Daily releases integrating CEAG data with data from other sectors (March 2021)
- A proposal for new interactive visualization tools within the Agriculture Stats Hub (March 2021).
Recommendation 2:
Web tools include guidance on how to use them and how to interpret data from them. A proactive approach to launching new tools should be taken. Webinars were identified as an effective channel and the use of other channels would allow for even a wider coverage.
Management response
Management agrees with the recommendation.
YouTube tutorial videos on how to use Statistics Canada geographic boundary files using open source GIS software (QGIS) have been produced and added to the Agriculture and Food portal.
The CEAG will create "How to" instructions and demos on how to use the interactive visualization web tools. The "How to" instructions will be available within each tool and the demos will be presented to data users in a series of webinars planned for the 2021 CEAG releases.
Deliverables and timelines
The Assistant Chief Statistician, Economic Statistics (Field 5) will ensure the delivery of
- A proposal for new interactive visualization tools within the Agriculture Stats Hub, with integral "How to use" instructions and webinar demos (March 2021).
Recommendation 3:
Unresolved issues for the migration to the IBSP, including incompatibilities between the IBSP and the CMP as well as the IBSP processing capacity, are addressed prior to the production phase.
Management response
Management agrees with the recommendation.
The CEAG will continue to work with partners to identify relevant and emerging issues related to the migration to the IBSP during the integrated testing commencing June 2020. Issues will be captured in JIRA and major risks entered in the CEAG risk register. Consolidated risks and issues will be tracked and actioned in project plan documentation.
The integrated testing will take place over several months. All relevant and emerging issues must be resolved by December 2020 to ensure the readiness of production activities.
Issues and risks to be monitored through the CEAG Steering Committee.
Deliverables and timelines
The Assistant Chief Statistician, Economic Statistics (Field 5) will ensure that relevant and emerging IBSP issues and risks are tracked consistent with the DPMF (December 2020).
Recommendation 4:
Significant risks during the production phase, particularly with regard to data quality assessments and the exercising of roles and responsibilities, are monitored and mitigated.
Management response
Management agrees with the recommendation.
A table top exercise will be conducted to identify potential gaps in the processes in place (including risk management) for the production phase. Information gathered during the exercise will be used to inform plans and develop potential contingencies. Results will be presented to the CEAG Steering Committee.
The CEAG will engage the IBSP and all its stakeholders ("SWAT" team) in convening meetings to communicate relevant and emerging issues and risks during the production phase and to find resolutions. Roles and responsibilities will be formally documented and presented at the CEAG Steering committee.
The SWAT team will be ready for the production phase.
Deliverables and timelines
The Assistant Chief Statistician, Economic Statistics (Field 5) will ensure the delivery of
- The results from table top exercise (December 2020)
- The CEAG "SWAT" team with documented roles and responsibilities (March 2021).
Recommendation 5:
Planning processes for future projects falling outside the scope of the Departmental Project Management Framework include an initial assessment that takes into account elements such as risk, materiality, public visibility and interdependencies. The assessment should then be used to determine the appropriate level of oversight and project management.
Management response
Management agrees with the recommendation.
A new process will be implemented (for both subprojects under AG-Zero and non-DPMF projects) that will require the development of a project plan prior to the launching of a new project. The plan will include among other things: an initial assessment of the issues and risks (and mitigation strategies); a description of the methodology and assumptions; the identification of interdependencies and expected outcomes; and communication plans. The monitoring of projects will take place through existing governance mechanisms. Finally, existing projects already underway will be subject retroactively to the new process.
Where relevant, the plans will be used to update the DPMF project issues and risks register and the DPMF Project Plan.
Deliverables and timelines
The Assistant Chief Statistician, Economic Statistics (Field 5) will ensure the delivery of a new project plan process (June 2020).
Recommendation 6:
Processes and tools for documenting and sharing of best practices are implemented and lessons learned from other organizations (internal and external) are leveraged.
Management response
Management agrees with the recommendation.
The Agriculture Division has already shared lessons learned and best practices through various mechanisms including:
- a presentation at AAFC on producing crop yield estimates using earth observation and administrative data on March 14, 2019
- a presentation at the Economic Statistics Forum on November 12th, 2019
- a presentation at AAFC on February 7th, 2020, on Predicting the Number of Employees using Tax Data.
As part of the new project plan process outlined previously, the Agriculture Division will leverage lessons learned from other organizations where applicable. In addition, as part of ongoing monitoring, lessons learned and best practices from projects will be documented.
Deliverables and timelines
The Assistant Chief Statistician, Economic Statistics (Field 5) will ensure the delivery of:
- A systematic approach to share and document lessons learned (December 2020)
- A presentation(s) at conferences such as the Economic Statistics Forum (March 2021)
- An article(s) in @StatCan or the Modernization bulletin (March 2021)
- A presentation(s) at AAFC (March 2021).
Appendix A: Integrated Business Statistics Program (IBSP)
The IBSP provides a standardized framework for surveys with common methodologies for collection and processing. Through standardization and use of corporate services and generalized systems, the program optimizes the processes involved in the production of statistical outputs; improves governance across all areas involved in statistical data output, particularly for change management; and modernizes the data processing infrastructure. This is achieved by balancing the development of a coherent standardized model with the maintenance of flexible program-specific requirements. It is expected that the IBSP surveys will use:
- the Business Register (BR) as a common frame;
- harmonized concepts and content for questionnaires;
- electronic data collection as the principal mode of collection;
- shared common sampling, collection and processing methodologies;
- common tools for data editing and analysis; and
- the tax data universe for estimating financial information.
Appendix B: List of products released (2016 CEAG)
| Date of release | Title of product (including link) | Type of product | Timeliness | |
|---|---|---|---|---|
| Time lapse between collection and release: Days (years) |
Time lapse since previous release: Days | |||
| May 10, 2017 | The Daily: 2016 Census of Agriculture | Statistics Canada's official release bulletin | 365 (1 year) |
N/A |
| Farm and Farm Operator Data (CANSIM tables 004-0200 to 004-0246) | Data table | |||
| Provincial and territorial trends (NL; PE; NS; NB; QC; ON; MB; SK; AB; BC; YT/NT) | Analytical product | |||
| Reference maps: Provinces | Map | |||
| May 17, 2017 | A portrait of a 21st century agricultural operation | Analytical product | 367 | 2 |
| May 24, 2017 | Production efficiency and prices drive trends in livestock | Analytical product | 374 | 7 |
| May 31, 2017 | Seeding decisions harvest opportunities for Canadian farm operators | Analytical product | 381 | 7 |
| June 7, 2017 | Leveraging technology and market opportunities in a diverse horticulture industry | Analytical product | 388 | 7 |
| June 14, 2017 | Farmers are adapting to evolving markets | Analytical product | 395 | 7 |
| June 21, 2017 | Growing opportunity through innovation in agriculture | Analytical product | 402 | 7 |
| June 27, 2017 | 150 Years of Canadian Agriculture | Infographic | 408 | 6 |
| September 13, 2017 | Agricultural Ecumene Boundary File | Boundary file | 486 | 78 |
| November 20, 2017 | Canadian Agriculture at a Glance: Other livestock and poultry in Canada | Analytical product | 554 (~1.5 years) |
68 |
| December 6, 2017 | Canadian Agriculture at a Glance: Dairy goats in Ontario: a growing industry | Analytical product | 570 | 16 |
| December 11, 2017 | Selected Historical Data from the Census of Agriculture (CANSIM Tables 004-0001 to 004-0017) | Data table | 575 | 5 |
| December 13, 2017 | Agricultural operation characteristics | Map | 577 | 2 |
| January 25, 2018 | Land use, land tenure and management practices | Map | 620 | 43 |
| February 22, 2018 | Crops - Hay and field crops | Map | 648 | 28 |
| March 22, 2018 | Canadian Agriculture at a Glance: Innovation and healthy living propel growth in certain other crops | Analytical product | 676 | 28 |
| April 5, 2018 | Crops - Vegetables (excluding greenhouse vegetables), fruits, berries and nuts, greenhouse products and other crops | Map | 690 | 14 |
| April 26, 2018 | Livestock, poultry, bees and characteristics of farm operators | Map | 711 (~2 years) |
21 |
| November 27, 2018 | The Daily: The socioeconomic portrait of Canada's evolving farm population, 2016 | Statistics Canada's official release bulletin | 926 (~2.5 years) |
215 |
| Agriculture-Population Linkage Data (The socioeconomic portrait of Canada's evolving farm population, 2016) (13 Data Tables) | Data table | |||
| Socioeconomic overview of the farm population - The Agriculture Stats Hub | Dynamic web application (Agriculture-Population Data Linkage) | |||
| Canadian farm operators: An educational portrait | Infographic | |||
| The socioeconomic portrait of Canada's evolving farm population | Infographic | |||
| Canada's immigrant farm population | Infographic | |||
| December 13, 2018 | Canadian Agriculture at a Glance: Female and young farm operators represent a new era of Canadian farmers | Analytical product | 942 | 16 |
| January 17, 2019 | Canadian Agriculture at a Glance: Aboriginal peoples and agriculture in 2016: A portrait | Analytical product | 977 | 35 |
| March 21, 2019 | Canadian Agriculture at a Glance: The educational advancement of Canadian farm operators | Analytical product | 1040 (~3 years) |
63 |
| July 3, 2019 | Canadian Agriculture at a Glance: The changing face of the immigrant farm operator | Analytical product | 1144 (~3 years) |
104 |
Appendix C: Governance and management structures (Census of Agriculture and the Integrated Business Statistics Program)
Overall management of the Census of Agriculture:
- CEAG Working Group (WG) for overall management of the CEAG (monthly meetings): chaired by the Assistant Director (AD) and Chief, and includes Chiefs from other relevant areas (e.g., methodology, IT and unit heads)
- CEAG Management Team for day-to-day management of the CEAG (weekly meetings): includes the same members as the CEAG WG, but is also extended to other staff involved
- CEAG Steering Committee:Footnote 23 an overarching advisory and decision-making function (monthly meetings)
- Other WGs and committees for various functions (e.g., Census of Population/CEAG WG, Collection WG, Advisory Committee on Agriculture and Agri-Food Statistics, Federal-Provincial-Territorial Committee on Agriculture Statistics.)
Governance structures already established within the Enterprise Statistics Division (ESD) for the IBSP:
- IBSP Transition/Integration/Production WGs: chaired by ESD, and includes the CEAG and all other partners such as the Operations and Integration Division (OID), the Collection Planning and Research Division (CPRD), as well as methodology and IT (bi-weekly meetings), to support the transition, integration, and production phases;
- IBSP Project Management Team:Footnote 24 an overarching advisory and decision-making function that includes directors general, directors and ADs involved in the IBSP migrations
- Change Management Committee: involved only during the production phase, it will be responsible for overseeing change management during production (e.g., if the schedule needs to be changed, the Committee will triage the request to the different stakeholders involved.)
Appendix D: Innovation Maturity Survey
In 2018, Statistics Canada conducted a survey to measure the innovation maturity level of the agency across 6 attributes:Footnote 25
- Client expectations - incorporating the expectations and needs of clients in the design and development of innovative services and policies
- Strategic alignment - articulating clear innovation strategies that are aligned with the organization's priorities and mandate
- Internal activities - building the right capabilities aligned with the innovation strategies
- External activities - collaborating across the whole of government and with external partners to co-innovate policies, services and programs
- Organization - fostering the right organizational elements to drive innovation performance at optimal cost
- Culture - aligning the innovation goals, cultural attributes, and behaviours with the innovation strategies
The Agriculture Division had maturity levels higher than those for all of Statistics Canada and compared with the Economic Statistics Field as a whole.
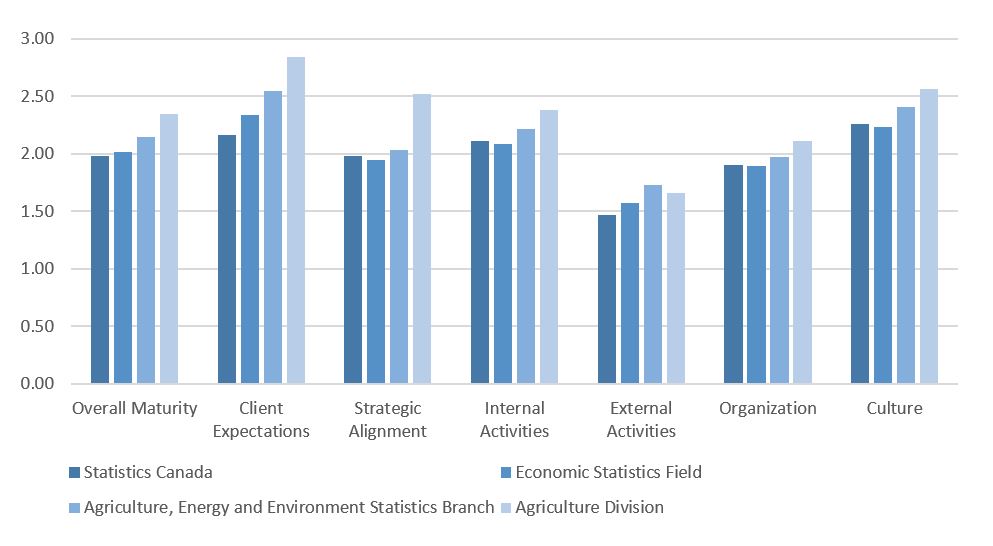
Description for Figure 3 - Results from the Innovation Maturity Survey (5 point scale)
The figure depicts the results of Statistics Canada Innovation Maturity Survey level for 4 different groups (Statistics Canada; Economic Statistics Field; Agriculture, Energy and Environment Statistics Branch; and, Agriculture Division. Six different attributes were used: Client expectations; Strategic alignment; Internal activities; External activities; Organization; and, Culture. Overall maturity was also assessed.
| Attribute | Statistics Canada | Economic Statistics Field | Agriculture, Energy and Environment Statistics Branch | Agriculture Division |
|---|---|---|---|---|
| Overall maturity | 1.98 | 2.01 | 2.15 | 2.35 |
| Client Expectations | 2.16 | 2.34 | 2.55 | 2.84 |
| Strategic Alignment | 1.98 | 1.95 | 2.03 | 2.52 |
| Internal activities | 2.11 | 2.08 | 2.22 | 2.38 |
| External activities | 1.47 | 1.57 | 1.73 | 1.66 |
| Organization | 1.90 | 1.90 | 1.97 | 2.11 |
| Culture | 2.26 | 2.24 | 2.40 | 2.56 |