
Data in real time

May 29, 2015...$983,636 million...$989,552 million...$999,580 million...$1,000,000 million
In the statistics business, these are known as real-time data.
Often when data are first released for a given reference period, they are based on a preliminary set of information. Then, as new more comprehensive information becomes available, the data for that reference period date are adjusted accordingly.
While most Canadians won't lose sleep worrying whether the GDP from three months or a year ago went up or down a smidgen in the latest StatCan revision, for some data users, even a little revision can mean a lot.
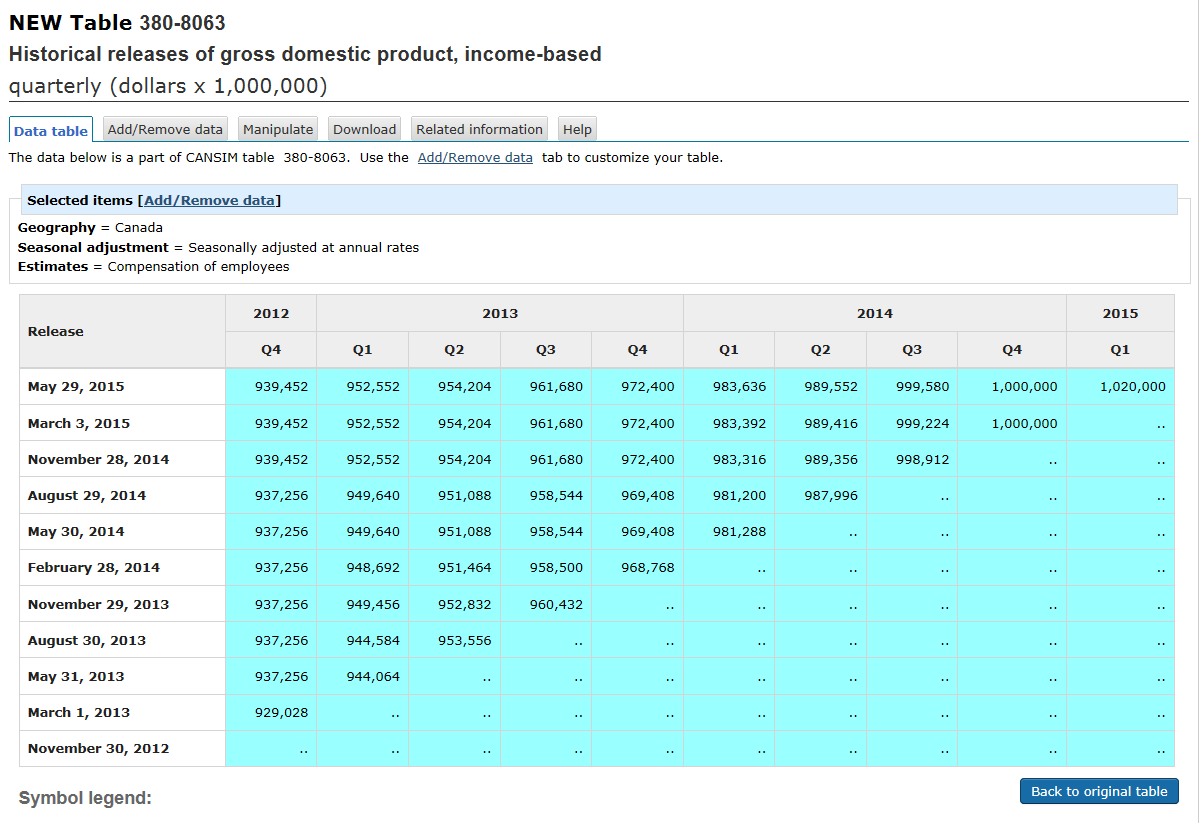
Description for Figure 1
This is a real-time CANSIM table which shows all revisions of a specific data point over time. On the horizontal axis, the columns indicate calendar years. Each year is subdivided into quarters. The rows of the vertical axis indicate the date that data were released.
For each column, the last data point contains the initial data released for that year and quarter. Each subsequent cell above contains revised data for that year and quarter, with the revision date indicated in the corresponding vertical axis.
Expert users
In the world of expert users, knowing the full history of a data point can be very useful. For instance, specialists at the Bank of Canada pay close attention to both real-time data and the subsequent revised estimates of the same data. Was this indicator revised up in the months after release? Was it revised down? Did the figure from the initial release change at all? Such information helps them to better understand the accuracy of economic data and its effects on economic decisions or forecasting.
Inside Statistics Canada, analysts are asking the same questions, albeit for different reasons. By examining the extent of revisions over time, they can determine the accuracy of preliminary estimates, detect potential biases and refine statistical processes.
As of August 26, the agency began publishing real-time data tables for selected data series. This makes it much easier for these expert users to track the revisions and learn how the revision process has affected the numbers.
Transparent processes
Tony Labillois, who heads the real-time data project at Statistics Canada, says providing real-time tables is part of making Statistics Canada's programs more transparent for all data users.
"We understood a long time ago that our users really wanted to have transparent, reliable, easily understandable information on our products and our data. That is part of our mission and our mandate to provide as much data as we can on important topics," Mr. Labillois says. "The real-time databases increase the accessibility of Statistics Canada's data holdings by providing our users with improved access to information about revisions to leading economic indicators."
The tables chosen represent the 20 key economic and social tables that users have identified as most relevant. They include the Survey of Employment, Payrolls and Hours; Balance of international payments; and, International Merchandise trade statistics (imports and exports).
The project team has also released a Behind the data article to further explain some of the agency's statistical methods. The article advises users to read the explanatory notes that accompany each table to better understand the real-time sequence of numbers. "For now, the series are not very long, but 5 years or 10 years from now, users will be able to undertake comprehensive revision analysis related to a number of Canada's leading economic indicators," he says.
Small revisions
Mr. Labillois stresses that planned revisions are a normal part of the statistical process and are not the result of an error. All national statistical agencies publish data to ensure that information on the state of the economy or society is available in a timely way. Then, data are revised over time as more information becomes available to ensure the accuracy of the latest vintages. For example, a number of complex inputs go into determining GDP. Each input is subject to revision as new information or new sources become available and make it possible to re-measure each figure more accurately.
By keeping tabs on real-time data points, expert users can be reassured that StatCan data is of consistent quality. "It is a very limited audience for such a product. But it is good for everybody to know that we have created real-time tables because we are proud of the statistics that we produce. We are thinking of quality and of the fact that we need to be transparent. It is a way to open our books."
Login/register to post comments.
Recent posts
-
 1904 people recommended this
 -
 2551 people recommended this
 -
 2925 people recommended this