
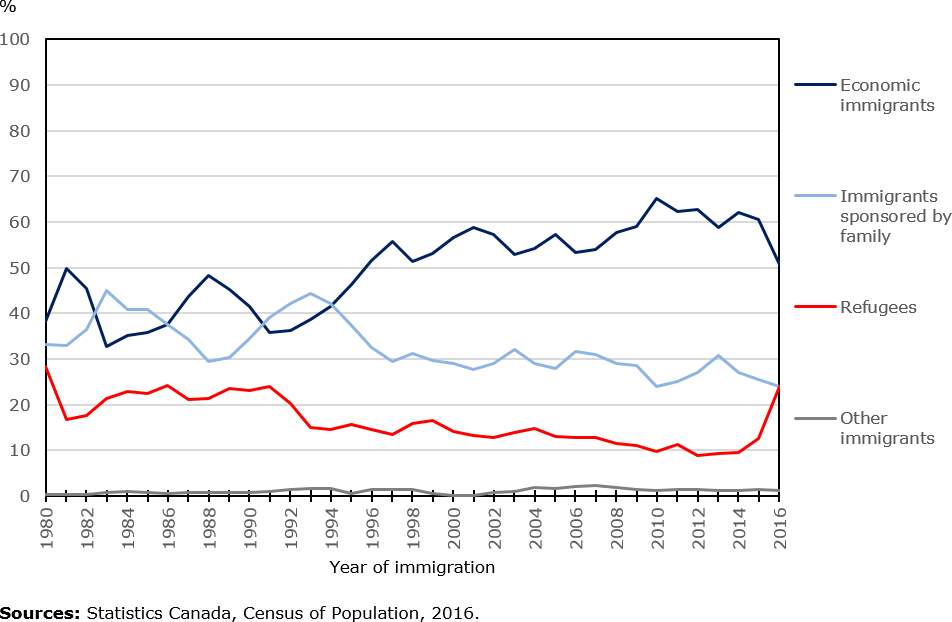
Data table for the graph
| Economic immigrants | Immigrants sponsored by family | Refugees | Other immigrants | |
|---|---|---|---|---|
| 1980 | 38.1 | 33.2 | 28.4 | 0.2 |
| 1981 | 49.9 | 33.0 | 16.7 | 0.4 |
| 1982 | 45.6 | 36.4 | 17.7 | 0.4 |
| 1983 | 32.8 | 45.0 | 21.3 | 0.8 |
| 1984 | 35.2 | 40.9 | 23.0 | 0.9 |
| 1985 | 35.9 | 40.9 | 22.4 | 0.9 |
| 1986 | 37.6 | 37.5 | 24.3 | 0.6 |
| 1987 | 43.8 | 34.3 | 21.2 | 0.8 |
| 1988 | 48.3 | 29.5 | 21.4 | 0.8 |
| 1989 | 45.2 | 30.4 | 23.6 | 0.8 |
| 1990 | 41.4 | 34.5 | 23.2 | 0.9 |
| 1991 | 35.8 | 39.1 | 24.0 | 1.1 |
| 1992 | 36.2 | 42.2 | 20.3 | 1.4 |
| 1993 | 38.8 | 44.4 | 15.0 | 1.8 |
| 1994 | 41.5 | 42.2 | 14.6 | 1.7 |
| 1995 | 46.2 | 37.4 | 15.7 | 0.6 |
| 1996 | 51.5 | 32.5 | 14.6 | 1.4 |
| 1997 | 55.8 | 29.5 | 13.4 | 1.3 |
| 1998 | 51.4 | 31.3 | 15.9 | 1.4 |
| 1999 | 53.1 | 29.7 | 16.6 | 0.6 |
| 2000 | 56.5 | 29.1 | 14.2 | 0.2 |
| 2001 | 58.8 | 27.8 | 13.3 | 0.1 |
| 2002 | 57.3 | 28.9 | 12.9 | 0.8 |
| 2003 | 53.0 | 32.2 | 13.8 | 1.0 |
| 2004 | 54.2 | 29.1 | 14.9 | 1.8 |
| 2005 | 57.2 | 27.9 | 13.1 | 1.7 |
| 2006 | 53.4 | 31.7 | 12.8 | 2.2 |
| 2007 | 53.9 | 31.0 | 12.8 | 2.3 |
| 2008 | 57.7 | 29.0 | 11.4 | 1.8 |
| 2009 | 59.0 | 28.7 | 11.0 | 1.4 |
| 2010 | 65.2 | 23.9 | 9.7 | 1.2 |
| 2011 | 62.2 | 25.1 | 11.3 | 1.3 |
| 2012 | 62.8 | 27.0 | 8.8 | 1.4 |
| 2013 | 58.8 | 30.8 | 9.2 | 1.2 |
| 2014 | 62.0 | 27.1 | 9.6 | 1.3 |
| 2015 | 60.5 | 25.5 | 12.6 | 1.4 |
| 2016 | 50.6 | 24.1 | 24.1 | 1.2 |
| Source: Statistics Canada, Census of Population, 2016. | ||||