
Data table for the graph
| British Isles | Europe (excluding the British Isles) | United States | Caribbean, Bermuda, Central and South America | Africa | Asia (including the Middle East) | Oceania and others | ||
|---|---|---|---|---|---|---|---|---|
| Observed | ||||||||
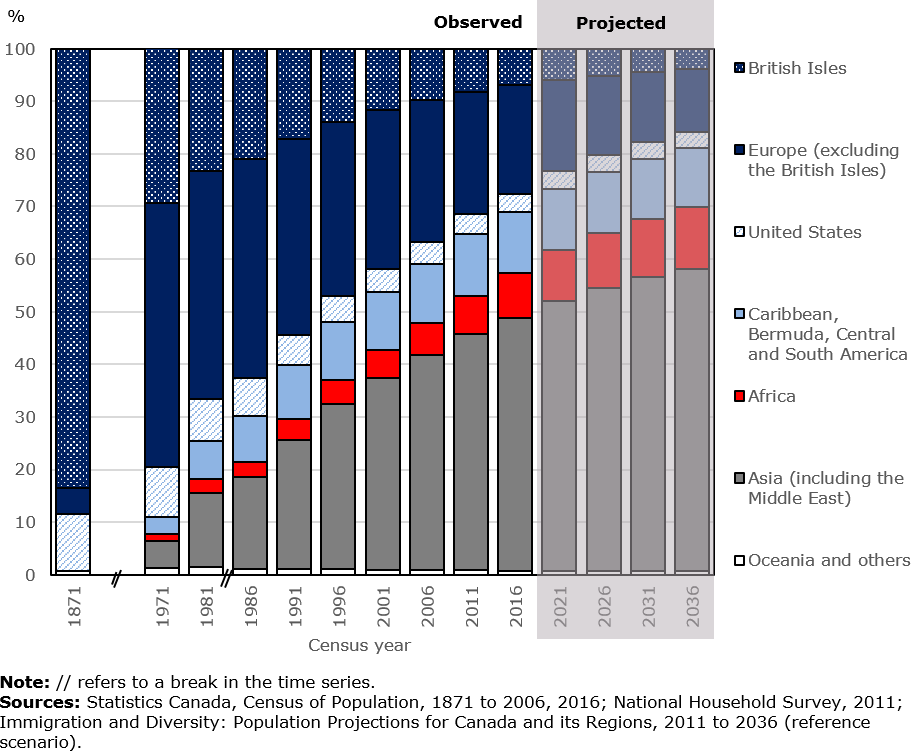
| 1871 | 83.6 | 4.8 | 10.9 | 0.0 | 0.0 | 0.0 | 0.7 | |
| 1971 | 29.5 | 50.2 | 9.4 | 3.2 | 1.4 | 5.0 | 1.3 | |
| 1981 | 23.3 | 43.4 | 7.8 | 7.3 | 2.6 | 14.1 | 1.5 | |
| 1986 | 21.0 | 41.6 | 7.2 | 8.7 | 2.9 | 17.5 | 1.1 | |
| 1991 | 17.2 | 37.2 | 5.7 | 10.4 | 3.8 | 24.6 | 1.1 | |
| 1996 | 13.8 | 33.1 | 4.9 | 11.1 | 4.6 | 31.4 | 1.0 | |
| 2001 | 11.6 | 30.4 | 4.4 | 11.0 | 5.2 | 36.5 | 1.0 | |
| 2006 | 9.7 | 27.1 | 4.0 | 11.3 | 6.1 | 40.8 | 1.0 | |
| 2011 | 8.3 | 23.1 | 3.9 | 11.7 | 7.3 | 44.9 | 0.8 | |
| 2016 | 7.0 | 20.7 | 3.4 | 11.6 | 8.5 | 48.1 | 0.8 | |
| Projected | ||||||||
| 2021 | 6.0 | 17.2 | 3.4 | 11.6 | 9.7 | 51.3 | 0.8 | |
| 2026 | 5.1 | 15.1 | 3.3 | 11.5 | 10.5 | 53.8 | 0.7 | |
| 2031 | 4.5 | 13.4 | 3.1 | 11.4 | 11.2 | 55.8 | 0.7 | |
| 2036 | 3.9 | 12.0 | 3.0 | 11.3 | 11.7 | 57.4 | 0.7 | |
| Sources: Statistics Canada, Census of Population, 1871 to 2006, 2016; National Household Survey, 2011; Immigration and Diversity: Population Projections for Canada and its Regions, 2011 to 2036 (reference scenario). | ||||||||