
Data table for the graph
| Number | Percentage | |
|---|---|---|
| Observed | ||
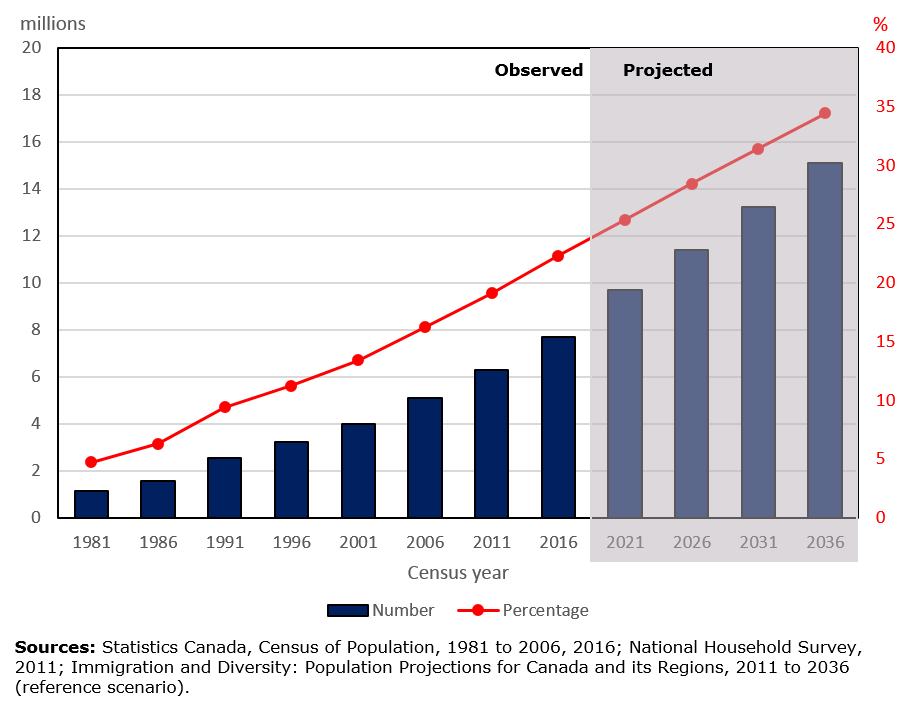
| 1981 | 1,131,825 | 4.7 |
| 1986 | 1,577,710 | 6.3 |
| 1991 | 2,525,480 | 9.4 |
| 1996 | 3,197,480 | 11.2 |
| 2001 | 3,983,845 | 13.4 |
| 2006 | 5,068,090 | 16.2 |
| 2011 | 6,264,750 | 19.1 |
| 2016 | 7,674,580 | 22.3 |
| Projected | ||
| 2021 | 9,679,000 | 25.4 |
| 2026 | 11,398,000 | 28.4 |
| 2031 | 13,198,000 | 31.4 |
| 2036 | 15,069,000 | 34.4 |
| Sources: Statistics Canada, Census of Population, 1981 to 2006, 2016; National Household Survey, 2011; Immigration and Diversity: Population Projections for Canada and its Regions, 2011 to 2036 (reference scenario). | ||