
The real Gross Domestic Product (GDP) by industry series estimates by province and territory are based on the chain Fisher formulaNote 1, which is not additive. Non-additivity of the real series comes both from chaining and from the Fisher formula itself. Chaining destroys the additive consistency of accounting equations and the Fisher formula does not have the additivity property. The fact that the real aggregates are not additive makes it more difficult to measure the contribution of an individual aggregate, sector or industry to the total economy, as the sum of the underlying components does not add to the total. This problem of additivity increases the further the distance from the reference year and the more relative prices change.
There are a variety of ways to overcome this additivity issue. For an analysis of industry or provincial and territorial shares, current values (or current prices) may be a sufficient or even more desirable alternative, because they reflect the economic structure at the prices of the period under study. For growth analysis, however, current values are not always appropriate as they combine both changes in prices and in volumes. For example, if an industry in a given jurisdiction gains (or loses) nominal value it might be the result of various combinations of price and volume changes (Figure 1) within its economy, and in turn will also impact how this industry contributes to the nominal national variations.
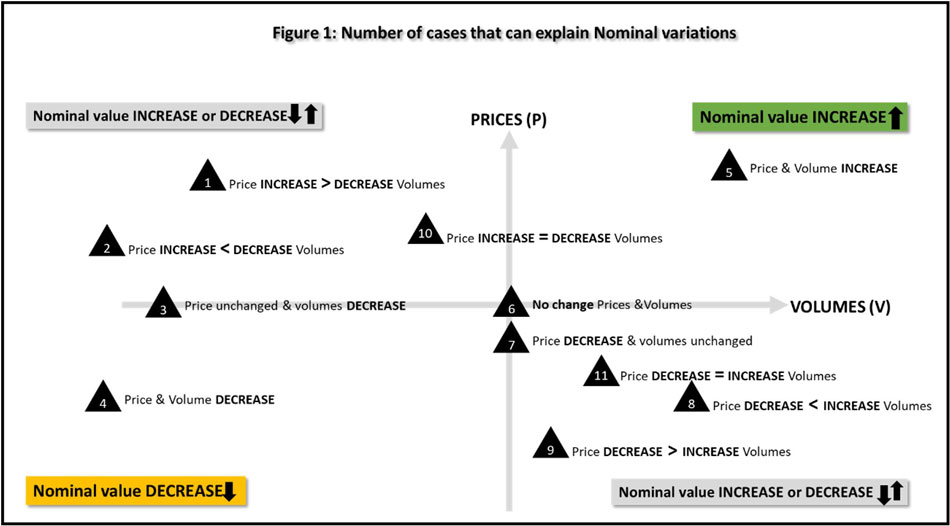
Figure 1 description
The title of Figure 1 is "Number of cases that can explain Nominal variations"
The Figure 1 shows the number of possible price and volume movements that can occur in the economy from one period to the next period for various goods and services for nominal variations.
- Price increase can be greater than the volume decrease.
- Price increase can be less than the volume decrease.
- Price can be unchanged while volume decrease.
- Price and volumes can both decrease.
- Price and volumes can both increase.
- Price and volumes can both remain unchanged.
- Price can decrease while volumes remain unchanged.
- Price decrease can be less than increase in volumes.
- Price decrease can be greater than increase in volumes.
- Price increase is the same as volume decrease.
- Price decrease is the same as volume increase
As seen from Figure 1, with different price and volume combinations, it becomes difficult to differentiate whether a nominal variation is due to a change in price or volume or some combination of the two. Fisher based GDP estimates are adjusted for price fluctuations such that "real" volume movements can be analyzed. As discussed above since Fisher based estimates are non-additive, it can be challenging to analyze how industries in the provinces or territories contribute to their own total economy and in turn how provinces and territories contribute to the real growth of the Canadian economy.
Useful complementary measure are provided by the Contributions to Percentage Change (CPC) and provincial and territorial Contributions to National Percentage Change (CNPC) formulas, which present a strictly additive decomposition of the variations in the aggregates. The formulas re-weight the contributions of the detailed series in such a way that they become strictly additive to the total variation of the aggregate.
The CPC formula is a function of GDP at current values, the Paasche and Laspeyres volumes of GDP and the Fisher volume index.
CPC
Where:
CGDPi: GDP at current values for industry i at time t and t-1
LGDPi: Laspeyres GDP volume for industry i at time t
PGDPi: Paasche GDP volume for industry i at time t-1
FV: Fisher volume index at time t
This formula is the basis of the CPC series published by the Provincial and Territorial GDP by Industry program. It allows measuring the contribution of an individual industry or aggregate to the percentage change in total GDP in "real" terms.
Table 1 provides an example of contributions to percentage change in the context of a Fisher index. As noted above, the sum of the detailed industries does not add up to the total index for columns t and t-1, making it difficult to relate the individual industry growth rates to the aggregate growth rate. The CPC, however, provides a completely additive measure of the contribution of each industry to the aggregate growth rate.
| Industry | t-1 | t | Growth rate | CPC |
|---|---|---|---|---|
| A | 108 | 144 | 33.33% | 1.98 |
| B | 224 | 238 | 6.25% | 1.66 |
| C | 525 | 540 | 2.86% | 1.49 |
| D | 150 | 162 | 8.00% | 1.22 |
| Total (Fisher) | 1,003.7 | 1,067.4 | 6.35% | 6.35 |
The CPC measure discussed above, although useful in analyzing how industries or an aggregate contributes to the jurisdiction's own economy, does not show how an industry or an aggregate within a given province or territory contributes to the real national economic growth. The CNPC formula allows measurement of the contribution of an individual industry or aggregate in provinces or territories to the percentage change in total national GDP in "real" terms.
CNPC
Where:
CGDPi,j: GDP at current values for industry i and jurisdiction j at time t and t-1
LGDPi,j: Laspeyres GDP volume for industry i and jurisdiction j at time t
PGDPi,j: Paasche GDP volume for industry i and jurisdiction j at time t-1
FVN: National Fisher volume index at time t
Table 2 provides an example of provincial and territorial contributions to percentage change in Canada in the context of a Fisher index. As with Table 1, the sum of the provinces and territories by industry does not add up to the total index for columns t and t-1, making it difficult to relate the provincial and territorial growth rates by industry to the national growth rate. The CNPC, however, provides a completely additive measure of the contribution of each industry in the province and territory to the total national growth rate.
| Geography | Industry | t-1 | t | Growth rate | CNPC |
|---|---|---|---|---|---|
| Geo 1 | A | 102,767 | 109,633 | 6.68% | 0.35 |
| B | 1,099,806 | 1,123,901 | 2.19% | 1.25 | |
| Geo 2 | A | 711,388 | 731,888 | 2.88% | 1.07 |
| B | 10,335 | 11,842 | 14.58% | 0.08 | |
| Total National | Total (Fisher) | 1,926,783 | 1,979,750 | 2.75% | 2.75 |
Although comparing statistics from different periods is an acceptable application of the CPC and CNPC measure, it should not be used to conduct a period over period growth rate analysis. Furthermore, the contributions to percentage change should not be interpreted as proportions.