
Individual Data - User guide
Statistics Canada
89C0022
Income Statistics Division
Statistics Canada
income@statcan.gc.ca
October 2013
Aussi disponible en français
Table of contents
- Introduction
- Section 1 — The data
- Data Source
- Data Currency
- Data Quality
- Confidentiality and Rounding
- Suppressed Data
- Section 2 — The data tables
- Data Table Contents
- Economic Dependency Profile
- Labour Income Profile
- Neighbourhood Income and Demographics
- Statistical Tables – Footnotes and Historical Availability
- Data Table Contents
- Section 3 — Glossary of terms
- Section 4 — Geography
- Geographic Levels - Postal Geography
- Adding postal areas without duplication
- City identification number (CityID)
- Hierarchy of postal geography
- Geographic Levels - Census Geography
- Geographic Levels - Special Geography
- Postal Code Conversion File
- Geographic Levels - Postal Geography
- We invite your comments
- List of available data products
Introduction
Urban planning, social policy, and local marketing strategies require a comprehensive understanding of regional socio-economic characteristics. The T1 Family File (T1FF) data available for low levels of geography can contribute significantly to this knowledge.
The databank on seniors is one of these T1FF data sources. This databank is compiled from information obtained through annual personal income tax returns and is updated annually.
Beginning with the 1990 tax year, four tables concentrating on seniors and their census family situation were available. With the 1994 data, a fifth table on senior individuals was added to the previous four. See also Statistical tables - Footnotes and historical availability.
Beginning with 2007, the age groups for tables 3, 4 and 5 have been changed to the following ones: 0 to 34, 35 to 54, 55 to 64 and 65+.
For simplicity, this documentation has been divided into four sections:
The first section deals with the source of the data, its currency and accuracy and how the data are presented to maintain confidentiality.
The second section on data tables includes notes of explanation and describes the format of the data tables. Starting with 2010 the T1FF standard tables are available at no cost on CANSIM for the following geographies: Canada, the provinces and territories, census metropolitan areas (CMA) and census agglomerations (CA starting as of 2008). Data for other levels of geography can be obtained by contacting the Client Services Section of the Income Statistics Division, Statistics Canada (613-951-7355, toll free 1-888-297-7355, e-mail:income@statcan.gc.ca).
The glossary, in the third section, will provide the data user with definitions of the terms used in this documentation.
The fourth section contains an explanation of the geographic levels available.
Note: For additional information on families, please refer to the T1FF Statistics Canada product 13C0016 Family Data.
Section 1 — The data
Data Source
The data are derived primarily from income tax returns. For the most part, tax returns were filed in the spring of the year following the reference year. The mailing address at the time of filing is the basis for the geographic information in the tables.
Beginning with 1992 data, demographic statistics are included in the standard tables for both taxfilers and the non-filing population. These statistics are derived from the small area and administrative family databank (T1 Family File) built from income tax records and other sources of administrative data. For tables of previous years (up to and including 1991), demographic statistics were provided for taxfilers only.
Data Currency
Because the data are taken from tax records, they are current data from tax returns filed for the year noted on the tables. For example, 2011 income records are taken from 2011 tax returns filed in the spring of 2012, with data released during the summer of 2013. Data are released on an annual basis.
Data Quality
The data appearing in the tables are taken directly from the T1 Family File (T1FF), built from the income tax and the Canada Child Tax Benefit records. Information on income is obtained from the taxfilers, for both themselves and their non-filing spouses. Demographic information is derived from taxfilers and non-filing spouses and/or children, such as the estimates of the "number of persons".
In 2011, about 74.4% of Canadians (of all ages) filed tax returns (see Table A).
Most children do not file because they have low or no income.
Similarly, some elderly Canadians receiving only Old Age Security (OAS) and Guaranteed Income Supplement (GIS) do not file because they have low or no taxable income. However, with the introduction of the federal sales tax credit in 1986 and the goods and services tax credit in 1989, the percentage of the elderly population filing tax returns has increased.
In 2011, 94.2% filed tax returns, up from 75% in 1989 (when comparing the number of taxfilers aged 65 years or more with the corresponding population estimate counts to July 1, 2012, available on CANSIM 051-0001 from Statistics Canada).
| Tax year | Number of Taxfilers | Date of Population Estimate | Population | Coverage |
|---|---|---|---|---|
| ('000) | ('000) | (%) | ||
| 1990 | 18,450 | 01-Apr-91 | 27,936 | 66.0 |
| 1991 | 18,786 | 01-Apr-92 | 28,265 | 66.5 |
| 1992 | 19,267 | 01-Apr-93 | 28,597 | 67.4 |
| 1993 | 19,882 | 01-Apr-94 | 28,905 | 68.8 |
| 1994 | 20,184 | 01-Apr-95 | 28,211 | 71.5 |
| 1995 | 20,536 | 01-Apr-96 | 28,515 | 72.0 |
| 1996 | 20,772 | 01-Apr-97 | 28,819 | 72.1 |
| 1997 | 21,113 | 01-Apr-98 | 30,082 | 70.2 |
| 1998 | 21,431 | 01-Apr-99 | 30,317 | 70.7 |
| 1999 | 21,893 | 01-Apr-00 | 30,594 | 71.6 |
| 2000 | 22,249 | 01-Apr-01 | 30,911 | 72.0 |
| 2001 | 22,804 | 01-Apr-02 | 31,252 | 73.0 |
| 2002 | 22,968 | 01-Apr-03 | 31,548 | 72.8 |
| 2003 | 23,268 | 01-Apr-04 | 31,846 | 73.1 |
| 2004 | 23,625 | 01-Apr-05 | 32,143 | 73.5 |
| 2005 | 23,952 | 01-Apr-06 | 32,471 | 73.8 |
| 2006 | 24,259 | 01-Apr-07 | 32,818 | 73.9 |
| 2007 | 24,624 | 01-Apr-08 | 33,191 | 74.2 |
| 2008 | 24,987 | 01-Apr-09 | 33,605 | 74.4 |
| 2009 | 25,244 | 01-Apr-10 | 34,002 | 74.2 |
| 2010 | 25,484 | 01-Apr-11 | 34,368 | 74.2 |
| 2011 | 25,870 | 01-Apr-12 | 34,754 | 74.4 |
| Note: Percent coverage is based on a comparison of the number of taxfilers in the Income Statistics Division's taxfiler databank and the latest population estimates from the Statistics Canada publication Quarterly Demographic Statistics (catalogue no. 91-002) or CANSIM table 051-0005, now available on the Statistics Canada web site. | ||||
The initial population used to develop the estimated population counts comprise all taxfilers for the reference year and represents almost three-quarter of the Canadian population. Taxfilers from the same family including children are matched using common links (e.g., same name, same address). When there are indications that one or several members of a family are missing (for instance children), those members are imputed. The remaining taxfilers who have not been matched in the family formation process become non-family persons. The resulting population counts approximate the total Canadian population.
The Income Statistics Division’s population estimates compare well with estimates obtained through other sources. For example, coverage rates by age from the databank, compared to the official population estimates, are:
| Rates of Coverage by Age | % |
|---|---|
| under 20 | 101.9 |
| 20-24 | 84.4 |
| 25-29 | 87.3 |
| 30-34 | 90.4 |
| 35-39 | 94.7 |
| 40-44 | 96.3 |
| 45-49 | 95.6 |
| 50-54 | 94.2 |
| 55-59 | 93.3 |
| 60-64 | 95.4 |
| 65-74 | 94.8 |
| 75+ | 94.5 |
| Total | 94.9 |
| Rates of Coverage by Province | |
| Newfoundland & Labrador | 100.0 |
| Prince Edward Island | 95.4 |
| Nova Scotia | 95.1 |
| New Brunswick | 97.7 |
| Quebec | 96.7 |
| Ontario | 94.1 |
| Manitoba | 95.0 |
| Saskatchewan | 96.5 |
| Alberta | 94.1 |
| British Columbia | 92.9 |
| Yukon Territory | 92.1 |
| Northwest Territories | 95.1 |
| Nunavut | 96.0 |
| Canada | 94.9 |
| Note: Coverage rates by age and by province are based on comparisons with the estimated population counts to July 1, 2012 available on CANSIM table 051-0001 from Statistics Canada. | |
Beginning in 1992, “Total income” was changed to include income of non-filing spouses reported on the taxfiler's income tax return. This increased the population of lower income individuals, subsequently lowering the median total income of the population. See the following table (Table C). Starting with 2001 data, wage and salary income of non-filing spouses can be identified, in some cases, from T4 earnings statements.
| Year | Median Income, Individuals | % ratio | |
|---|---|---|---|
| T1FF | SCF/SLID | ||
| 1990 | 19,100 | 18,737 | 101.9 |
| 1991 | 19,300 | 19,040 | 101.4 |
| 1992 | 18,600 | 19,667 | 94.6 |
| 1993 | 18,000 | 19,400 | 92.8 |
| 1994 | 18,500 | 19,587 | 94.5 |
| 1995 | 18,900 | 20,134 | 93.9 |
| 1996 | 19,000 | 20,202 | 94.1 |
| 1997 | 19,400 | 20,581 | 94.3 |
| 1998 | 20,100 | 20,081 | 100.1 |
| 1999 | 20,800 | 20,432 | 101.8 |
| 2000 | 21,600 | 21,511 | 100.4 |
| 2001 | 22,600 | 21,500 | 105.1 |
| 2002 | 23,100 | 22,100 | 104.5 |
| 2003 | 23,600 | 22,500 | 104.9 |
| 2004 | 24,400 | 23,300 | 104.7 |
| 2005 | 25,400 | 24,100 | 105.4 |
| 2006 | 26,500 | 25,200 | 105.2 |
| 2007 | 27,960 | 26,900 | 103.9 |
| 2008 | 28,920 | 27,300 | 105.9 |
| 2009 | 28,840 | 27,400 | 105.2 |
| 2010 | 29,250 | 27,600 | 106.0 |
| 2011 | 30,180 | 29,000 | 104.1 |
| Note: The above T1FF medians are from the T1 Family File of the Income Statistics Division. SCF (Survey of Consumer Finances) was replaced by the SLID (Survey of Labour and Income Dynamics); medians for 1990-1997 are from Statistics Canada's annual publication 13-207, Income distributions by size in Canada. Medians for 1998 and 1999 are from Statistics Canada CD-ROM 13F0022XCB, Income Trends in Canada. The 2000 and 2005 T1FF medians are compared to the 2001 and 2006 Censuses data (2000 and 2005 income). Starting from 2001 median is taken from CANSIM table 202-0402. Because, data in CANSIM are presented in Constant dollars, the series has been adjusted in current dollars using Consumer Price Indexes. The SCF and SLID estimates do not include the Territories. |
|||
| Transfer Payment | Coverage | Source of Comparison |
|---|---|---|
| Employment Insurance Benefits | 95.2% | CANSIM Table 380-0034 and QPIP Official Statistics1 |
| Canada Child Tax Benefits & Universal Child Tax Benefits | 98.5% | CANSIM Table 380-00342 |
| Canada Child Tax Benefits & Universal Child Tax Benefits | 98.1% | Canada Revenue Agency, Benefits Statistics3 |
| Canada/Quebec Pension Plans | 94.1% | CANSIM Table 380-00224 |
| Old Age Security Benefits | 96.8% | CANSIM Table 380-00342 |
| Social Assistance | 71.5% | CANSIM Table 380-00332 |
| Workers’ Compensation | 84.1% | CANSIM Table 380-00332 |
| Goods and Services Tax Credit | 77.4% | CANSIM Table 380-00342 |
| Goods and Services Tax Credit | 104.3% | Canada Revenue Agency, Benefits Statistics5 |
| Sources: 1) Statistics Canada, System of National accounts, National Income and expenditure sub-sector accounts, Quarterly estimates and Conseil de gestion de l'assurance parentale du Québec, Official Statistics for the Quebec Parental Insurance Plan, December 2011 2) System of National Accounts, Statistics Canada, National Income and Expenditure Sub-sector Accounts, Quarterly Estimates 3) Canada Revenue Agency, Benefits Statistics, Canada Child Tax Benefit and Universal Child Care Benefit 4) System of National Accounts, Statistics Canada, National Income and Expenditure Sub-sector Accounts, Annual Estimates 5) Canada Revenue Agency, Benefits Statistics, Goods and Services Tax Credits |
||
Confidentiality and Rounding
All data are subject to the confidentiality procedures of rounding and suppression.
To protect the confidentiality of Canadians, counts are rounded. Rounding may increase, decrease, or cause no change to counts. Rounding can affect the results obtained from calculations. For example, when calculating percentages from rounded data, results may be distorted as both the numerator and denominator have been rounded. The distortion can be greatest with small numbers.
Starting with the 2007 data, all reported amounts are rounded to the nearest $5,000 dollars.
Since 1990, data cells represent counts of 15 or greater, and are rounded to a base of 10. For example, a cell count of 15 would be rounded to 20 and a cell count of 24 would be rounded to 20.
For 1988 and 1989 data, all counts are 25 or greater and they are rounded to the nearest 25. Reported amounts are rounded to the nearest thousand dollars.
For data up to and including 1987, all counts are randomly rounded to a base of 5, and reported amounts are unrounded, but are adjusted according to the rounding of the counts.
Note: Counts represent the number of persons.
Reported amounts are aggregate dollar amounts reported.
Suppressed Data
To maintain confidentiality, data cells have been suppressed whenever:
- areas comprise less than 100 taxfilers;
- cells represent less than 15 taxfilers;
- cells were dominated by a single taxfiler;
- cells for median income were based on a rounded count of less than 20 taxfilers.
Suppressed data may occur:
- within one area:
- when one of the income categories is suppressed, a second category must also be suppressed to avoid disclosure of confidential data by subtraction (called residual disclosure) (see Table E);
- when one of the gender categories is suppressed, the other gender category must also be suppressed to avoid residual disclosure (see Table E);
- when one age group category is suppressed, another age group must also be suppressed to avoid residual disclosure.
- between areas:
- when a variable amount in one area is suppressed, that variable amount is also suppressed in another area to prevent disclosure by subtraction.
| Males | Females | Total | |
|---|---|---|---|
| Amount (Millions of Dollars) | |||
| Wages/Salaries/Commissions | 6.7 | 3.4 | 10.2 |
| Self-Employment | 0.3 | 0.2 | 0.5 |
| Dividends and Interest | 1.2 | 1.1 | 2.3 |
| Employment Insurance | 0.7 | 0.3 | 1 |
| Old Age Security/Net Federal Supplements | 0.7 | 0.5 | 1.1 |
| Canada/Quebec Pension Plan | 1.1 | 0.5 | 1.6 |
| Private Pensions | 1.9 | 0.4 | 2.3 |
| Canada Child Tax Benefits | x | x* | 0.1 |
| Goods and Services Tax Credit/Harmonized Sales Tax Credit | x** | x** | 0.2 |
| Workers' Compensation | 0.1 | 0.1 | 0.2 |
| Social Assistance | 0.2 | 0.2 | 0.5 |
| Provincial Refundable Tax Credits | 0.1 | 0.1 | 0.2 |
| Registered Retirement Savings Plan Income | 0.1 | 0.1 | 0.2 |
| Other Income | 0.6 | 0.6 | 1.2 |
| Total Income | 14.5 | 7.8 | 22.3 |
| x Confidential when reported by fewer than 15 taxfilers. (In the data supplied to clients, the suppressed cell will contain a "0".) x* For the same income variable, the value for the opposite gender was suppressed in the table to avoid disclosure by subtraction. x** The value for a second income variable was suppressed elsewhere in the table to avoid disclosure by subtraction. |
|||
Section 2 — The data tables
Data Table Contents
The following section lists the T1FF standard individual tables available for Canada, provinces and territories, federal electoral districts, economic regions, census divisions, census metropolitan areas, census agglomerations, and census tracts. In some cases tables retrieved in an Excel have been divided in parts for display purposes. The T1FF standard tables are available at no cost on CANSIM for the following geographies: Canada, provinces and territories, census metropolitan areas and census agglomerations.
Economic Dependency Profile
CANSIM Table 111-0025 Economic Dependency Profiles
Beginning with 1988, the Economic Dependency Profile includes the federal sales tax (FST) credit as an additional component of transfer payments. In 1990, the goods and services tax (GST) credit began replacing the FST credit, and completely replaced it by 1991. Beginning with the 1997 data, this became the goods and services tax (GST)/harmonized sales tax (HST) credit.
The provincial tax credits and non-taxable income are included in transfer payments and in total income for the first time with the 1990 data. This category was split in 1994 to show separately workers' compensation, social assistance, and provincial refundable tax credits/family benefits.
The addition of variables such as GST and provincial tax credits increases the sums reported for transfer payments and has an impact on the economic dependency ratios. These changes should be taken into consideration when making comparisons to data from previous years.
Beginning in 1993, the (Canada) Child Tax Benefit replaces the Federal Family Allowance Program and child tax credits.
Starting with the 1996 data, a dependency ratio is calculated for government transfers (a ratio that, for the first time, excludes private pensions).
Each table contains the following information for government transfers (total) and each of its components:
Number
- Total number of individuals in receipt of at least one of the transfers.
Amount ($'000)
- Total transfers expressed in thousands of dollars.
Employment Income ($'000)
- Total employment income in thousands of dollars. Employment income includes wages and salaries, commissions from employment, training allowances, tips and gratuities, self-employment income (net income from business, profession, farming, fishing and commissions) and Indian employment income (new in 1999).
Economic Dependency Ratio (EDR)
- For a given area, the EDR is the ratio of transfer dollars to every $100 of total employment income. For example, where a table shows an EDR of 12.1, it means that $12.10 was received in transfer payments for every $100 of employment income for that area.
Provincial Index (Province = 100)
- The EDR for the area is expressed as a percentage of the EDR for the province. For example, if the EDR for an area has a provincial index of 110, that EDR is 10% higher than the provincial EDR.
Canadian Index (Canada = 100)
- The EDR for the area is expressed as a percentage of the EDR for Canada. Hence, if the Canadian index for an area is 95, that area's EDR is 95% of the national EDR.
The following table indicates which transfer payments appear on the data tables. The variables that apply to the transfer payments are indicated with a “√”.
| Transfer Payment | Number reporting | Amount ($'000) | Contrib. to EDR | Prov. Index | Cdn Index |
|---|---|---|---|---|---|
| Employment Income | √ | √ | |||
| Government Transfers | √ | √ | √ | √ | √ |
| Employment Insurance | √ | √ | √ | ||
| GST/HST Credit | √ | √ | √ | ||
| Canada Child Tax Benefit | √ | √ | √ | ||
| Old Age Security/Net Federal Supplements | √ | √ | √ | ||
| Canada/Quebec Pension Plans | √ | √ | √ | ||
| Workers' Compensation | √ | √ | √ | ||
| Social Assistance | √ | √ | √ | ||
| Provincial Refundable Tax Credits/Family Benefits | √ | √ | √ | ||
| Other Government Transfers | √ | √ | √ |
Labour Income Profile
CANSIM Table 111-0024 Labour Force Income Profiles
The Labour Income Profile table is divided into the categories below. A brief description of each category follows. See also the Glossary.
Taxfilers and dependents
- This represents an estimate of the total population as derived from the taxfile. Included here are taxfilers, their non-filing spouse and their children; the latter can be filing or non-filing children. Spouses and children can be identified by the information on a taxfiler's return, from T4 records and from the Canada Child Tax Benefits (CCTB).
Number
- The total number of taxfilers and imputed spouses reporting income for the period represented in the data table.
Amount ($'000)
- The total amount of reported and imputed income, expressed in thousands of dollars.
Median ($)
- Half of the population reported less than or equal to the median income, and the other half reported more than or equal to the median. See glossary for further explanation.
Provincial Index (Province = 100)
- The median income for the area is expressed as a percentage of the median income for the province.
Canadian Index (Canada = 100)
- The median income for the area is expressed as a percentage of the median income for Canada.
The following table indicates the types of income that are included in the Labour Income Profile table.
The variables that apply to each type of income are indicated with a "√".
| Number Reporting | Amount ($'000) | Median ($) | Prov. Index | Cdn Index | |
|---|---|---|---|---|---|
| Taxfilers and Dependents | √ | ||||
| Taxfilers | √ | ||||
| Total Income | √ | √ | √ | √ | √ |
| Labour Income | √ | √ | |||
| Employment Income | √ | √ | √ | √ | √ |
| Wages/Salaries/Commissions | √ | √ | |||
| Self-Employment Income | √ | √ | |||
| Wages/Salaries/Commissions only | √ | √ | |||
| Self-employment only | √ | √ | |||
| Wages/Salaries/Commissions and Self-Employment | √ | √ | |||
| Employment Insurance Benefits | √ | √ | √ | √ |
Neighbourhood Income and Demographics
Number of Tables
Beginning with the 1989 data, the maximum number of tables for each area is reduced from nine to five. It is important to note that this reduction in tables has not resulted in any loss of information from previous years. A reformatting of existing tables was the primary reason for the change. A sixth table was added to the series with the release of the 1999 data, a seventh table was added with the release of the 2003 data and an eighth table was added with the release of the 2007 data.
The table topics are the following:
Table 1, Neighbourhood income and demographics, summary table, including data for five categories of the population
CANSIM Table 111-0004 Neighbourhood income and demographics, summary table:
- all persons
- taxfilers
- persons with total income
- persons reporting employment income and/or Employment Insurance benefits
- persons reporting Canada Child Tax Benefits
For data prior to 1992, demographic characteristics are provided for taxfilers only.
Table 2, Taxfilers and dependents by marital status and by age group
CANSIM Table 111-0005 Taxfilers and dependents by sex, marital status and age group
For data prior to 1992, demographic characteristics are provided for taxfilers only.
The marital status "Common Law" is reported in table 2. This is as a result of the Canada Revenue Agency providing taxfilers with a separate box permitting common-law couples to indicate their marital status. For data prior to 1992, it is undetermined where common-law couples would have reported their marital status on the individual income tax return.
Table 3, Taxfilers and dependents by single year of age
CANSIM Table 111-0006 Taxfilers and dependents by single year of age
- Males by single year of age
- Females by single year of age
- Total by single year of age
Table 4, Taxfilers and dependents with income by source of income
CANSIM Table 111-0007 Taxfilers and dependents with income by source of income:
- Males with income by source of income
- Females with income by source of income
- Total with income by source of income
Table 5, Taxfilers and dependents with income by total income, sex and age group
CANSIM Table 111-0008 Taxfilers and dependents with income by total income, sex and age group:
- Males with income by total income and age group
- Females with income by total income and age group
- Total with income by total income and age group
Table 6, Income taxes, selected deductions and benefits
CANSIM Table 111-0026, Income taxes, selected deductions and benefits
- Males by total income, income taxes paid, capital gains, selected deductions and selected benefits
- Females by total income, income taxes paid, capital gains, selected deductions and selected benefits
- Total by total income, income taxes paid, capital gains, selected deductions and selected benefits
Table 7, Taxfilers and dependents with income by after-tax income, sex and age group
CANSIM Table 111-0043, Taxfilers and dependents with income by after-tax income, sex and age group
- Males with income by after-tax total income and age group
- Females with income by after-tax total income and age group
- Total with income by after-tax total income and age group
Table 8, Taxfilers and dependents with income by income taxes and after-tax income, sex and age group
CANSIM Table 111-0044, Taxfilers and dependents with income by income taxes and after-tax income, sex and age group
- Males with income by income taxes and after-tax income and age group
- Females with income by income taxes and after-tax income and age group
- Total with income by income taxes and after-tax income and age group
See also the section "Statistical Tables - Footnotes and Historical Availability".
Statistical Tables – Footnotes and Historical Availability
Note: for changes to variable definitions, please see Glossary of Terms.
Economic dependency profile
- Available for census divisions starting with the 1986 data.
- Available for census metropolitan areas starting with the 1989 data
- Available for census tracts, economic regions and federal electoral districts starting with 1999 data.
- Available for census agglomerations starting with 2001 data.
- Information on persons receiving the federal sales tax credit is available starting with 1988 data. This was replaced by the goods and services tax credit in 1990.
- The provincial tax credits and non-taxable income are included in the table since 1990.
- Information on workers' compensation and social assistance available as separate income sources only since 1994. Previously included in "non-taxable income".
- Since 1994, Old Age Security payments also include the Guaranteed Income Supplement and Spouse’s Allowance.
- Starting with the 1996 data, "transfer payments" was replaced by two separate categories: government transfers and private pensions. Prior to 1996, transfer payments included superannuation and other (private) pensions.
- The sources of income (or specific transfer payments) have changed over the years, depending on the information available from the T1.
- Starting with the 2007 data, “Private pensions” have been removed from the table since it is not a transfer payment.
- In 2010, Working Income Tax Benefit (WITB) is shown as Other Government Transfers and included in government transfers.
Labour income profile
- Data are available from this databank starting with 1986.
- Census divisions are available starting with 1986 data; census metropolitan areas are available since 1989.
- Available for census tracts, economic regions and federal electoral districts starting with the 1999 data.
- Available for census agglomerations starting with the 2001 data
- Starting in 1989, the category of "Wages, salaries and commissions" is shown separately.
- The count of taxfilers and dependents was added to the table with the 1992 data.
- Five-year comparisons were added to the table with the 1994 data. Since 1994, the profile includes the median employment income from five years prior, as well as percentage changes over the five-year period.
- The categories "Wages, salaries and commissions only", "Self-employment only" and "Wages,salaries and commissions and self-employment" are shown starting with the 1997 data. Previously, this could be calculated from the table.
- Starting in 2007, the five-year comparisons have been removed from the table as well as the median employment income from five years prior.
Neighbourhood income and demographics
All tables:
- Available for census divisions and census metropolitan areas starting with 1989 data.
- Income ranges are cumulative and not discrete (since 1993). This means that a person with an income of $100,000 will be included in the $10,000+ category, in the $15,000+ category, in the $20,000+ category, in the $25,000+ category, etc.
- Available for census tracts, economic regions and federal electoral districts starting with 1999 data
- Available for census agglomerations starting with 2001 data
Table 1:
- Available since 1989; previously (1986-1989) table 9 in a series of 9 tables in the older set of 9 tables for Neighbourhood Income and Demographics.
- Percent in apartments: it should be noted that this type of mail delivery service is identified by Canada Post, and applies to apartments with 50 or more units in urban areas.
- The counts of persons with total income may, in some cases, be higher than the count of taxfilers because the income of some non-filers is identified through the tax return of the filing spouse.
- Demographic characteristics are available for the entire population since 1992; from 1986 to 1991 these characteristics related to taxfilers only. Starting in 1997, characteristics are shown for both groups.
- Family allowance: removed from table in 1993
- Average age: added in 1994
- Starting in 2007, the five-year comparisons have been removed from the table.
Table 2:
- Available since 1989. Previously (1986-1989) table 1 (marital status) and table 2 (age groups) in the older set of 9 tables for Neighbourhood Income and Demographics.
- Marital status "single": the information by gender usually does not add to the total shown because the gender of the non-filing younger population is, in many cases, not known.
- Demographic characteristics are available for the entire population since 1992; from 1986 to 1991 these characteristics related to taxfilers only.
- Marital status "common law": available since 1992
- Average age: added in 1994
- New age groups added in 1994 (65-74, 75+ years) and in 1996 (0-14, 15-19 years)
Table 3:
- Available in the current format since 1989.
- Males by single year of age
- Females by single year of age
- Total taxfilers and dependents by single year of age
- information for the children between 0 and 18 years of age are derived from a variety of sources, including the tax file, the Canada Child Tax Benefit file and provincial birth files. Not all these sources provide gender information; hence the gender data are not available up to 2007. Because we use several sources of information for this population, the counts remain unrounded for these ages, while still respecting confidentiality rules.
- Starting in 2007, the gender is provided for children between 0 and 18 years of age and the counts are rounded.
Table 4:
- Available since 1989. Previously (1986-1989) table 3 (counts of taxfilers), table 4 (amounts) and table 5 (median employment income) in the older set of 9 tables for Neighbourhood Income and Demographics.
- The sources of income have changed over the years, depending on the information available from the T1.
- For 1989-1990, counts and amounts were shown for dividend income. This income category was replaced with investment income in 1991.
- For 1989-1995, transfer payments included government transfers and other (private) pensions; starting with 1996, private pensions are shown separately from government transfers.
- Since 1993, Family Allowance benefits are included in "provincial refundable tax credits".
- Since 1994, Old Age Security payments also include the Guaranteed Income Supplements and Spouse’s Allowance.
- Information on workers' compensation, social assistance and registered retirement savings plan (RRSP) income available as separate income sources only since 1994. Workers' compensation was previously included in "non-taxable income" and RRSP income in "other income".
- Only persons with any income, whether filing or non-filing, are included here.
- In 2010, Working Income Tax Benefit (WITB) is shown as Other Government Transfers and included in government transfers.
Table 5:
- Available since 1989. Previously (1986-1989) table 6 (totals by gender), table 7 (males by age group) and table 8 (females by age group) in the older set of 9 tables for Neighbourhood Income and Demographics.
- Males with income by total income and age group.
- Females with income by total income and age group.
- Only persons with any income, whether filing or non-filing, are included here.
- Income groupings were changed from discrete to cumulative groups starting with 1993.
- Some of the groupings were changed slightly over the years.
- Age group of 75+ years available starting in 1994
- Starting in 2007, age groups of 65 to 74 and 75+ have been removed and replaced with a 65+ category.
- Starting in 2007, the five-year comparisons have been removed from the table.
Table 6:
- Available in the current format since 1999.
- Only selected deductions and selected benefits are shown in this table.
Table 7:
- Available since 2003.
- Males with income by after-tax total income and age group.
- Females with income by after-tax total income and age group.
- Total taxfilers and dependents with income by after-tax total income and age group.
- Only persons with any income, whether filing or non-filing, are included here.
- Starting in 2007, age groups of 65 – 74 and 75+ have been removed and replaced with a 65+ category.
- Starting in 2007, the five-year comparisons have been removed from the table.
Table 8:
- Available since 2007.
- Males with income by income taxes and after-tax income and age group.
- Females with income by income taxes and after-tax income and age group.
- Total taxfilers and dependents with income taxes and after-tax income and age group.
- Only persons with any income, whether filing or non-filing, are included here.
Section 3 — glossary of terms
Age
Is calculated as of December 31 of the reference year (i.e., tax year minus year of birth). Starting in 2007, all the counts are rounded to the nearest 10.
Alberta Family Employment Tax Credit
Beginning in 1997, the Alberta Family Employment Tax Credit is a non-taxable amount paid to families with working income that have children under the age of 18. Included in Provincial refundable tax credits/Family benefits in the statistical tables.
Alberta Resource Rebate
Is a one-time payment of $400 made in 2006 to residents of Alberta who filed an income tax return and who were 18 years and over. Rebate for children who are under 18 will be paid to their primary caregiver. Included in Provincial refundable tax credits/Family benefits in the statistical tables for 2006 only.
Alimony
Includes payments from one former spouse to the other, for couples that are separated or divorced. Child support is also included in this variable, as reported on line 128 of the T1 tax form, where both alimony and child support are reported together, without distinction. Starting with 1998, this information is taken from line 156 of the T1 (support payments received). Included in “Other income” in the statistical tables.
All (Census) Families
Include couple families and lone-parent families.
Average Family Size
Is the average count of persons in the census family.
British Columbia Climate Action Dividend
It is a one-time payment of $100 made in 2008 to all residents of British Columbia. The British Columbia Climate Action Dividend (BCCAD) is a payment intended to help British Columbians make changes to reduce their use of fossil fuels. The Canada Revenue Agency is administering this program on behalf of British Columbia. Included in Provincial refundable tax credits/Family benefits in the statistical tables for 2008 only.
British Columbia Family Bonus
Commencing in July 1996, the BC Family Bonus program provides non-taxable amounts paid monthly to help low- and modest-income families with the cost of raising children under the age of 18. This program includes the basic Family Bonus and the BC Earned Income Benefit. Benefits are combined with the CCTB into a single monthly payment. Included in Provincial refundable tax credits/Family benefits in the statistical tables.
British Columbia Low Income Climate Action Tax Credit
Beginning in its 2009 budget, the province of British Columbia introduced the British Columbia Low Income Climate Action Tax Credit. This credit is intended to help low income individuals and families with the carbon taxes they pay and is part of the province’s commitment that the carbon tax be revenue neutral. The Canada Revenue Agency will administer this program on behalf of British Columbia. This credit is an ongoing non-taxable quarterly payment. Included in Goods and services tax/harmonized sales tax (GST/HST) credit in the statistical tables.
British Columbia Seniors Supplement
Beginning in 2005, the province of British Columbia introduced a monthly payment to seniors receiving federal Old Age Security (OAS) and the Guaranteed Income Supplement (GIS).
Canada Child Tax Benefit (CCTB)
Is a system that replaces (beginning with the 1993 data year) the previous federal Family Allowance program, the non-refundable child deduction and the refundable Child Tax Credit. It is an income supplement for individuals who have at least one qualified dependent child. The Canada Child Tax Benefit is also based on the individual's family income and the number of dependent children. The Universal Child Care Benefit is added to the CCTB beginning with the 2006 data in the statistical tables.
Canada/Quebec Pension Plan (CPP/QPP)
Are compulsory contributory social insurance plans that protect workers and their families against loss of income due to retirement, disability or death. Canada Pension Plan and Quebec Pension Plan benefits include all benefits reported for the reference year.
Census Family
This definition of the census family classifies people in the following manner: 1) couples (married or common-law) living in the same dwelling, with or without children; and 2) lone-parents (male or female) with one or more children. The residual population is called "persons not in census families" and is made up of persons living alone and of persons living in a household but who are not part of a couple family or lone-parent family. See also “Children”.
Children
Are taxfilers or imputed persons in couple and lone-parent families. Taxfiling children do not live with their spouse, have no children of their own and live with their parent or parents. Previous to the 1998 data, taxfiling children had to report “single” as their marital status. Most children are identified from the Canada Child Tax Benefit file, a provincial births file or a previous T1 family file.
CityID
Since names can be, in some cases, quite long and cumbersome for handling in electronic files, municipalities are given a city identification number. Starting in 2007, the CityID is a five digits alpha-numeric component. It is created with the first letter of postal code followed by “9” and a four digits number. Each first letter of postal code is allocated a range of number from 1 to 9999 (more explanation in geography section).
Couple Family
Consists of a couple living together (whether married or common-law) at the same address, and any children living at the same address; taxfiling children do not live with their spouse, have no child of their own and live with their parent or parents. Previous to the 1998 data, taxfiling children had to report “single” as their marital status. Beginning in 2000, same-sex couples reporting as couples are counted as couple families. See also Census families.
Dependents
For the purpose of these databanks, dependents are the non-filing members of a family. We do not attempt to measure dependency in any way, but are able to identify certain non-filing family members, and include these in the total counts of people in a given area.
Dividend Income
Includes dividend income from taxable Canadian corporations (such as stocks or mutual funds) as reported on line 120 of the personal income tax return, and then grossed down
to the actual amounts received; dividend income does not include dividends received from foreign investments (which are included in interest income and reported on line 121).
Dual-Earner Families
Are couple families where both spouses have an employment income greater than zero.
Economic Dependency Ratio (EDR)
Is the sum of transfer payment dollars received as benefits in a given area, compared to every $100 of employment income for that same area. For example, where a table shows an Employment Insurance (EI) dependency ratio of 4.69, it means that $4.69 in EI benefits were received for every $100 of employment income for the area.
Employment Income
Includes wages and salaries, commissions from employment, training allowances, tips and gratuities, self-employment income (net income from business, profession, farming, fishing and commissions) and Indian Employment Income (since 1999).
Employment Insurance (EI) Previously Unemployment Insurance (UI)
Comprises all types of benefits paid to individuals under this program, regardless of reason, including regular benefits for unemployment, fishing, job creation, maternity, parental/adoption, retirement, self-employment, sickness, training and work sharing.
Families Reporting Income
Are counted for a given source of income when that income is received by at least one family member. Families and individuals may report more than one source of income.
Family Benefits
See Alberta Family Employment Tax Credit; British Columbia Family Bonus; Canada Child Tax Benefit; New Brunswick Child Tax Benefit Supplement; Newfoundland and Labrador Child Benefit; Northwest Territories Child Benefit; Nova Scotia Child Tax Benefit; Nunavut Child Benefit; Ontario Child Care Supplement for Working Families; Manitoba Child Tax Benefit; Quebec Child Assistance Payment; Yukon Child Benefit.
Family Total Income
Is the sum of the total incomes of all members of the family (see "Total income”). New to the 1992 definition of total income is income for non-filing spouses. The information is derived from the taxfiling spouse.
Family with labour income
Includes all families where at least one of its members has reported employment income (wages, salaries, commissions or self-employment) or employment insurance benefits in the reference year.
Goods and Services Tax (GST) Credit
Includes all amounts received through this program. In 1990, the goods and services tax credit began replacing the federal sales tax (FST) credit. By 1991, the FST credit no longer existed. Beginning in 1997, the GST was harmonized with the provincial sales taxes for certain provinces.
Government Transfer Payments
For the purpose of these data, transfer payments denote the following payments made to individuals by the federal or provincial governments: Employment Insurance, Family Allowance (to 1992), FST credit (in 1989 and 1990), GST credit (which began replacing the FST credit in 1990 and completely replaced it by 1991, and became the GST/HST credit starting in 1997), Child Tax Credit (to 1992), Canada Child Tax Benefit (starting with 1993), Old Age Security pension benefits/net federal supplements, Canada and Quebec Pension plans benefits, non-taxable income and provincial refundable tax credits (both beginning in 1990), Quebec child assistance payment (beginning in 2006) which replaced the Quebec Family allowances (the latter were in place from 1994 to 2004), British Columbia Family Bonus (beginning in 1996), New Brunswick Child Tax Benefit (beginning in 1997), Alberta Family Employment Tax Credit (beginning in 1997), Northwest Territories Child Benefit (beginning in 1998), Nova Scotia Child Tax Benefit (beginning in 1998), Nunavut Child Benefit (beginning in 1998), Ontario Child Benefit (beginning in 2007) which integrates the Ontario child care supplement for working families (beginning in 1998), Saskatchewan Child Benefit (from 1998 to 2008), Newfoundland and Labrador Child Benefit (beginning in 1999), the Yukon Child Benefit (beginning in 1999), the Newfoundland and Labrador Seniors Benefit (beginning in 1999), the Saskatchewan Sales Tax Credit (beginning in 2000), the Nova Scotia one-time payment Taxpayer Refund Program (2003 only), the New Brunswick Low-Income Seniors Benefit (since 2005), the British Columbia Seniors Supplement (beginning with 2005), the Universal Child Care Benefit (beginning in 2006), the Alberta Resource Rebate (for 2006 only), the Ontario Home Electricity Relief (for 2006 only), the Newfoundland and Labrador Home Heating Rebate (beginning with 2007), the Nova Scotia Credit for Volunteer Fire-fighter (beginning with 2007), the New Brunswick Home Energy Assistance Program (for 2007 only), the Quebec Credit for Individuals Living in Northern Villages (beginning with 2007), the Quebec Sales Tax Credit (beginning in 2003), the Ontario Senior Homeowners Property Tax Grant (beginning with 2008), the Northern Ontario Energy Credit (beginning in 2010), the Ontario Energy and Property Tax Credit (beginning in 2010), the Ontario Child Activity Tax Credit (beginning in 2010), the Ontario Sales Tax Credit (beginning in 2003), the Ontario Sales Tax Transition Benefit (beginning in 2010), the Manitoba Child Tax Benefit (beginning in 2008), the Manitoba Education Property Tax Credit (beginning in 2001), the Manitoba School Tax Credit for Homeowner (beginning in 2003), the Manitoba Advanced Tuition Tax Rebate (beginning in 2010), the Saskatchewan Graduate retention Program tuition Rebate (beginning with 2008), the Saskatchewan Low-Income tax credit (beginning in 2008),the Saskatchewan Active Family Benefit (beginning in 2010), the British Columbia Climate Action Dividend (2008 only), the British Columbia Low Income Climate Action Tax Credit (beginning with 2009), the Yukon First Nations Tax Credit (beginning with 2008), and the Nunavut Volunteer Fire-fighter Credit (starting in 2008), the Nova Scotia Affordable Living Credit (beginning with 2010), the Nova Scotia Poverty Reduction Tax Credit (beginning with 2010), the Nunavut Cost of Living Tax Credit (beginning in 2003), the Working Income Tax Benefit (beginning in 2010) and the Quebec Solidarity Tax Credit (beginning in 2011).The individuals in this case receive these payments without providing goods or services in return. Previous to the 1996 data, Transfer payments also included superannuation and other (private) pensions.
Harmonized Sales Tax (HST)
In Newfoundland and Labrador, Nova Scotia and New Brunswick, the provincial sales tax has been harmonized with the goods and services tax (GST) since 1997, to become the harmonized sales tax. Ontario and British Columbia harmonized their provincial sales tax starting in 2010. For this reason, the federal GST credit is now known as the GST/HST credit.
Husband-Wife Family
Similar to the Couple family concept but excludes same-sex couples. For more information see Couple family.
Imputed Persons
Are persons who are not taxfilers, but are reported or otherwise identified by a taxfiler (for example, a non-filing spouse or child).
Income After Tax
Is total income minus provincial and federal income taxes plus Quebec Abatement.
Index
Is a comparison of the variable for the given area with either the province (province = 100) or with Canada (Canada = 100).
Interest Income
Refers to the amount Canadians claimed on line 121 of the personal income tax return. This amount includes interest generated from bank deposits, Canada Savings Bonds, corporate bonds, treasury bills, investment certificates, term deposits, annuities, mutual funds, earnings on life insurance policies and all foreign interest and foreign dividend incomes.
Investment Income
Includes both interest income and dividend income.
Labour Income
Includes income from employment and Employment Insurance benefits.
Level of Geography
Is a code designating the type of geographic area to which the information in the table applies. See the section on Geography for further information.
Limited Partnership Income
Is net income (i.e., gross income less expenses) from a limited partnership, where a limited partner is a passive or non-active partner whose liability as a member is limited to his or her investment. Included in "Other income" in the statistical tables.
Lone-Parent Family
Is a family with only one parent, male or female, and with at least one child. See also "Census families" and “Children”.
Low-Income Measure (LIM)
The Low-Income Measure is a relative measure of low income. LIMs are a fixed percentage (50%) of adjusted median family income where adjusted indicates a consideration of family needs. The family size adjustment used in calculating the Low-Income Measures reflects the precept that family needs increase with family size. For the LIM, each additional adult, first child (regardless of age) in a lone-parent family, or
child over 15 years of age, is assumed to increase the family’s needs by 40% of the needs of the first adult. Each child less than 16 years of age (other than the first child in a lone-parent family), is assumed to increase the family’s needs by 30% of the first adult. A family is considered to be low income when their income is below the Low-Income Measure (LIM) for their family type and size.
Manitoba Advanced Tuition Tax Rebate
Introduced in 2010 by the Province of Manitoba to assist post-secondary students claim an advanced credit against tuition fees payable for the school year up to November of the current tax year. Included in Provincial refundable tax credits/Family benefits in the statistical table
Manitoba Child Tax Benefit
Beginning in 2008, the Manitoba Child Benefit (MCB) is a provincial supplement program that replaces and enhances the Child Related Income Support Program. The MCB provides monthly benefits to low-income Manitoba families needing assistance with the cost of raising children. The MCB is part of Manitoba’s Rewarding Work strategy to help Manitobans move from income assistance to work. Under the MCB, maximum monthly benefits are available to families at higher income levels, and assets are no longer considered when calculating eligibility benefits. Included in Provincial refundable tax credits/Family benefits in the statistical tables.
Manitoba Education Property Tax Credit
Instituted in 2001 by the Province of Manitoba to assist all residents to offset some or all school tax component paid along with their property taxes. Included in Provincial refundable tax credits/Family benefits in the statistical tables.
Manitoba School Tax Credit For Homeowners
Introduced in 2003 by the Province of Manitoba to assist homeowners 55 years of age to receive an additional tax credit against property taxes paid. Included in Provincial refundable tax credits/Family benefits in the statistical table.
Median
Is the middle number in a group of numbers. Where a median income, for example, is given as $26,000, it means that exactly half of the incomes reported are greater than or equal to $26,000, and that the other half are less than or equal to the median amount. Median incomes in the data tables are rounded to the nearest hundred dollars and starting with 2007 to the nearest ten dollars. Zero values are not included in the calculation of medians for individuals, but are included in the calculation of medians for families.
Negative Income
Generally applies to net self-employment income, net rental income and net limited partnership income. Negative income would indicate that expenses exceeded gross income.
Net Federal Supplements
Are part of the Old Age Security (OAS) pension program, intended to supplement the income of pensioners and spouses with lower income; payments take the form of a Guaranteed Income Supplement (GIS) or a Spouse's Allowance (SPA). Between 1990 and 1993, net federal supplements were included in “non-taxable income”.
Net Rental Income
Is income received or earned from the rental of property, less related costs and expenses. Included in “Other income”.
New Brunswick Child Tax Benefit
Since 1997, the New Brunswick Child Tax Benefit (NBCTB) is a non-taxable amount paid monthly to qualifying families with children under the age of 18. The New Brunswick Working Income Supplement (NBWIS) is an additional benefit paid to qualifying families with earned income who have children under the age of 18. Benefits are combined with the CCTB into a single monthly payment. Included in Provincial refundable tax credits/Family benefits in the statistical tables.
New Brunswick Home Energy Assistance Program
Is a one-time payment of $100 made in 2007 to residents of New Brunswick to help low-income families cope with high electricity and energy prices. Included in Provincial refundable tax credits/Family benefits in the statistical tables of 2007 only.
New Brunswick Low Income Seniors Benefit
Since 2003, is a refundable credit available to assist low-income seniors in New Brunswick. The government offers a $400.00 annual benefit to qualifying applicants.
Newfoundland and Labrador Child Benefit
Beginning in 1999, the Newfoundland and Labrador Child Benefit (NLCB) is a non-taxable amount paid monthly to help low-income families with the cost of raising children under the age of 18. The Mother Baby Nutrition Supplement (MBNS) is an additional benefit paid to qualifying families who have children under the age of one. In addition, The Mother Child Benefit Supplement (MCBS) is a one-time payment made at the time of birth for each child. In 2008 the Newfoundland and Labrador introduced two additional parental benefits known as Progressive Family Growth Benefit (PFGB) and the Parental Support Benefit (PSB). Starting in 2011, there is a new, non refundable, Child Care Credit amount equal to child care expenses currently deductible from income. Benefits are combined with the CCTB into a single monthly payment. Included in Provincial refundable tax credits/Family benefits in the statistical tables.
Newfoundland and Labrador Home Heating Rebate
Beginning in 2007, the Newfoundland and Labrador Home Heating Rebate is an amount available to individuals and families with a household income of $30,000 or less regardless of whether they heat their homes by home heating fuel, electricity or wood. Included in Provincial refundable tax credits/Family benefits in the statistical tables.
Newfoundland and Labrador Seniors Benefit
The Newfoundland Seniors' Benefit (NSB) was announced in Newfoundland & Labrador’s 1999 budget. It is a supplement to the HST credit.
If the tax filer and/or the tax filer’s partner were 65 or older at any time in the year, and they have applied for GST credit on their federal return, they may receive a payment per year.
To receive the credit, the tax filer/or the tax filer’s partner has to apply for the GST/HST credit. Benefits are then combined with the October payment of the federal GST/HST credit. Included in Provincial refundable tax credits/Family benefits in the statistical tables.
Non-Family Person
See Persons not in Census Families
Non-Negative Income
Is income that is zero or greater.
Non-Taxable Income/Provincial (refundable) Tax Credits
Non-taxable income refers to the amounts included in a taxfiler's income when applying for refundable tax credits, but not included in the calculation of taxable income; these amounts include workers' compensation payments, net federal supplements received (Guaranteed Income Supplements and/or Spouse's Allowance), and social assistance payments. Beginning with the 1994 data, information is available separately for net federal supplements, workers' compensation and social assistance. Provincial tax credits are a refundable credit paid to individuals by the province in which he or she resided as of December 31 of the taxation year. See also Provincial refundable tax credits.
Northern Ontario Energy Credit
Beginning in 2010, the Province of Ontario introduced the Northern Ontario Energy Credit for residents of these Northern Ontario districts: Algoma, Cochrane, Kenora, Manitoulin, Nipissing, Parry Sound, Rainy River, Sudbury, Thunder Bay or Timiskaming who pay rent or property tax on their principle residents and who apply for the credit.
Included in Provincial refundable tax credits/Family benefits in the statistical tables.
Northwest Territories Child Benefit
Beginning in July 1998, the Northwest Territories Child Benefit (NWTCB) is a non-taxable amount paid monthly to qualifying families with children under age 18. The Territorial Worker's Supplement, part of the NWTCB program, is an additional benefit paid to qualifying families with working income who have children under age 18. Benefits are combined with the CCTB into a single monthly payment. Included in Provincial refundable tax credits/Family benefits in the statistical tables.
Nova Scotia Affordable Living Tax Credit
Beginning in 2010, with the Harmonized Sales Tax increase, households with low and modest incomes will receive a quarterly tax credit to offset the restoration of the Harmonized Sales Tax. Included in Provincial refundable tax credits/Family benefits in the statistical tables.
Nova Scotia Child Tax Benefit
Beginning in October 1998, but retro-active to July 1998, the Nova Scotia Child Benefit (NSCB) is a non-taxable amount paid monthly to help low- and modest-income families with the costs of raising children under the age of 18. Benefits are combined with the CCTB into a single monthly payment. Included in Provincial refundable tax credits/Family benefits in the statistical tables.
Nova Scotia Credit for Volunteer Firefighters
Beginning in 2007, this credit is made to residents of Nova Scotia who have been volunteer firefighters for a minimum of six months in the calendar year. Included in Provincial refundable tax credits/Family benefits in the statistical tables.
Nova Scotia Poverty Reduction Tax Credit
Beginning in 2010, the Poverty Reduction Credit provides tax-free payments to help about 15,000 low-income residents who are in receipt of social assistance. Included in Provincial refundable tax credits/Family benefits in the statistical tables.
Nova Scotia Taxpayer Refund Program
Is a one-time payment of $155 made in 2003 to residents of Nova Scotia who paid $1 or more in provincial income tax. The refund is part of the government’s commitment to lower taxes in the province. Included in 2003 data only.
Nunavut Child Benefit
Beginning in July 1998, the Nunavut Child Benefit (NUCB) is a non-taxable amount paid monthly to qualifying families with children under age 18. The Territorial Worker's Supplement, part of the NUCB program, is an additional benefit paid to qualifying families with working income who have children under age 18. Benefits are combined with the CCTB into a single monthly payment. Included in Provincial refundable tax credits/Family benefits in the statistical tables.
Nunavut Cost of Living Credit
Beginning in 1999, when Nunavut was carved out of the Northwest Territories, it inherited this unique refundable cost of living credit for residents of Nunavut who qualify. Included in Provincial refundable tax credits/Family benefits in the statistical tables.
Nunavut Volunteer Fire-Fighter Credit
Beginning in 2008, the Volunteer Fire Fighter tax credit is allowed to residents of Nunavut who were volunteer fire fighter for a minimum of six months during the year. Included in Provincial refundable tax credits/Family benefits in the statistical tables.
Old Age Security (OAS) Pension
Is part of the Old Age Security program, a federal government program that guarantees a degree of financial security to Canadian seniors. All persons in Canada aged 65 or older, who are Canadian citizens or legal residents, may qualify for a full OAS pension, depending on their years of residence in Canada after reaching age 18. Old Age Security benefits include all benefits reported for the reference year, excluding Guaranteed Income Supplements and Spouse’s Allowance benefits; see also "Net Federal Supplements" and "Non-Taxable Income/Provincial (refundable) Tax Credits". Starting with the 1994 data, OAS income of non-filing spouses was estimated and included in the tables.
Ontario Child Activity Tax Credit
Introduced in 2010, the Province of Ontario to assist residents with the cost of registering their children (under the age of 19) in eligible activities as defined by the Province.
Included in Provincial refundable tax credits/Family benefits in the statistical tables.
Ontario Child Benefit Program Formerly Ontario Child Care Supplement for Working Families
Effective in July 2007, the Ontario Child Benefit is integrating its Ontario Child Care Supplement program with its basic social assistance benefits for children. It is intended to be completely integrated with the federal child tax benefit program. The Ontario Child Care Supplement for Working Families (OCCSWF) is a tax-free monthly payment to help with the cost of raising children under the age of seven. Benefits are combined with the CCTB into a single monthly payment. Included in Provincial refundable tax credits/Family benefits in the statistical tables.
Ontario Energy and Property Tax Credit
Introduced in 2010, the Ontario Energy and Property Tax Credit helps low- to moderate-income individuals 18 years of age and older, and families, with the sales tax they pay on energy and with property taxes. Included in provincial refundable tax credits/Family Benefits in the statistical tables.
Ontario Home Electricity Relief
Was a one-time payment of $120 made in 2006 to lower-income residents of Ontario to assist them with the rising cost of electricity. Included in Provincial refundable tax credits/Family benefits in the statistical tables.
Ontario Sales Tax Credit
Introduced in 2010, the Ontario Sales Tax Credit helps low- to moderate-income individuals, 19 years of age and older, and families, with the sales tax they pay. Included in provincial refundable tax credits/Family Benefits in the statistical tables.
Ontario Senior Homeowners Property Tax Grant
Beginning in 2008, this grant is an annual amount provided to help offset property taxes for seniors with low and moderate incomes who own their own homes. Included in Provincial refundable tax credits/Family benefits in the statistical tables.
Ontario Sales Tax Transition Credit
Introduced in 2010, this benefit provides three payments to families and single people to help with the transition to the HST. Families (including single parents) can receive up to $1,000 in total. If the person is single, he or she can get up to $300 in total. The first benefit payment and the second benefit payment were paid in June and December 2010. The final benefit payment was paid in June 2011. Included in provincial refundable tax credits/Family Benefits in the statistical tables.
Other Government Transfers
Added in 2010. Currently only includes the Working Income Tax Benefit (WITB).
Other Income
Includes net rental income, alimony, income from a limited partnership, retiring allowances, scholarships, amounts received through a supplementary unemployment benefit plan (guaranteed annual income plan), payments from income‑averaging annuity contracts, as well as all other taxable income not included elsewhere. Beginning with the 1992 data, this variable also includes the imputed income of imputed spouses, as derived from the tax return of the filing spouse. Beginning with the 2008 data, this variable also includes the registered disability savings plan income. See also "Total income".
Parent
Is a person for whom we have identified one or more children living at the same address. See also "Census families" and “Children”.
Parental Support Benefit (PSB)
Is a monthly benefit available to residents of the province of Newfoundland and Labrador for the 12 months after the child’s birth or the 12 months after the adopted child is place in the home on or after January 1st 2008
Participation Rate
Is the count of a given population of an area with labour income expressed as a percentage of the total for that same population in that same area.
Persons not in Census Families Previously Non-Family Persons
Is an individual who is not part of a census family – couple family or a lone-parent family. These persons may live with their married children or with their children who have children of their own (e.g., grandparent). They may be living with a family to whom they are related (e.g., sibling, cousin) or unrelated (e.g., lodger, roommate). They may also be living alone or with other persons not in census families. See also "Census families".
Private (other) Pensions
Include pension benefits (superannuation and private pensions) other than Old Age Security pension benefits and Canada/Quebec Pension Plan benefits.
Progressive Family Growth Benefit (PFGB)
Is a $1,000 lump-sum payment to residents of the province of Newfoundland and Labrador who give birth to a baby or have a child placed with them for adoption on or after January 1st 2008.
Provincial Refundable Tax Credits/Family Benefits
Unlike non-refundable tax credits, these amounts are paid to the taxfiler, regardless of tax liability. Included are the refundable provincial tax credits received by taxfilers in Manitoba, Ontario, Quebec and Saskatchewan (since 1990), British Columbia and the Northwest Territories (since 1993), Newfoundland and Labrador and Nunavut (beginning in 1997), FST credit (in 1989 and 1990), GST credit (which began replacing the FST credit in 1990 and completely replaced it by 1991, and became the GST/HST credit starting in 1997), Quebec child assistance payment (beginning in 2005) which replaced the Quebec Family allowances (the latter were in place from 1994 to 2004), British Columbia Family Bonus (beginning in 1996), New Brunswick Child Tax Benefit (beginning in 1997), Alberta Family Employment Tax Credit (beginning in 1997), Northwest Territories Child Benefit (beginning in 1998), Nova Scotia Child Tax Benefit (beginning in 1998), Nunavut Child Benefit (beginning in 1998), Ontario Child Care Supplement for Working Families (commenced in 1998), replaced with Ontario Child Benefit program (OCB) in July 2007 which combines the former OCCS payment with basic social assistance benefit payments for children, renamed ( 2008) Ontario Child care Benefit Supplement (OCCS),Saskatchewan Child Benefit (from 1998 to 2006), Newfoundland and Labrador Child Benefit (beginning in 1999) which includes the Mother Baby Nutrition Supplement (MBNS) beginning in 2002, the Mother Child Benefit Supplement (2004) and the Progressive Family growth benefit (PFGB) (starting in 2008) and the Parental Support Benefit (PSB) (beginning in 2008), the Yukon Child Benefit (beginning in 1999), the Newfoundland and Labrador Seniors Benefit (beginning in 1999), the Saskatchewan Sales Tax Credit (beginning in 2000), the Nova Scotia one-time payment Taxpayer Refund Program (2003 only), the New Brunswick Low-Income Seniors Benefit (since 2005), the British Columbia Seniors Supplement (beginning with 2005), the Universal Child Care Benefit (beginning in 2006), the Alberta Resource Rebate (for 2006 only), the Ontario Home Electricity Relief (for 2006 only), the Newfoundland and Labrador Home Heating Rebate (beginning with 2007), the Nova Scotia Credit for Volunteer Fire-fighter (beginning with 2007), the New Brunswick Home Energy Assistance Program (for 2007 only), the Quebec Credit for Individuals Living in Northern Villages (beginning with 2007), the Quebec Sales Tax Credit (beginning in 2003), the Ontario Senior Homeowners Property Tax Grant (beginning with 2008), the Northern Ontario Energy Credit (beginning in 2010), the Ontario Energy and Property Tax Credit (beginning in 2010), the Ontario Child Activity Tax Credit (beginning in 2010), the Ontario Sales Tax Credit (beginning in 2003), the Ontario Sales Tax Transition Benefit (beginning in 2010), the Manitoba Child Tax Benefit (beginning in 2008), the Manitoba Education Property Tax Credit (beginning in 2001), the Manitoba School Tax Credit for Homeowner (beginning in 2003), the Manitoba Advanced Tuition Tax Rebate (beginning in 2010), the Saskatchewan Graduate retention Program tuition Rebate (beginning in 2008), the Saskatchewan Low-Income tax credit (beginning in 2008), the Saskatchewan Active Family Benefit (beginning in 2010), the British Columbia Climate Action Dividend (for 2008 only), the British Columbia Low Income Climate Action Tax Credit (beginning with 2009), the Yukon First Nations Tax Credit (beginning with 2008), and the Nunavut Volunteer Fire-fighter Credit (starting in 2008), the Nova Scotia Affordable Living Credit (beginning with 2010), the Nova Scotia Poverty Reduction Tax Credit (beginning with 2010), the Nunavut Cost of Living Tax Credit (beginning in 2003) and the Quebec Solidarity Tax Credit (beginning in 2011).The individuals in this case receive these payments without providing goods or services in return.
Quebec Child Assistance Payment Previously Quebec Family Allowance
The Régie des rentes du Québec administers the child assistance payment program that is part of Québec's family policy. This program provides for the payment of a family allowance intended to cover the basic needs of children under age 18 in low-income families. This payment adds to the Canada Child Tax Benefit paid by the federal government. In 2005, the Child Assistance Payment program replaced the Quebec Family Allowance which was in place from 1994 to 2004. Available starting with 1994 data. Included in Provincial refundable tax credits/Family benefits in the statistical tables.
Quebec Credit for Individuals Living in Northern Villages
Beginning in 2007, this credit is for residents of a northern village as defined by the Quebec Government. It consists of a monthly payment for each of the spouses plus an additional amount per month for each dependent child. Included in Provincial refundable tax credits/Family benefits in the statistical tables.
Quebec Family Allowance
See Quebec Child Assistance Payment
Quebec Sales Tax Credit
Beginning in 2003, the Province of Quebec instituted The Sales Tax Credit to assist low income residents who pay the Quebec Sales Tax. Included in Provincial refundable tax credits/Family benefits in the statistical tables.
Quebec Solidarity Tax Credit
On July 1, 2011, the solidarity tax credit took effect, thereby replacing the QST credit, the property tax refund and the credit for individuals living in northern villages. Included in provincial refundable tax credits/Family Benefits in the statistical tables.
Registered Disability Savings Plan (RDSP) Income
Beginning in 2008, the RDSP is for individuals for whom a valid disability certificate has been filed. Contributions can be made by the beneficiary or by qualified persons legally authorized to act for the beneficiary. The contributions are not deductible but the income earned is not taxable as long as it remains into the plan. Contributions are subject to a lifetime limit of $200,000; they will be matched in some degree by government contributions. Included in Other income in the statistical tables.
Registered Retirement Savings Plan Income (RRSP)
Is any money withdrawn from a RRSP, either as a lump sum or as a periodic payment. Included in this amount are withdrawals and monies from RRSP annuities. Note that monies from a Registered Retirement Income Fund (RRIF) may be reported on line 115 (other pensions or superannuation) if the recipient is 65 years of age or older; otherwise, monies from a RRIF are reported on line 130 (other income). Information on RRSP income is available starting with the 1994 data. Starting in 1999, only RRSP income of persons aged 65 years or older is included.
Saskatchewan Active Family Benefit
Beginning in 2009, the Province of Saskatchewan provides a refundable tax credit for eligible expenses for children for cultural, recreational, or sports activities. Included in Provincial refundable tax credits/Family benefits in the statistical tables.
Saskatchewan Child Benefit
Beginning in July 1998, the Saskatchewan Child Benefit (SCB) is a non-taxable amount paid monthly to help lower-income families with the cost of raising children under age of 18. Benefits are combined with the CCTB into a single monthly payment. Included in Provincial refundable tax credits/Family benefits in the statistical tables. This program was terminated in 2008.
Saskatchewan Graduate Retention Program Tuition Rebate
The Graduate Retention Program rewards students in Saskatchewan by providing a refund up to $20,000 of fees paid by eligible graduates who live in Saskatchewan and who file a Saskatchewan income tax return. The Graduate Retention Program became effective January 1, 2008. Included in provincial refundable tax credits/Family Benefits in the statistical tables.
Saskatchewan Low-Income Tax Credit
The Government replaced and enhanced the provincial Sales Tax Credit with a new Low-Income Tax Credit, effective July 2008, to reduce the taxes of lower income provincial residents. The credit is fully refundable, meaning that a person does not have to pay income tax in order to receive the benefits. A recipient must file an income tax return as a resident of Saskatchewan and meet income and family criteria to be eligible for benefits. Included in provincial refundable tax credits/Family Benefits in the statistical tables.
Saskatchewan Sales Tax Credit
Introduced in 2000, this credit is aimed at offsetting the effects of sales tax on lower income earners in Saskatchewan. It is a program designed to improve the fairness of the provincial sales tax for low-income Saskatchewan residents. Eligibility for the Saskatchewan Sales Tax credit is identical to federal GST credit requirements, and application for the SSTC credit is automatic if you apply for federal GST credit and are resident in Saskatchewan as of December 31 of the base year. The SSTC is calculated on the current tax year and the credit will be paid in October of the year following the due date of your return. The SSTC credit is combined with the payment of the federal GST/HST credit and paid in full. Included in Provincial refundable tax credits/Family benefits in the statistical tables.
Self-Employment Income
Is net income from business, professional, commission, farming and fishing.
Single-Earner Family
Is defined, in couple families, as only one of the partners having employment income greater than zero or, in lone-parent families, as the parent with employment income greater than zero.
Social Assistance
Includes payments made in the year on the basis of a means, needs or income test (whether made by an organized charity or under a government program). The value is reported on line 145 of the personal income tax return. Available only since 1994; previously included in "Non-taxable income".
Spouse
Is either partner in a couple family.
Suppressed Data
Are intentionally omitted because they breach confidentiality. All data counts under a certain number are suppressed along with the corresponding income amounts. If the count for one cell or component is suppressed, then corresponding income aggregates in another cell are also suppressed to avoid disclosure by subtraction (called residual disclosure). See the section on Confidentiality.
Taxfilers
Most taxfilers are people who filed a tax return for the reference year and were alive at the end of the year. Starting with the 1993 tax year, those taxfilers who died within the tax year and who had a non-filing spouse had their income and their filing status attributed to the surviving spouse.
Total Income
Note: this variable was revised over the years, as reflected in the comments below; data users who plan to compare current data to data from previous years should bear in mind these changes. Also, it should be noted that all income amounts are gross, with the exception of net rental income, net limited partnership income and all forms of net self-employment income.
Income reported by tax filers from any of the following sources:
- Labour income
- Employment income
- Wages/salaries/commissions
- Other employment income as reported on line 104 of the tax form (tips, gratuities, royalties, etc.)
- Net self-employment
- Indian Employment Income (new in 1999)
- Employment insurance (EI) benefits
- Employment income
- Pension income
- Old Age Security pension benefits/net federal supplements (the latter including guaranteed income supplements and spouses' allowances since 1994)
- Canada/Quebec Pension Plan benefits
- Superannuation and other (private) pensions
- Federal Family Allowance benefits (up to and including 1992)
- Quebec Family Allowance (from 1994 to 2004)
- Quebec Child Support Payment (beginning with 2005)
- British Columbia Family Bonus (beginning with 1996)
- New Brunswick Child Benefit Supplement (beginning with 1997)
- Alberta Family Employment Tax Credit (beginning with 1997)
- Northwest Territories Child Benefit (beginning with 1998)
- Nova Scotia Child Tax Benefit (beginning with 1998)
- Nunavut Child Benefit (beginning with 1998)
- Ontario Child Benefit (beginning 2007) which integrates the Ontario Child Care Supplement for Working Families (beginning with 1998)
- Saskatchewan Child Benefit (from 1998 to 2008)
- Newfoundland and Labrador Child Benefit (beginning with 1999)
- Yukon Child Benefit (beginning with 1999)
- Interest and other investment income
- Dividend income
- RRSP income (since 1994; previously in "other income" / since 1999; only tax filers 65+)
- Net limited partnership income (included in "other income")
- Alimony (included in "other income")
- Net rental income (included in "other income")
- Income for non-filing spouses (since 1992; included in "other income")
- Other incomes as reported on line 130 of the tax form (fellowships, bursaries, grants, registered disability savings plan (since 2008), etc.; included in "other income")
- Federal sales tax (FST) credit (for 1989-1990 inclusive)
- Goods and services tax (GST) credit (beginning in 1990)
- Harmonized sales tax (HST) credit (beginning in 1997)
- Child tax credit (up to and including 1992)
- Canada Child Tax Benefit (starting with 1993) and Universal Child Care Benefit (beginning in 2006)
- Manitoba Child Tax Benefit (beginning in 2008)
- Other non-taxable income (since 1990)
- Workers' compensation payments (shown separately starting with 1994)
- Social assistance payments (shown separately starting with 1994)
- Guaranteed income supplements (included with net federal supplements since 1994; previously in "non-taxable income")
- Spouses' allowances (included with net federal supplements since 1994; previously in "non-taxable income")
- Provincial refundable tax credits in Manitoba, Ontario, Quebec and Saskatchewan (since 1990), British Columbia and the Northwest Territories (since 1993), Newfoundland and Labrador, and Nunavut (since 1997), the Nova Scotia one-time payment Taxpayer Refund Program (2003 only), the New Brunswick Low-Income Seniors Benefit (since 2005), the Universal Child Care Benefit (beginning in 2006), the Alberta Resource Rebate (for 2006 only), the Ontario Home Electricity Relief (for 2006 only), the Newfoundland and Labrador Home Heating Rebate (beginning with 2007), the Nova Scotia Credit for Volunteer Fire-fighter (beginning with 2007), the New Brunswick Home Energy Assistance Program (for 2007 only) and the Quebec Credit for Individuals Living in Northern Villages (beginning with 2007), the Ontario Senior Homeowners Property Tax Grant (beginning with 2008), the Manitoba Child Tax Benefit (beginning in 2008), the Saskatchewan Educational Rebate (beginning with 2008), the British Columbia Climate Action Dividend ( 2008 only), the Yukon First Nations Tax Credit (beginning with 2008) and the Nunavut Volunteer Fire-fighter Credit (starting in 2008). ), the Alberta Family Employment Tax Credit (beginning in 1997), the Newfoundland and Labrador Seniors’ Benefit (beginning in 1999), the Saskatchewan Sales Tax Credit (beginning in 2000), the British Columbia Seniors’ Supplement (beginning in 2005), the Quebec Sales Tax Credit (beginning in 2003), the Northern Ontario Energy Credit (beginning in 2010), the Ontario Energy and Property Tax Credit (beginning in 2010), the Ontario Child Activity Tax Credit (beginning in 2010), the Ontario Sales Tax Credit (beginning in 2003), the Ontario Sales Tax Transition Benefit (beginning in 2010), the Manitoba Education Property Tax Credit (beginning in 2003), the Manitoba School Tax Credit for Homeowners (beginning in 2003), the Manitoba Advanced Tuition Tax Rebate (beginning in 2010), the Saskatchewan Low-Income tax credit (beginning in 2008),the Saskatchewan Graduate Retention Program Tuition Rebate (beginning in 2008), the Saskatchewan Active Family Benefit (beginning in 2010), the British Columbia Low Income Climate Action Tax Credit (beginning in 2009),the Nova Scotia Affordable Living Credit (beginning in 2010), the Nova Scotia Poverty Reduction Tax Credit (beginning in 2010), the Nunavut Cost of Living Tax Credit (beginning in 2003), the Working Income Tax Benefit (starting in 2010) and the Quebec Solidarity Tax Credit (beginning in 2011).
Monies not included in income above are: veterans' disability and dependent pensioners' payments, war veterans' allowances, lottery winnings and capital gains.
Unemployment Insurance (UI)
See Employment Insurance (EI)
Universal Child Care Benefit
Beginning in July 2006, the Universal Child Care Benefit (UCCB) is a taxable amount of $100 paid monthly for each child under 6 years of age. Included in Canada Child Tax Benefits in the statistical tables.
User-Defined Areas
Are areas that have been defined by the data users as the specific area for which they require data. The smallest "building block" for these special areas is the six-character postal code. To obtain data, provide us with a list of the postal codes for which data are required and we will provide the aggregated data. Also, the user-defined area may be a total of a number of individual standard areas, grouped together for a total, rather than a number of individual areas each with their own total. Of course, the area must satisfy our confidentiality requirements, or no data can be produced. See section on Geography.
Wages, Salaries and Commissions
Include employment pay and commissions as stated on T4 information slips, training allowances, tips, gratuities and royalties. Starting with the 1999 data, the total of wages, salaries and commissions includes tax-exempt employment income earned on an Indian reserve. Starting with the 2001 data, wage and salary income of non-filing spouses was identified, in some cases, from T4 earnings statements.
Workers' Compensation
Includes any compensation received under Workers' Compensation in respect of an injury, disability or death. This value is reported on line 144 of the personal income tax return. Information on Workers' Compensation is available as a distinct income source starting with the 1994 data; previously included in "Non-taxable Income".
Working Income Tax Benefit
An incentive for the working poor to keep working instead of depending solely on other types of government assistance (hence it is viewed as a government transfer).
The tax filer can claim the Working Income Tax Benefit (WITB) if he or she meets all of the following conditions in 2009:
- He or she was a resident of Canada throughout the year;
- He or she earned income from employment or business;
- At the end of the year, he or she was 19 years of age or older, or he or she had an eligible spouse, or you had an eligible dependant.
In addition, the tax filer working income must be greater than $3,000 to claim the basic WITB and greater than $1,150 to claim the WITB disability supplement. Included in Other Government Transfers in the statistical tables.
Yukon Child Benefit
Beginning in 1999, the Yukon Child Benefit (YCB) is a non-taxable amount paid monthly to help low- and modest-income families with the cost of raising children under the age of 18. Benefits are combined with the CCTB into a single monthly payment. Included in Provincial refundable tax credits/Family benefits in the statistical tables.
Yukon First Nations Tax Credit
Beginning in 2008, the Yukon First Nations Tax Credit provides that both the Government of Canada and the Government of Yukon will share the field of personal income tax with self-governing Yukon First Nations. It is for individuals residing on the settlement lands of the self-governing First Nations. The transferred amount is referred to as Yukon First Nations Tax that consists of a federal abatement and a Yukon First Nations income tax credit. Included in Provincial refundable tax credits/Family benefits in the statistical tables.
Section 4 — Geography
The data are available for the following geographic areas. See "Statistical Tables - Footnotes and Historical Availability" for further details. The mailing address at the time of filing is the basis for the geographic information in the tables.
Standard areas:
Canada
Provinces and Territories
Postal Geography
- City Totals
- Urban Forward Sortation Areas (excludes Rural Routes and Suburban Services, and Other Urban Areas within City)
- Postal Walks*
- Other Postal Walks*
- Suburban Services*
- Rural Routes (Within City)*
- Rural Postal Code Areas (Within City)
- Other Urban Areas (Non-residential within city)
- Rural Communities (not in City)
- Other Provincial Totals
*These postal geography levels were available in the past but are no longer available for this data.
Census Geography
- Economic Regions
- Census Divisions
- Census Metropolitan Areas
- Census Agglomerations
- Census Tracts
- Federal Electoral Districts (2003 Representation Order)
User-defined areas:
Users may select a specific area of interest that is not a standard area for which data can be made available in standard format. To obtain data, provide us with a list of the Postal Codes for which data are required and we will provide the aggregated data. Of course, the area must satisfy our confidentiality requirements, or no data can be produced. See the "Special Geography" section for further information.
Geographic Levels – Postal Geography
The various data compiled from the taxfile are available for different levels of the postal geography, and for some levels of the Census geography. Coded geographic indicators appearing on the data tables are shown below with a brief description.
| Level of Geography (L.O.G.) |
Postal Area | Description |
|---|---|---|
| 12 | Canada | This level of data is an aggregation of the provincial/territorial totals (code 11). The national total is identified by the region code Z99099. |
| 11 | Province or Territory Total | This level of data is an aggregation of the following geographies within a province: City Totals = Code 08 Rural Communities = Code 09 Other Provincial Totals = Code 10 These totals are identified by a provincial/territorial postal letter, then a "990" followed by the province/territory code, as follows: Newfoundland and Labrador = A99010 Nova Scotia = B99012 Prince Edward Island = C99011 New Brunswick = E99013 Quebec = J99024 Ontario = P99035 Manitoba = R99046 Saskatchewan = S99047 Alberta = T99048 British Columbia = V99059 Northwest Territories = X99061 Nunavut = X99062 Yukon Territory = Y99060 |
| 10 | Other Provincial Total ("P" Pot) |
This level of data is an aggregation of small communities in the province that had less than 100 taxfilers, where these communities are combined into a "pot". Before 1992, it was identified by the same codes as the provincial/territorial totals, and only the "Delivery Mode" codes 2 and 3 distinguished between the two. To avoid this problem, starting with the 1992 data, an "8" appears after the provincial/territorial letter instead of a "9". The "9" will be reserved for the provincial/territorial total, as explained in 11 above. These "pot" codes are as follows: Newfoundland and Labrador = A89010 Nova Scotia = B89012 Prince Edward Island = C89011 New Brunswick = E89013 Quebec = J89024 Ontario = P89035 Manitoba = R89046 Saskatchewan = S89047 Alberta = T89048 British Columbia = V89059 Northwest Territories = X89061 Nunavut = X89062 Yukon Territory = Y89060 |
| 09 | Rural Communities (Not in City ) |
For data obtained prior to reference year 2011, this level of geography was called “Rural Postal Codes (Not in a City)”. This level of geography pertains to rural communities that have one and only one rural Postal Code. Rural Postal Codes can be identified by a "zero" in the second position of the Postal Code. For this level of geography, only the name of the community appears with the disseminated data. The actual rural Postal Code is not displayed with the disseminated data. The 2011 databanks contain 4,010 areas coded as level of geography 09. |
| 08 | City Total | This level of data is an aggregation of the following geographies for unique place names within a province/territory: Urban FSA (Residential) = Code 03 Rural Route = Code 04 Suburban Services = Code 05 Rural Postal Code Areas (within city) = Code 06 Other Urban Area = Code 07 As of 2011, data for L.O.G. 04 and 05 are suppressed but included in the city totals. They have the following format: e.g., Edmonton = T95479; Regina = S94876. The pattern is the postal letter of the city plus "9" in the second position (indicating a total), followed by a 4 digit numeric code for the community (often called "CityID"). In general, postal cities do not coincide exactly with census subdivisions. The 2011 databanks contain 1,655 areas coded as level of geography 08. |
| 07 | Other Urban Area (Non-residential within city - "E" Pot) |
This aggregation of data (or "pot") covers non-residential addresses within an urban centre and all other data not otherwise displayed. Commercial addresses, post office boxes and general delivery are included, as are residential addresses with too few taxfilers to report separately. They can be recognized by codes that are similar to the city totals, with a distinguishing difference: an "8" will follow the city postal letter rather than the "9" of the city total (e.g., Edmonton = T85479; Regina = S84876). The 2011 databanks contain 452 areas coded as level of geography 07. |
| 06 | Rural Postal Code Areas (Within City) | For data obtained prior to reference year 2011, this level of geography was called “Rural Postal Codes (Within a City)”. These data pertain to rural Postal Codes that belong to communities with more than one rural Postal Code. These occur in areas that were formerly serviced by rural delivery service and changed by Canada Post to urban delivery service or in communities served by more than one rural Postal Code. Rural Postal Codes can be identified by a "zero" in the second position of the Postal Code. Although data is disseminated individually for each rural Postal Code associated with a community, only the community name appears with the disseminated data. The actual rural Postal Codes are not displayed with the disseminated data. Therefore, for this level of geography, community names will appear more than once. The 2011 databanks contain 561 areas coded as level of geography 06. |
| 05 | Suburban Service | No longer available. Sparsely populated fringe areas of urban centres may receive their postal service from an urban post office by delivery designated as "suburban service". Their region code retains all six characters of the Postal Code. Suburban Services are usually near or on the perimeters of urban areas, and mail is delivered by a contractor to group mail boxes, community mail boxes and/or external delivery sites (e.g., kiosks, miniparks). |
| 04 | Rural Route | No longer available. Reasonably well-settled rural areas may receive their postal service from an urban post office by delivery designated as "rural route". Mail is delivered by a contractor to customers living along or near well-defined roads. Their region code retains all six characters of the Postal Code. |
| 03 | Urban FSA (Residential Area) |
The urban Forward Sortation Area (FSA, identified by the first three characters of the Postal Code) includes all residential addresses covered by the first three characters of a Postal Code in a particular urban area (not including levels 04 and 05). Only residential FSAs are considered for these databanks. An Urban FSA of this type can be identified by the FSA followed by three blanks. One FSA can be split in different parts if it is associated with more than one city. The 2011 databanks contain 2,451 areas coded as level of geography 03. |
| 02 | Other Postal Walk |
No longer available. This level of data is an aggregation of urban residential Postal Codes unallocated to a letter carrier route and postal walks with less than 100 taxfilers. A postal walk record of this type can be identified by the FSA followed by three blanks, and the postal walk number "XXXX". |
| 01 | Postal Walk | No longer available. This is the finest level of data and is an aggregation of urban residential Postal Codes allocated to a letter carrier route. A postal walk of this type can be identified by a region code which is the FSA followed by three blanks, and the postal walk number. An average FSA contains 11 walks. |
Adding postal areas without duplication
Data files according to the postal geography will often contain subtotals and totals. Many data users need to add certain geographies in order to come up with a total for their particular area of interest. However, including subtotals during this process results in double-counting some populations, and this leads to an erroneous total. The following is a summary of which postal areas are aggregations in the standard postal geography.
Postal Walks (Level of Geography, or LOG 1) and Walk Pots (LOG 2) add up to Urban Forward Sortation Areas (FSAs, LOG 3).
Urban FSAs (LOG 3), Rural Routes (LOG 4), Suburban Services (LOG 5), Rural Postal Code areas within a city (LOG 6) and Other Urban Areas (LOG 7) add up to City Totals (LOG 8).
City Totals (LOG 8), Rural Communities not in a city (LOG 9) and Other Provincial Totals (LOG 10) add up to provincial/territorial totals (LOG 11).
Provincial/territorial totals (LOG 11) add up to the Canada total (LOG 12).
Thus, using the Level of geography codes:
1 + 2 = 3
3 + 4 + 5 + 6 + 7 = 8
8 + 9 + 10 = 11
City identification number (CityID)
As of 2007, CityID has been modified.
Previous to 2007:
- CityID was a 4 digits number
- Each municipality had a unique number between 1 and 9999
- Almost every number was allocated to a municipality. Few numbers remained available for future new municipalities.
Starting with 2007 data:
To create more possibilities without changing the CityID length in our systems:
- CityID number is now combined with 1st letter of Postal Code
- Each 1st letter of Postal Code has a possibility of numbers, ranged from 1 to 9999 (Table I)
- Old numbers have been kept for existing municipality and 1st letters of Postal Code have been added to them (Table H)
- New municipalities have been assigned a new CityID number in new format (Table H)
| Postal Code | Municipality name | 2006 and Prior | 2007 and Follow |
|---|---|---|---|
| K1A xxx | Ottawa | 2434 | K2434 |
| G3C xxx | Stoneham-et-Tewkesbury | n/a | G2 |
| Province | Letter file | Range of number |
|---|---|---|
| Newfoundland & Labrador | A | 1 – 9999 |
| Prince Edward Island | C | 1 – 9999 |
| Nova Scotia | B | 1 – 9999 |
| New Brunswick | E | 1 – 9999 |
| Quebec | G | 1 – 9999 |
| Quebec | H | 1 – 9999 |
| Quebec | J | 1 – 9999 |
| Ontario | K | 1 – 9999 |
| Ontario | L | 1 – 9999 |
| Ontario | M | 1 – 9999 |
| Ontario | N | 1 – 9999 |
| Ontario | P | 1 – 9999 |
| Manitoba | R | 1 – 9999 |
| Saskatchewan | S | 1 – 9999 |
| Alberta | T | 1 – 9999 |
| British Columbia | V | 1 – 9999 |
| Yukon | Y | 1 – 9999 |
| Northwest Territories | X | 1 – 9999 |
| Nunavut | X | 1 – 9999 |
Therefore, it is now essential to identify a municipality by adding the Postal Code 1st letter to the number in order to get the proper municipality in the proper province (Table J):
| Letter | Number | Municipality name | Province |
|---|---|---|---|
| A | 2 | Avondale | NL |
| B | 2 | Bible Hill | NS |
| T | 2 | Rocky View | AB |
| G | 2 | Stoneham-et-Tewkesbury | QC |
Hierarchy of postal geography
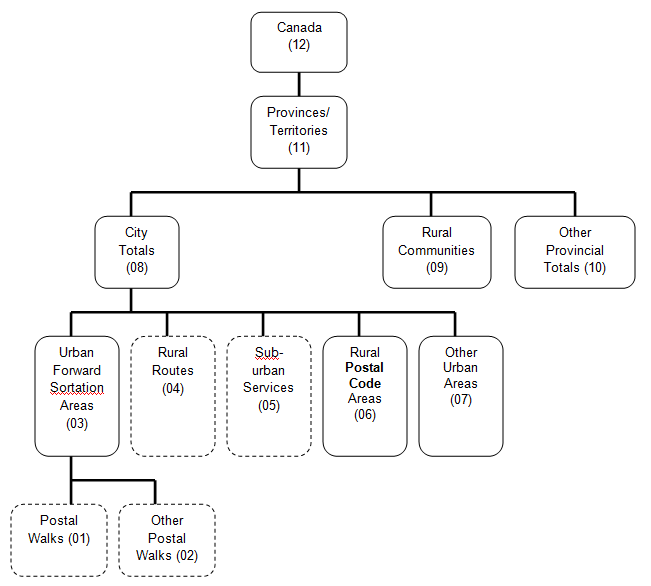
Description for hierarchy of postal geography
Geographic Levels – Census Geography
Data are also available for the following levels of the Census geography; the following table shows the coded designators for these geographies, as well as a brief description of each.
| Level of Geography (L.O.G.) |
Area | Description |
|---|---|---|
| 12 | Canada | This level of data is an aggregation of the provincial/territorial totals (L.O.G. 11). The national total is identified by the region code Z99099. |
| 11 | Province or Territory Total | These totals are identified by a provincial/territorial postal letter, then a "990" followed by the province/territory code, as follows: Newfoundland and Labrador = A99010 Nova Scotia = B99012 Prince Edward Island = C99011 New Brunswick = E99013 Quebec = J99024 Ontario = P99035 Manitoba = R99046 Saskatchewan = S99047 Alberta = T99048 British Columbia = V99059 Northwest Territories = X99061 Nunavut = X99062 Yukon Territory = Y99060 |
| 61 | Census Tract | Census tracts (CTs) are small geographic units representing urban or rural neighbourhood-like communities in census metropolitan areas (see definition below) or census agglomerations with an urban core population of 50,000 or more at time of 1996 Census. CTs were initially delineated by a committee of local specialists (such as planners, health and social workers and educators) in conjunction with Statistics Canada. The 2011 databanks contain 4,994 areas coded as level of geography 61, based on 2006 Census. |
| 51 | Economic Region | An economic region is a grouping of complete census divisions (see definition below) with one exception in Ontario. Economic regions (ERs) are used to analyse regional economic activity. Within the province of Quebec, ERs are designated by law. In all other provinces, they are created by agreement between Statistics Canada and the provinces concerned. Prince Edward Island and the territories each consist of one economic region. The 2011 databanks contain 76 areas coded as level of geography 51, based on 2006 Census. |
| 42 | Census Agglomeration |
The general concept of a census agglomeration (CA) is one of a very large urban area, together with adjacent urban and rural areas that have a high degree of economic and social integration with that urban area. CAs have an urban core population of at least 10,000, based on the previous census. The 2011 databanks contain 130 area codes as level of geography 42, based on the 2006 Census: 111 CAs, 6 provincial parts for the 3 CAs which cross provincial boundaries, and 13 residual geographies called Non CMA-CA, one for each province and territory. |
| 41 | Census Metropolitan Area | The general concept of a census metropolitan area (CMA) is one of a very large urban area, together with adjacent urban and rural areas that have a high degree of economic and social integration with that urban area. CMAs have an urban core population of at least 100,000, based on the previous census. The 2011 databanks contain 35 areas coded as level of geography 41, based on 2006 Census: 001, St. John's, Newfoundland and Labrador 205, Halifax, Nova Scotia 305, Moncton, New Brunswick 310, Saint John, New Brunswick 408, Saguenay, Quebec 421, Québec, Quebec 433, Sherbrooke, Quebec 442, Trois-Rivières, Quebec 462, Montréal, Quebec 505, Ottawa-Gatineau (3 items: combined, Quebec part and Ontario part) 521, Kingston, Ontario 529, Peterborough, Ontario 532, Oshawa, Ontario 535, Toronto, Ontario 537, Hamilton, Ontario 539, St-Catharines-Niagara, Ontario 541, Kitchener-Cambridge-Waterloo, Ontario 543, Brantford, Ontario 550, Guelph, Ontario 555, London, Ontario 559, Windsor, Ontario 568, Barrie, Ontario 580, Greater Sudbury, Ontario 595, Thunder Bay, Ontario 602, Winnipeg, Manitoba 705, Regina, Saskatchewan 725, Saskatoon, Saskatchewan 825, Calgary, Alberta 835, Edmonton, Alberta 915, Kelowna, British Columbia 932, Abbotsford-Mission, British Columbia 933, Vancouver, British Columbia 935, Victoria, British Columbia |
| 31 | Federal Electoral District | A federal electoral district (FED) refers to any place or territorial area represented by a member of Parliament elected to the House of Commons. There are 308 FEDs in Canada according to the 2003 Representation Order. The Representation Order is prepared by the Chief Electoral Officer describing, naming and specifying the population of each electoral district established by the Electoral Boundaries Commission and sent to the Governor in Council. The 2011 databanks contain 308 areas coded as level of geography 31. |
| 21 | Census Division | A census division (CD) is a group of neighbouring municipalities joined together for the purposes of regional planning and managing common services (such as police or ambulance services). A CD might correspond to a county, a regional municipality or a regional district. CDs are established under laws in effect in certain provinces and territories of Canada. In other provinces and territories where laws do not provide for such areas (Newfoundland and Labrador, Manitoba, Saskatchewan and Alberta), Statistics Canada defines equivalent areas for statistical reporting purposes in cooperation with these provinces and territories. The 2006 Census contain 288 areas coded as level of geography 21; however, the 2011 databanks contain 290 areas since the CD of Halton (Ont.) straddles 2 Economic Regions. Starting in 2007, Census divisions are identified in the tables by a six digits code: 2 first digits = Province 2 next digits = Economic Region 2 last digits = Census Division |
Geographic Levels - Special Geography
Clients may select geographical areas of their own definition; areas that are not part of the standard areas listed here (for example, bank service areas, retail store catchment areas). For this, clients must submit a list of the geographic areas that make up their special area, and we will aggregate the micro data to correspond to that area of interest. User-defined areas can be based on aggregations of provinces and territories, economic regions, census divisions, census metropolitan areas, census agglomerations, census tracts, federal electoral districts and census subdivisions. Information ordered for "user-defined" areas will be coded according to the following:
| Level of Geography (L.O.G.) |
Name | Description |
|---|---|---|
| 93 | Total for all user-defined areas | This level represents the sum total of all user-defined areas, and is the total of levels 91 and 92 described below. |
| 92 | Other user-defined areas | This level of geography represents all user-defined areas that were too small, in terms of population; to have information compiled on those areas individually (i.e. fewer than 100 taxfilers). Such areas are grouped into this "other" category. |
| 91 | Special user-defined area | Any area showing L.O.G. = 91 is an area defined by a specific user according to that user's needs (for example, school catchment areas, health districts, etc.) |
Postal Code Conversion File
When a client is interested in purchasing data for areas made up of Postal Codes that are considered non‑standard postal geography, a conversion file is necessary. In this context an electronic file containing a combination of Postal Codes making up one or more user-defined area(s) is referred to as a conversion file. The data can then be compiled for these user-defined areas (subject to our confidentiality restrictions).
For example, Postal Code based user-defined areas may be branch service or school catchment areas, neighbourhoods or almost any other region.
We invite your comments
We are always working on ways to improve our products. The comments we receive concerning quality and presentation are essential to meet this objective. If you have any suggestions in this regard, we encourage you, the user, to provide us with your comments.
How to obtain more information
Inquiries about these data and related statistics or services should be directed to:
Client Services, Income Statistics Division
Telephone: Toll Free 1-888-297-7355 or 613-951-7355
Statistics Canada, Jean Talon Building, 5th Floor
Ottawa, Ontario K1A 0T6
Online requests: income@statcan.gc.ca
Statistics Canada's National Contact Centre provides a wide range of services: identification of your needs, establishing sources or availability of data, consolidation and integration of data coming from different sources, and general support for the use of Statistics Canada concepts and the use of statistical data.
Statistics Canada's National Contact Centre
Telephone: Toll Free 1-800-263-1136 or 613-951-8116
Telecommunications device for the hearing impaired (TTY): 1-800-363-7629
Online requests: infostats@statcan.gc.ca
You can also visit us on the web: Statistics Canada
Standards of service to the public
Statistics Canada is committed to serving its clients in a prompt, reliable and courteous manner. To this end, the Agency has developed standards of service which its employees observe in serving its clients.
Copyright
Published by authority of the Minister responsible for Statistics Canada.
© Minister of Industry, 2013
All rights reserved. Use of this publication is governed by the Statistics Canada Open Licence Agreement.
© This data includes information copied with permission from Canada Post Corporation
List of available data products
The Income Statistics Division’s T1FF Processing Section of Statistics Canada tabulates statistical data derived from administrative records - most notably, the taxfiler. The resulting demographic and socio-economic databanks available are listed in the table below, along with their identifying product number and the usual release dates.
| Product name | Product number | Release date |
|---|---|---|
| RRSP Contributors | 17C0006 | Fall - Winter |
| RRSP Contribution Limits (Room) | 17C0011 | Fall - Winter |
| Canadian Savers | 17C0009 | Fall - Winter |
| Canadian Investors | 17C0007 | Fall - Winter |
| Canadian Investment Income | 17C0008 | Fall - Winter |
| Canadian Taxfilers | 17C0010 | Fall - Winter |
| Canadian Capital Gains | 17C0012 | Fall - Winter |
| Charitable Donors | 13C0014 | Fall - Winter |
| Neighbourhood Income and Demographics | 13C0015 | Spring - Summer |
| Economic Dependency Profile | 13C0017 | Spring - Summer |
| Labour Income Profile | 71C0018 | Spring - Summer |
| Families | 13C0016 | Spring - Summer |
| Seniors | 89C0022 | Spring - Summer |
| Migration Estimates | 91C0025 | Fall |