
Spending
Spending 2019–20 to 2024–25
The following graph presents planned (voted and statutory spending) over time.
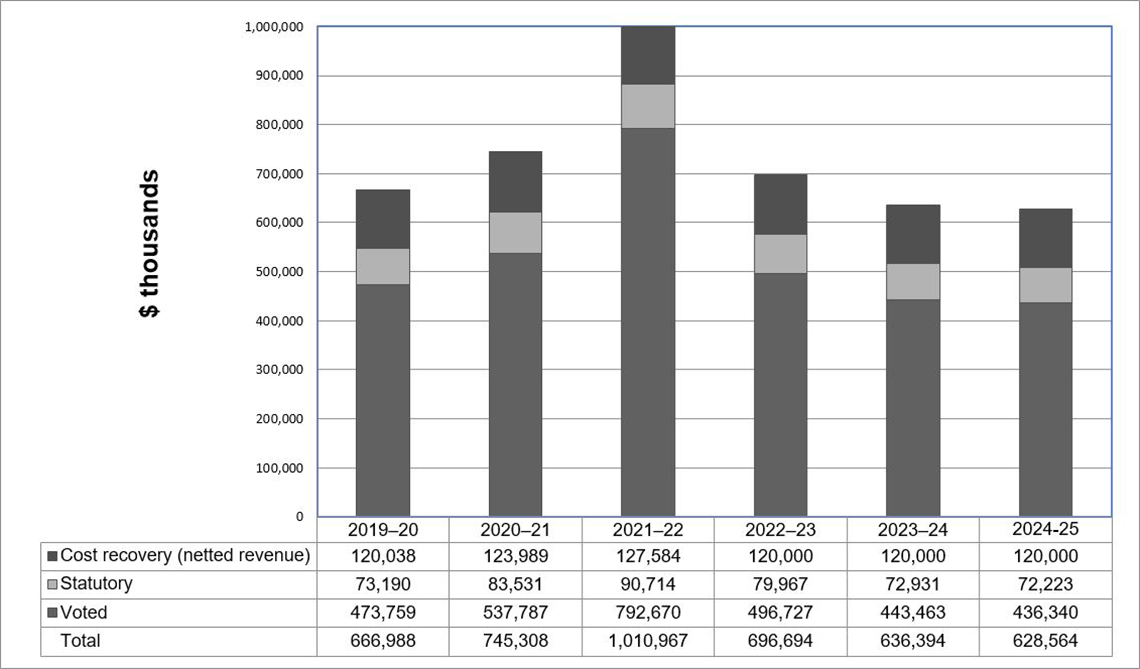
Description - Planned spending by fiscal year
| 2019–20 | 2020–21 | 2021–22 | 2022–23 | 2023–24 | 2024-25 | |
|---|---|---|---|---|---|---|
| Cost Recovery (Netted Revenue) | 120,038 | 123,989 | 127,584 | 120,000 | 120,000 | 120,000 |
| Statutory | 73,190 | 83,531 | 90,714 | 79,967 | 72,931 | 72,223 |
| Voted | 473,759 | 537,787 | 792,670 | 496,727 | 443,463 | 436,340 |
| Total | 666,988 | 745,308 | 1,010,967 | 696,694 | 636,394 | 628,564 |
Budgetary performance summary for core responsibilities and internal services (dollars)
The "Budgetary performance summary for core responsibilities and internal services" table presents the budgetary financial resources allocated for Statistics Canada's core responsibilities and for internal services.
| Core responsibilities and internal services | 2021–22 Main Estimates | 2021–22 planned spending | 2022–23 planned spending | 2023–24 planned spending | 2021–22 total authorities available for use | 2019–20 actual spending (authorities used) | 2020–21 actual spending (authorities used) | 2021–22 actual spending (authorities used) |
|---|---|---|---|---|---|---|---|---|
| Statistical information | 855,425,655 | 855,425,655 | 616,663,357 | 560,200,355 | 972,123,133 | 584,770,894 | 666,463,788 | 920,977,524 |
| Internal services | 66,905,037 | 66,905,037 | 80,030,892 | 76,193,902 | 100,209,616 | 82,217,225 | 78,844,148 | 89,989,424 |
| Total | 922,330,692 | 922,330,692 | 696,694,249 | 636,394,257 | 1,072,332,749 | 666,988,119 | 745,307,936 | 1,010,966,948 |
| Respendable revenue | -120,000,000 | -120,000,000 | -120,000,000 | -120,000,000 | -127,583,773 | -120,038,495 | -123,989,068 | -127,583,773 |
| Total | 802,330,692 | 802,330,692 | 576,694,249 | 516,394,257 | 944,748,976 | 546,949,624 | 621,318,868 | 883,383,175 |
Statistics Canada is funded by two sources: direct parliamentary appropriations and cost-recovery activities. Statistics Canada has the authority to generate $120 million annually in respendable revenue related to two streams: statistical surveys and related services, and custom requests and workshops. If exceeded, a request can be made to increase the authority, as was the case in the last few years.
In recent years, respendable cost-recovery revenue has contributed between $120 million and $127 million annually to the agency's total resources. A large portion of this respendable revenue comes from federal departments to fund specific statistical projects.
Spending fluctuations between the years shown in the graph and table above were mainly caused by the Census Program. Activity for this program peaked in 2021‒22 when the 2021 Census of Population and the 2021 Census of Agriculture were conducted, and will drop in 2022‒23 and 2023‒24 as these activities begin to wind down. This pattern is typical for the agency because of the cyclical nature of the Census Program. Funding for the 2026 Census of Population and the 2026 Census of Agriculture has not yet been approved. This amplifies the decrease in the overall Census Program funding.
In addition, funding received for several new initiatives from Budget 2021 decreases from 2022–23 to 2023–24 and remains relatively stable in 2024‒25.
The difference between 2021–22 actual spending and 2021–22 total authorities available for use is largely because of how the agency strategically manages its investments. The agency leverages the operating budget carry-forward mechanism to manage the cyclical nature of its program operations and strategic priorities investments. Throughout the year, forecasted program or project surpluses carried forward are managed centrally, by priority, within the statistical information core responsibility.
Furthermore, considerable efforts of shifting from paper-based, in-person operations to online virtual activities for the 2021 Census of Population generated savings. These funds are returned to the fiscal framework.
Internal services' spending from 2019–20 to 2021–22 includes planned resources from temporary funding related to an initiative approved in 2018–19 to migrate the agency's infrastructure to the cloud. The decrease in funding for outer years is largely because of ongoing funding related to cloud expenditures not yet secured and how the agency strategically manages its investments. Investments are managed centrally, by priority, within the statistical information core responsibility. Investment funding from past years will end in future years, while new investment decisions will be finalized only later in the year.
2021–22 Budgetary actual gross spending summary (dollars)
The following table reconciles gross planned spending with net spending for 2021–22.
| Core responsibilities and internal services | 2021–22 actual gross spending | 2021–22 actual revenues netted against expenditures | 2021–22 actual net spending (authorities used) |
|---|---|---|---|
| Statistical information | 920,977,524 | 127,583,773 | 793,393,751 |
| Internal services | 89,989,424 | 0 | 89,989,424 |
| Total | 1,010,966,948 | 127,583,773 | 883,383,175 |
Statistics Canada generated $127 million in respendable revenue from the sale of statistical products and services.
Human resources
The "Human resources summary for core responsibilities and internal services" table presents the full-time equivalents (FTEs) allocated to each of Statistics Canada's core responsibilities and to internal services.
| Core responsibilities and internal services | 2019–20 actual full‑time equivalents | 2020–21 actual full‑time equivalents | 2021–22 planned full-time equivalents | 2021–22 actual full‑time equivalents | 2022–23 planned full‑time equivalents | 2023–24 planned full‑time equivalents |
|---|---|---|---|---|---|---|
| Statistical information | 5,595 | 6,099 | 6,026 | 7,186 | 5,889 | 5,387 |
| Internal services | 626 | 684 | 563 | 713 | 659 | 642 |
| Total | 6,221 | 6,783 | 6,589 | 7,899 | 6,548 | 6,029 |
| Respendable revenue | -1,366 | -1,340 | -1,231 | -1,542 | -1,181 | -1,181 |
| Total | 4,855 | 5,443 | 5,358 | 6,357 | 5,367 | 4,848 |
Similar to trends seen in planned spending, changes in full-time equivalents from year to year are largely explained by the cyclical nature of the Census Program. Activity peaked in 2021–22, when the 2021 Census of Population and 2021 Census of Agriculture were conducted and decreases thereafter as these activities wind down.
Expenditures by vote
For information on Statistics Canada's organizational voted and statutory expenditures, consult the Public Accounts of Canada 2021.
Government of Canada spending and activities
Information on the alignment of Statistics Canada's spending with Government of Canada's spending and activities is available in GC InfoBase.
Financial statements and financial statements highlights
Financial statements
Statistics Canada's financial statements (unaudited) for the year ended March 31, 2022, are available on the agency's website.
The agency uses the full accrual accounting method to prepare and present its annual financial statements, which are part of the departmental results reporting process. However, spending authorities presented in the previous sections of this report remain on an expenditure basis. A reconciliation between the bases of reporting is available in Note 3 of the financial statements.
Financial statement highlights
| Financial information | 2021–22 planned results | 2021–22 actual results | 2020–21 actual results | Difference (2021–22 actual results minus 2021–22 planned results) | Difference (2021–22 actual results minus 2020–21 actual results) |
|---|---|---|---|---|---|
| Total expenses | 1,048,174,102 | 1,098,855,896 | 852,413,139 | 50,681,794 | 246,442,757 |
| Total revenues | 120,000,000 | 127,990,099 | 120,247,616 | 7,990,099 | 7,742,483 |
| Net cost of operations before government funding and transfers | 928,174,102 | 970,865,797 | 732,165,523 | 42,691,695 | 238,700,274 |
Statistics Canada's Future-Oriented Condensed Statement of Operations (unaudited) for the year ended March 31, 2022, is available on the agency website. The assumptions underlying the forecasts were made before the completion of the 2020‒21 fiscal year.
The net cost of operations before government funding and transfers was $970.9 million, an increase of $238.7 million (32.6%) from $732.2 million in 2020‒21. The increase in expenses and revenues are mainly because of an overall increase in the agency's activities, particularly for the 2021 Census of Population Program. Additionally, salary costs increased because of the ratification of certain collective agreements in 2021‒2022.
The difference between actual and planned net costs for 2021‒22 is $42.7 million (4.6%). Expenses were $50.7 million higher than anticipated. The ratification of collective agreements and new initiatives, such as better data for better outcomes, strengthening long-term care and supportive care, enhancing business condition data and better understanding our environment, contributed to a significant increase in expenditures. Also contributing to this increase is funding that was carried forward from 2020‒21. This allowed the agency to meet the needs of its cyclical programs and to invest in its integrated strategic plans. The increases are partially offset by budget carried forward to 2022–23. Revenues were $8 million higher than anticipated.
For more information on the distribution of expenses by program and type, please see the two charts below.
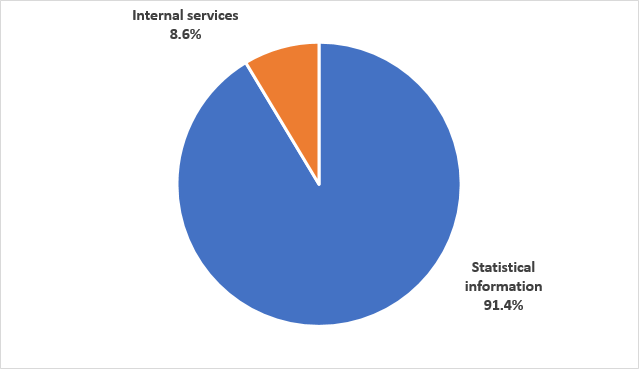
Total expenses, including respendable revenue and services provided without charge by federal government departments, were $1.1 billion in 2021‒2022. These expenses comprised $1.0 billion (91.4%) for statistical information and $94.9 million (8.6%) for internal services.
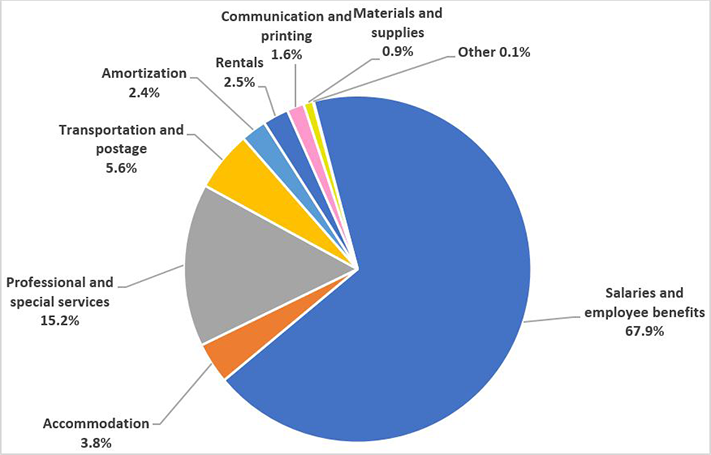
Statistics Canada spent $1.1 billion in 2021‒2022. These expenses comprised $746.8 million for salaries and employee benefits (67.9%), $42.1 million for accommodation (3.8%), $166.8 million for professional and special services (15.2%), $61.5 million for transportation and postage (5.6%), $26.9 million for rentals (2.5%), $26.2 million for amortization (2.4%), $17.6 million in communication and printing ($1.6%), $9.5 million in materials and supplies (0.9%) and $1.5 million in other expenses (0.1%).
| Financial information | 2021–22 | 2020–21 | Difference (2021–22 minus 2020–21) |
|---|---|---|---|
| Total net liabilities | 142,525,338 | 160,919,348 | -18,394,010 |
| Total net financial assets | 67,079,045 | 77,141,756 | -10,062,711 |
| Departmental net debt | 75,446,293 | 83,777,592 | -8,331,299 |
| Total non-financial assets | 170,908,816 | 170,230,625 | 678,191 |
| Departmental net financial position | 95,462,523 | 86,453,033 | 9,009,490 |
The departmental net financial position was $95.5 million at the end of 2021‒22, an increase of $9 million from $86.5 million in 2020‒21.
The decrease in total net liabilities is mainly explained by a decrease in accrued liabilities for vacation pay and compensatory leave resulting from the mandatory cash-out of vacation and compensatory leave and a decrease in accounts payable.
The decrease in total net financial assets is mainly explained by a decrease in the amount due from the Consolidated Revenue Fund as of March 31, 2022, to pay for accounts payable and accrued salaries and wages. This is offset by an increase in accounts receivable from other government departments and external parties.
For more information on the distribution of the balances in the statements of financial position, please see the two charts below.
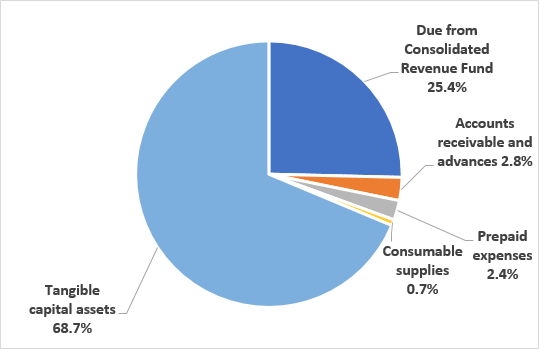
Total assets, including financial and non-financial assets, were $238 million at the end of 2021‒22. Tangible capital assets represented the largest portion of assets at $163.5 million (68.7%). They consisted of informatics software ($85.3 million), software under development ($62.6 million), leasehold improvements ($13.9 million) and other assets ($1.7 million). The remaining portion comprised $60.4 million for amounts due from the Consolidated Revenue Fund (25.4%), $5.7 million for prepaid expenses (2.4%), $6.7 million for accounts receivable and advances (2.8%) and $1.7 million for consumable supplies (0.7%).
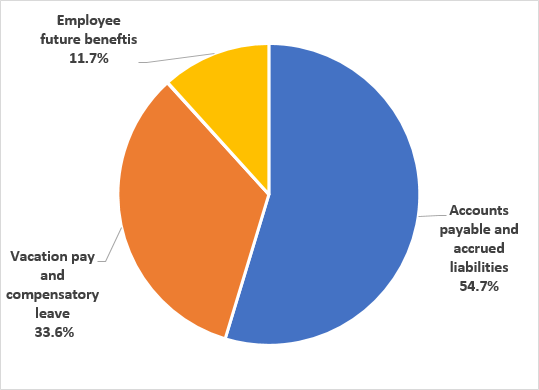
Total liabilities were $142.5 million at the end of 2021‒22. Accounts payable and accrued liabilities made up the largest portion of liabilities at $77.9 million (54.7%). They consisted of accounts payable to external parties ($30.2 million), accounts payable to other federal government departments and agencies ($13.3 million) and accrued salaries and wages ($34.4 million). The next largest portion was vacation pay and compensatory leave at $47.9 million (33.6%), and employee future benefits made up $16.7 million (11.7%).