
Accommodation services see strong growth and reach new all-time high operating revenue
The accommodation services subsector recorded a record-high operating revenue of $34.9 billion in 2023, marking a 17.6% increase from 2022 and a 29.0% rise compared with 2019. Growth should be more moderate moving forward, with COVID-19 pandemic impacts now being minimal.
Among the provinces and territories, Ontario (29.5%) posted the largest share of revenue in 2023, followed by British Columbia (23.3%), Alberta (17.2%) and Quebec (16.4%).
Operating expenses rose by 16.3% to $28.4 billion in 2023. The largest contributor to these expenses was salaries, wages, commissions and benefits (26.4% of total expenses). This was up from 25.5% in 2022 but remained lower than in 2019 (29.2%). The accommodation and food services sector was particularly impacted by labour shortages following the lifting of pandemic-related restrictions.
The profit margin was 18.5% in 2023, up from 17.5% in 2022, and it was noticeably higher than the pre-pandemic level of 14.2% in 2019. The record-high profit margins seen in 2022 and 2023 may be explained by the impact of strong price pressures and the closure of many struggling establishments following the implementation of pandemic-related travel restrictions. The implementation of these restrictions left more profitable establishments in operation.
The accommodation services subsector comprises two industry groupings. The first includes hotels, motor hotels and motels, as well as private short-term rentals, and the second includes other accommodation industries.
Operating revenue, accommodation services
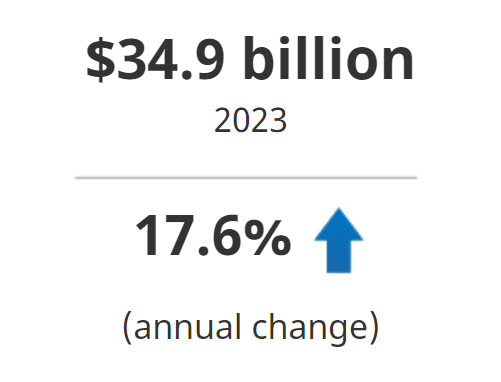
Source: Table 33-10-0102-01.
Hotels, motor hotels and motels
Operating revenue for hotels, motor hotels and motels climbed 19.6% from 2022 to $28.8 billion in 2023.
Most sales revenue in 2023 was generated by room or unit accommodation for travellers (74.9%), followed by meals and non-alcoholic beverages (9.3%).
The share of sales to individuals was 47.9% in 2023, the highest share among all client types, followed by sales to businesses (25.4%).
Operating expenses rose 18.0% to $23.0 billion in 2023, with 26.8% of this amount going to salaries, wages, commissions and benefits. This resulted in an operating profit margin of 20.0%.
In 2023, e-commerce sales accounted for 31.1% of total sales.
Operating revenue, hotels, motor hotels and motels
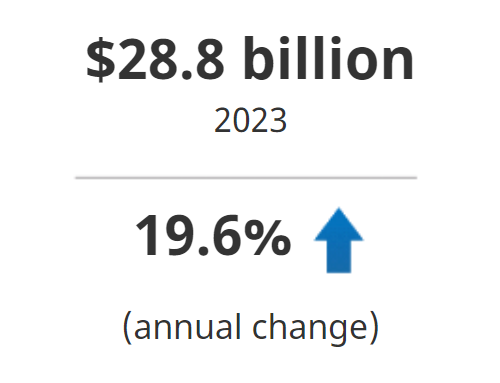
Source: Table 33-10-0102-01.
Other accommodation industries
Operating revenue for other accommodation industries increased 9.0% in 2023 to reach $6.1 billion. Alberta (31.5%) accounted for the largest share of revenue, followed by Ontario (24.1%), British Columbia (17.5%) and Quebec (14.8%).
Alberta led all provinces in this industry grouping in 2023, with a significant portion of its business activity coming from workforce lodging companies that provided accommodation at isolated work locations. This is common among resource extraction operations, such as those found in northern Alberta.
Operating expenses increased 9.6% to $5.4 billion in 2023, with 25.3% of this amount going to salaries, wages, commissions and benefits. The profit margin was 11.4% in 2023, down slightly from 11.9% in 2022, though both margins are similar to that of 2019 (11.7%), unlike the profit margins in the first industry grouping.
Operating revenue, other accommodation industries
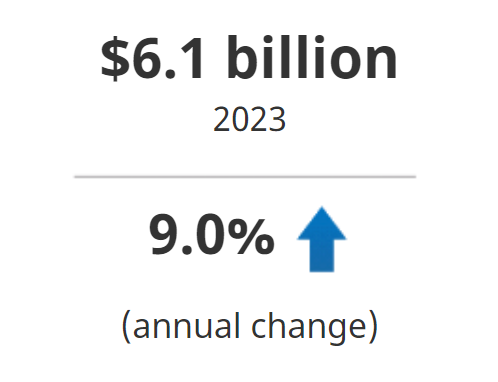
Source: Table 33-10-0102-01.
Note to readers
Data for 2022 have been revised.
The hotels, motor hotels and motels grouping contains the following standard North American Industry Classification System (NAICS) 2022 codes: 721111 (hotels), 721112 (motor hotels), 721113 (resorts), 721114 (motels), 721120 (casino hotels) and 721198 (all other traveller accommodation).
Other accommodation industries contain the following standard NAICS 2022 codes: 721191 (bed and breakfast), 721192 (housekeeping cottages and cabins), 721211 (recreational vehicle parks and campgrounds), 721212 (hunting and fishing camps), 721213 (recreational [except hunting and fishing] and vacation camps) and 721310 (rooming and boarding houses).
These and other data related to business and consumer services can be found at the Business and consumer services and culture statistics portal.
Reference
Data tables: 21-10-0237-01, 21-10-0239-01, 21-10-0252-01, 33-10-0102-01 and 33-10-0103-01.
- Note: some data tables may best be viewed on desktop.
Definitions, data sources and methods: survey number 2418
Previous release: Accommodation services, 2022
Contact information
For more information, or to enquire about the concepts, methods or data quality of this release, contact us (toll-free 1-800-263-1136; 514-283-8300; infostats@statcan.gc.ca) or Media Relations (statcan.mediahotline-ligneinfomedias.statcan@statcan.gc.ca).