

Canadian industries operated at 79.3% of their production capacity in the third quarter, up slightly from 79.1% in the second quarter, which has not been revised since its release.

Source: Table 16-10-0109-01.
Electric power generation, transmission and distribution industry increases
Capacity utilization in the electric power generation, transmission and distribution industry rose 1.9 percentage points to 83.4% in the third quarter. This increase coincided with higher demand for electricity for cooling-related purposes because of higher-than-normal temperatures observed in some parts of the country during the summer.
In contrast, capacity utilization in mining, quarrying, and oil and gas extraction fell 0.7 percentage points to 75.9% in the third quarter, on lower oil sands extraction and natural gas extraction. This downturn coincided with maintenance work at a number of facilities during the quarter.
Chart 1: Industrial capacity utilization in non-manufacturing industries
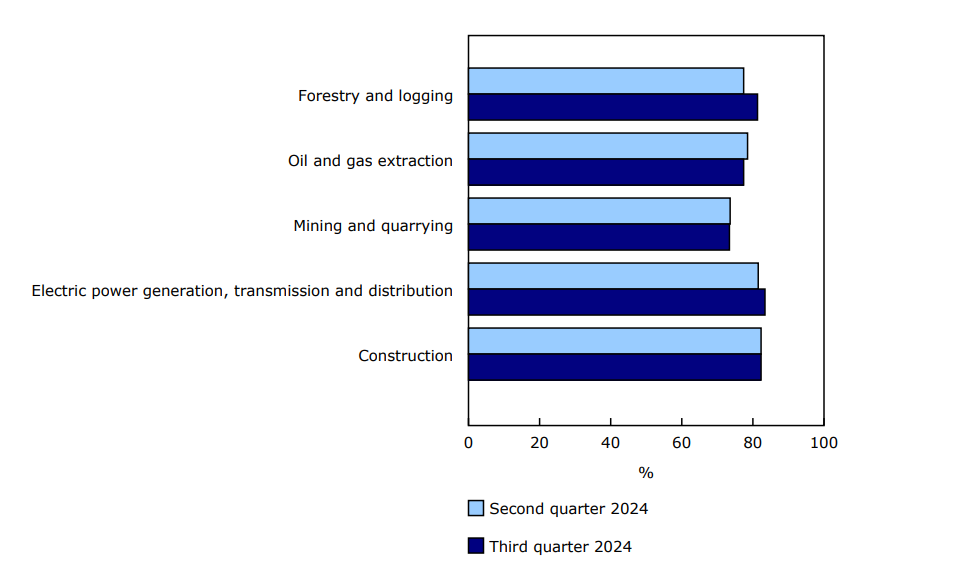
Description - Chart 1
Data table: Industrial capacity utilization in non-manufacturing industries
Source: Table 16-10-0109-01.
Capacity utilization in manufacturing edges up
The capacity utilization rate in the manufacturing sector edged up 0.4 percentage points to 78.2% in the third quarter. This advance was driven by petroleum and coal product manufacturing (+2.2 percentage points) and transportation equipment manufacturing (+1.4 percentage points). Chart 2 shows quarterly changes in percentage points by manufacturing industry.
Chart 2: Variation by industry, in percentage points, third quarter of 2024 compared with second quarter of 2024
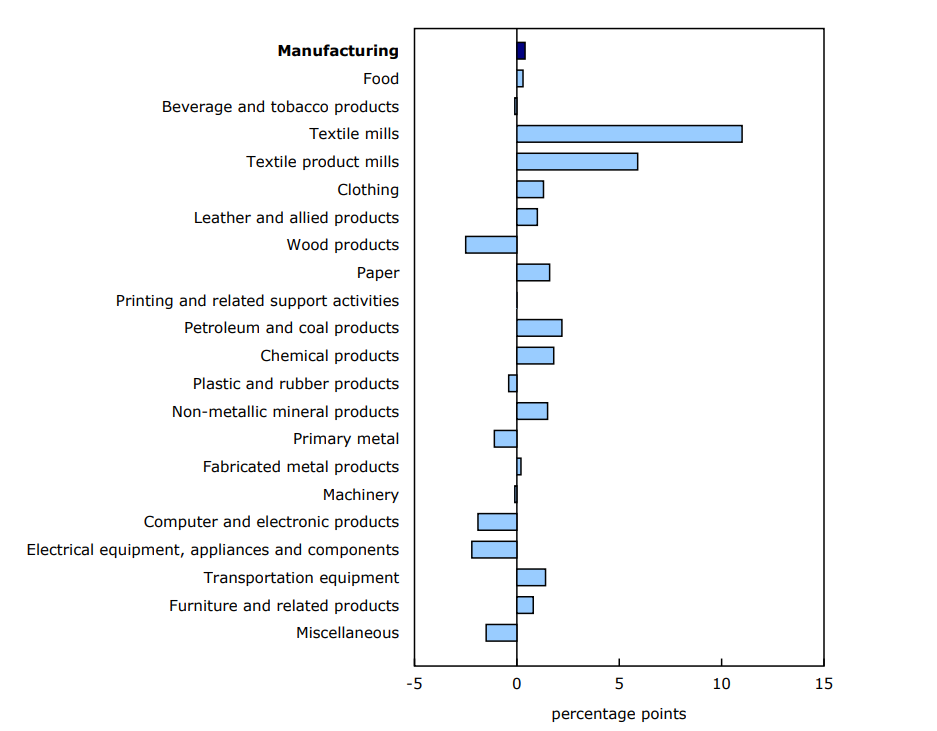
Description - Chart 2
Data table: Variation by industry, in percentage points, third quarter of 2024 compared with second quarter of 2024
Source: Table 16-10-0109-01.
Note to readers
The industrial capacity utilization rate is the ratio of an industry's actual output to its estimated potential output.
This program covers all manufacturing industries, as well as forestry and logging; mining, quarrying, and oil and gas extraction; electric power generation, transmission and distribution; and construction.
For non-manufacturing industries, the quarterly pattern is derived from the output-to-capital ratio series, the output being the real gross domestic product at basic prices, seasonally adjusted, by industry.
In this release, the industrial capacity utilization rates from the Monthly Survey of Manufacturing were seasonally adjusted using X-12-ARIMA (auto-regressive integrated moving average) from the first quarter of 2017.
Data have been revised back to the first quarter of 2020 to account for revisions to the source data and new estimates from the statistical model.
Reference
Data table: 16-10-0109-01.
- Note: some data tables may best be viewed on desktop.
Definitions, data sources and methods: 2821.
Previous release: Industrial capacity utilization rates, second quarter 2024.
Next release: March 7, 2024.
Contact information
For more information, or to enquire about the concepts, methods or data quality of this release, contact us (toll-free 1-800-263-1136; 514-283-8300; infostats@statcan.gc.ca) or Media Relations (statcan.mediahotline-ligneinfomedias.statcan@statcan.gc.ca).