
Canadian manufacturing continues to grow
The Canadian manufacturing sector grew for the third consecutive year, with total revenue up 1.7% year over year to $935.6 billion in 2023.
Revenue from goods manufactured accounted for 93.4% of total revenue, up 1.3% to $874.2 billion in 2023.
Of the 21 subsectors, 12 saw increases in revenue from goods manufactured and 9 reported declines. Transportation equipment, food and machinery manufacturing subsectors contributed the most to the annual increase, adding a combined $36.6 billion in 2023. The increases were partially offset by a combined $26.0 billion decline in the petroleum and coal product and wood product manufacturing subsectors.
Ontario, Quebec, and Alberta accounted for over four-fifths (82.0%) of the manufacturing activities in the country in 2023, with their share of total revenue from goods manufactured in Canada increasing slightly from 2022 (81.4%).
Ontario gains driven by transportation equipment
Revenue from goods manufactured in Ontario has been rising since 2021, up 6.7% from 2022 to $394.6 billion in 2023. Together, the transportation equipment ($107.5 billion), food ($60.8 billion) and chemical ($29.8 billion) subsectors accounted for half (50.2%) of the provincial revenue from goods manufactured in 2023.
In Ontario, 16 of 21 manufacturing subsectors reported increases in 2023. The largest gains were in the transportation equipment subsector (+$20.8 billion), which accounted for 83.6% of the overall increase in revenue from goods manufactured, followed by the food (+$4.8 billion) and machinery manufacturing (+$2.0 billion) subsectors.
The overall increase was partially offset by lower petroleum and coal product (-$3.1 billion) and primary metal (-$2.6 billion) manufacturing.
Quebec sees the largest provincial decline in revenue from goods manufactured
Revenue from goods manufactured in Quebec fell 2.6% year over year to $219.9 billion in 2023. Overall, 9 of 21 manufacturing subsectors in Quebec posted decreases.
In 2023, four subsectors accounted for more than half (51.0%) of the provincial revenue from goods manufactured: food ($33.7 billion), primary metal ($30.9 billion), transportation equipment ($26.9 billion) and petroleum and coal product ($20.7 billion) manufacturing.
The largest decreases in 2023 were in petroleum and coal product (-$4.1 billion) and wood product (-$3.3 billion) manufacturing. The overall decline was moderated by an increase in food manufacturing (+$1.9 billion).
Growth in total expenses slows following large increase in 2022
Total expenses saw modest growth in 2023, up 1.4% to $837.2 billion. Canadian manufacturers spent an average of $0.89 on total expenses for every dollar in total revenue, down slightly from $0.90 in 2022.
Non-metallic mineral product and chemical manufacturing were the most profitable subsectors in 2023, each incurring $0.85 in total expenses for every dollar in total revenue.
Transportation equipment manufacturing spent the most in 2023 at $0.94 per dollar of revenue.
Costs of materials and supplies grew 0.9% in 2023 to $543.4 billion, where an average cost of $0.62 for materials and supplies was incurred for every dollar earned in revenue from goods manufactured. Manufacturers of petroleum and coal-based products spent the most on this expense item, at $0.80 per dollar earned in revenue from goods manufactured, followed by manufacturers of transportation equipment ($0.73) and primary metal ($0.68).
Printing and related support activities ($0.44) along with apparel manufacturing ($0.44) spent the least on materials and supplies in 2023.
Total salaries and wages increased 2.9% to $109.4 billion in 2023. Manufacturers spent an average of $0.13 on salaries and wages for every dollar earned in revenue from goods manufactured in 2023, a small increase from $0.12 in 2022.
Manufacturers in the apparel subsector spent the most on salaries and wages in 2023 at $0.29, followed by those from leather and allied product manufacturing ($0.27), printing and related support activities ($0.26) and furniture and related product manufacturing ($0.26).
In contrast, petroleum and coal product ($0.02) and primary metal ($0.07) manufacturers spent the least on salaries and wages in 2023.
Transportation equipment reports highest growth
The transportation equipment manufacturing subsector reported its second consecutive year of revenue growth from goods manufactured in 2023, following a two-year decline. The transportation equipment subsector reported the largest increase among all manufacturing subsectors in 2023, rising 16.8% to $145.0 billion, surpassing the pre-COVID-19 pandemic level of 2019 ($138.3 billion) for the first time.
The largest contributor to growth in revenue from goods manufactured for the transportation equipment manufacturing subsector in 2023 was automobile and light-duty motor vehicle manufacturing (+$15.0 billion), which accounted for over two-thirds (71.7%) of the increase. This was followed by aerospace product and parts (+$4.7 billion) and heavy-duty truck (+$1.3 billion) manufacturing.
Wood product manufacturing declines on lower prices
Wood product manufacturers reported a second consecutive year of lower revenue from goods manufactured, down by 24.3% to $39.3 billion in 2023, following a peak in 2021 ($53.4 billion). The decline was primarily driven by sawmills and wood preservation (-$8.2 billion), which accounted for just under two-thirds (64.8%) of the overall decline in revenue from goods produced.
The decrease in revenue from goods manufactured was largely attributable to lower prices for products such as softwood lumber (-39.7%) and reconstituted wood products (-17.2%). Demand for lumber fell as buyers waited for more stable and predictable seasonal prices, following two years of high and volatile prices.
Petroleum and coal product manufacturing sees largest decline
Following a large increase in revenue from goods produced in 2022, the petroleum and coal product subsector had the largest decrease of all manufacturing subsectors (down 11.8% to $99.7 billion in 2023). This drop was reflected in the average prices of refined petroleum energy products (including liquid biofuels), which were down 15.6% in 2023.
Food manufacturing subsector claims top spot four years in a row
Since 2020, food manufacturing has been the largest manufacturing subsector in terms of revenue. In 2023, it accounted for 17.8% of revenue from goods produced for all manufacturing subsectors. With its 18th consecutive year of growth, revenue from manufactured goods rose by 7.1% year over year to $155.2 billion in 2023. This increase was attributable to starch and vegetable fat and oil manufacturing (+$2.3 billion), bread and bakery product manufacturing (+$1.8 billion), dairy product (except frozen) manufacturing (+$1.3 billion), and animal slaughtering and processing (+$1.2 billion).
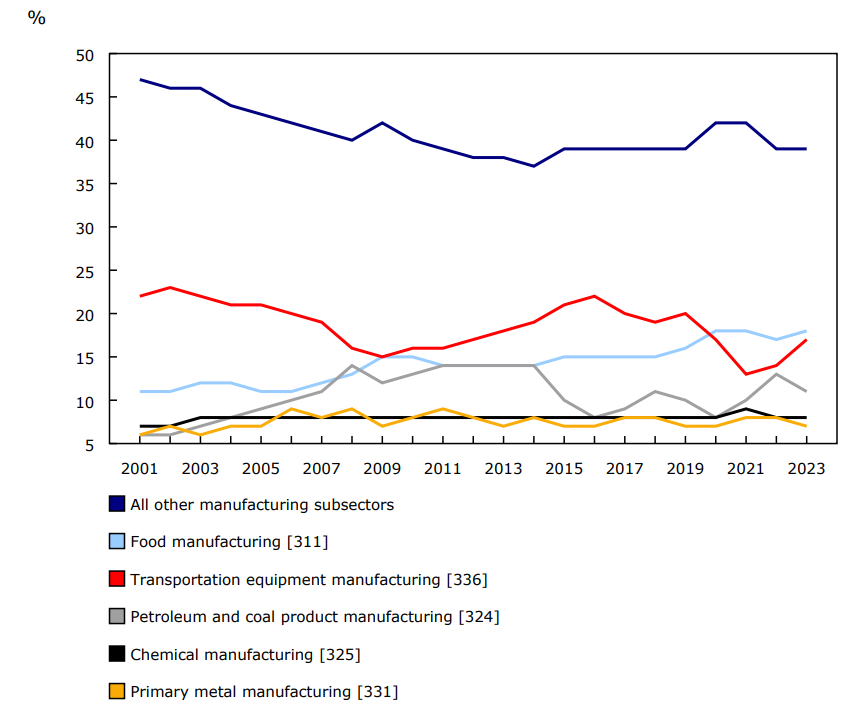
Chart 1: Subsector share of revenue from goods manufactured in Canada, 2001 to 2023
Description - Chart 1
Data table: Subsector share of revenue from goods manufactured in Canada, 2001 to 2023
Sources: Tables 16-10-0117-01, 16-10-0038-01 and 16-10-0056-01.
Note to readers
Starting with the 2023 reference year, sales generated by a manufacturing process located outside Canada, regardless of the ownership of the raw materials used in the production process (Canadian-owned or not), are excluded from the survey.
All annual average price changes were calculated using the data from the Industrial Product Price Index, by product, monthly (table 18-10-0266-01).
Data for 2022 have been revised.
Data are collected for the 12-month fiscal period that ends on or between April 1, 2023, and March 31, 2024.
For more information on data quality and revisions, please refer to the page Annual Survey of Manufacturing and Logging Industries. Users can also obtain information from the Monthly Survey of Manufacturing or from other Statistics Canada programs.
Reference
Data table: 16-10-0117-01.
- Note: some data tables may best be viewed on desktop.
Definitions, data sources and methods: survey number 2103.
Previous release: Annual Survey of Manufacturing Industries, 2022.
Contact information
For more information, or to enquire about the concepts, methods or data quality of this release, contact us (toll-free 1-800-263-1136; 514-283-8300; infostats@statcan.gc.ca) or Media Relations (statcan.mediahotline-ligneinfomedias.statcan@statcan.gc.ca).