

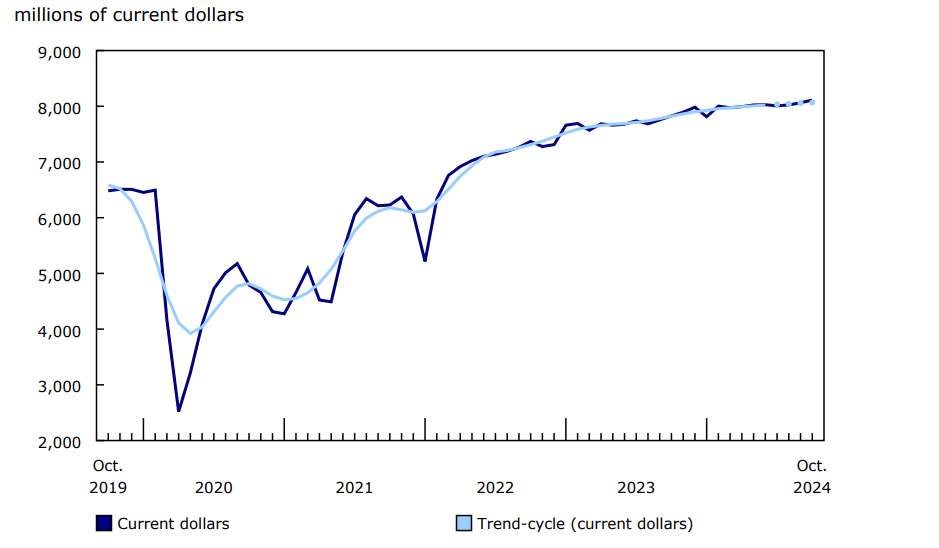
Total sales in the food services and drinking places subsector increased for the third consecutive month in October, rising 0.6% to $8.1 billion.
Non-seasonally adjusted prices for food purchased from restaurants were up 3.4% in October, compared with October 2023, and unadjusted prices for alcoholic beverages served in licensed establishments increased 2.3% over the same period.
Chart 1: Sales in food services and drinking places
Description - Chart 1
Data table: Sales in food services and drinking places
Note: The higher variability associated with the trend-cycle estimates is indicated with a dotted line on the chart for the current reference month and the previous three months. For more information, see the Note to readers.
Source: Table 21-10-0019-01
Full-service restaurants lead gains
In October 2024, the largest increase in dollar terms came from higher sales at full-service restaurants (+0.6%), the industry's third consecutive monthly increase. Higher sales were also observed in special food services (+2.5%). Limited-service eating places (+0.3%) posted their seventh consecutive monthly increase.
Sales up in seven provinces
Seven provinces saw increased sales in the month of October, with Alberta (+1.6%) posting the largest gain in dollar terms. Ontario posted a 0.5% increase in October, led by stronger sales from special food services and full-service restaurants. Sales in Quebec (+0.9%) also increased on higher sales at full-service restaurants. British Columbia (-0.4%) posted the largest sales decrease in dollar terms, largely on lower sales at full-service restaurants.
Looking for more insight?
Further information is available in the "Food Services and Drinking Places Sales" dashboard, where users can consult data on sales in food services and drinking places for Canada and by province and territory. This application allows users to compare provincial and territorial data through interactive maps and charts.
Note to readers
Unless otherwise noted, all data in this release are seasonally adjusted and expressed in current dollars. Seasonally adjusted data are data that have been modified to eliminate the effect of seasonal and calendar influences to allow for more meaningful comparisons of economic conditions from period to period. For more information on seasonal adjustment, see Seasonally adjusted data – Frequently asked questions.
Trend-cycle data are included in selected charts to complement the seasonally adjusted series. These data represent a smoothed version of the seasonally adjusted time series and provide information on longer-term movements, including changes in direction underlying the series. For information on trend-cycle data, see the page Trend-cycle estimates – Frequently asked questions.
Data for the current reference month are preliminary. Usually, unadjusted data are revised for the previous two months, and seasonally adjusted data are revised for the previous three months. Both seasonally adjusted data and trend-cycle estimates are subject to revision as additional observations become available. These revisions could be large and could even lead to a reversal of movement, especially for reference months near the end of the series or during periods of economic disruption.
Find these data and more statistics on the Business and consumer services and culture statistics portal.
Reference
Data table: : 21-10-0019-01.
- Note: some data tables may best be viewed on desktop.
Definitions, data sources and methods: survey number 2419.
Previous release: Food services and drinking places, September 2024.
Contact information
For more information, or to enquire about the concepts, methods or data quality of this release, contact us (toll-free 1-800-263-1136; 514-283-8300; infostats@statcan.gc.ca) or Media Relations (statcan.mediahotline-ligneinfomedias.statcan@statcan.gc.ca).