

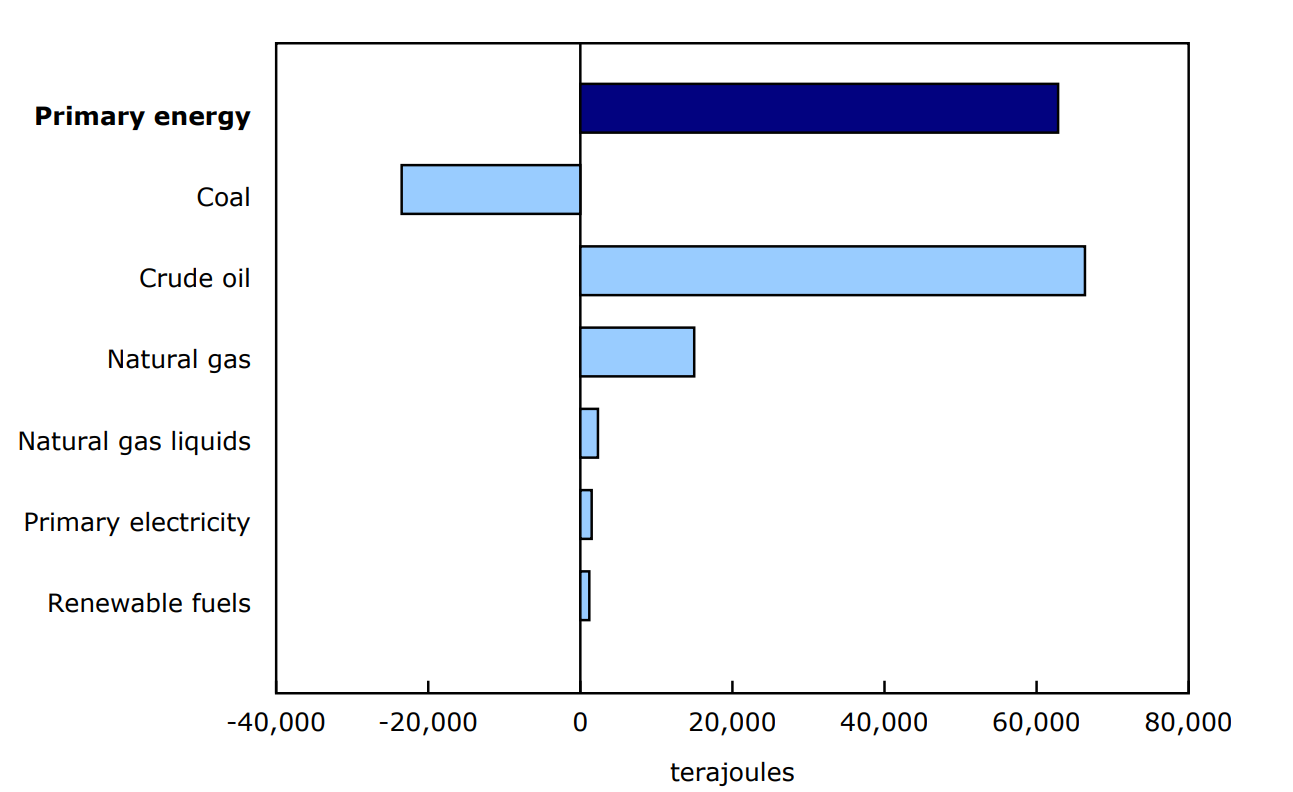
Primary energy production increased 3.2% year over year in October, with crude oil (+6.9%) leading the gain. Secondary energy production rose 12.0% for the month, led by refined petroleum products (+12.6%).
Chart 1: Year-over-year contribution to change in primary energy production
Description - Chart 1
Data table: Year-over-year contribution to change in primary energy production
Source: Table 25-10-0079-01.
For more information on energy in Canada, including production, consumption, international trade and much more, visit the Canadian Centre for Energy Information portal and follow #energynews on social media.
Record crude oil movements from Alberta to British Columbia
Production of crude oil and equivalent products rose 6.9% to 26.1 million cubic metres in October, marking the 13th consecutive monthly year-over-year gain.
All types of crude oil production were up in October, but the overall increase was driven by oil sands extraction, which rose 9.0% to 17.3 million cubic metres. Following turnarounds in September, production of synthetic crude oil climbed 19.1% year over year to 6.2 million cubic metres in October, while production of crude bitumen rose 4.1%, reaching a new monthly record of 11.1 million cubic metres.
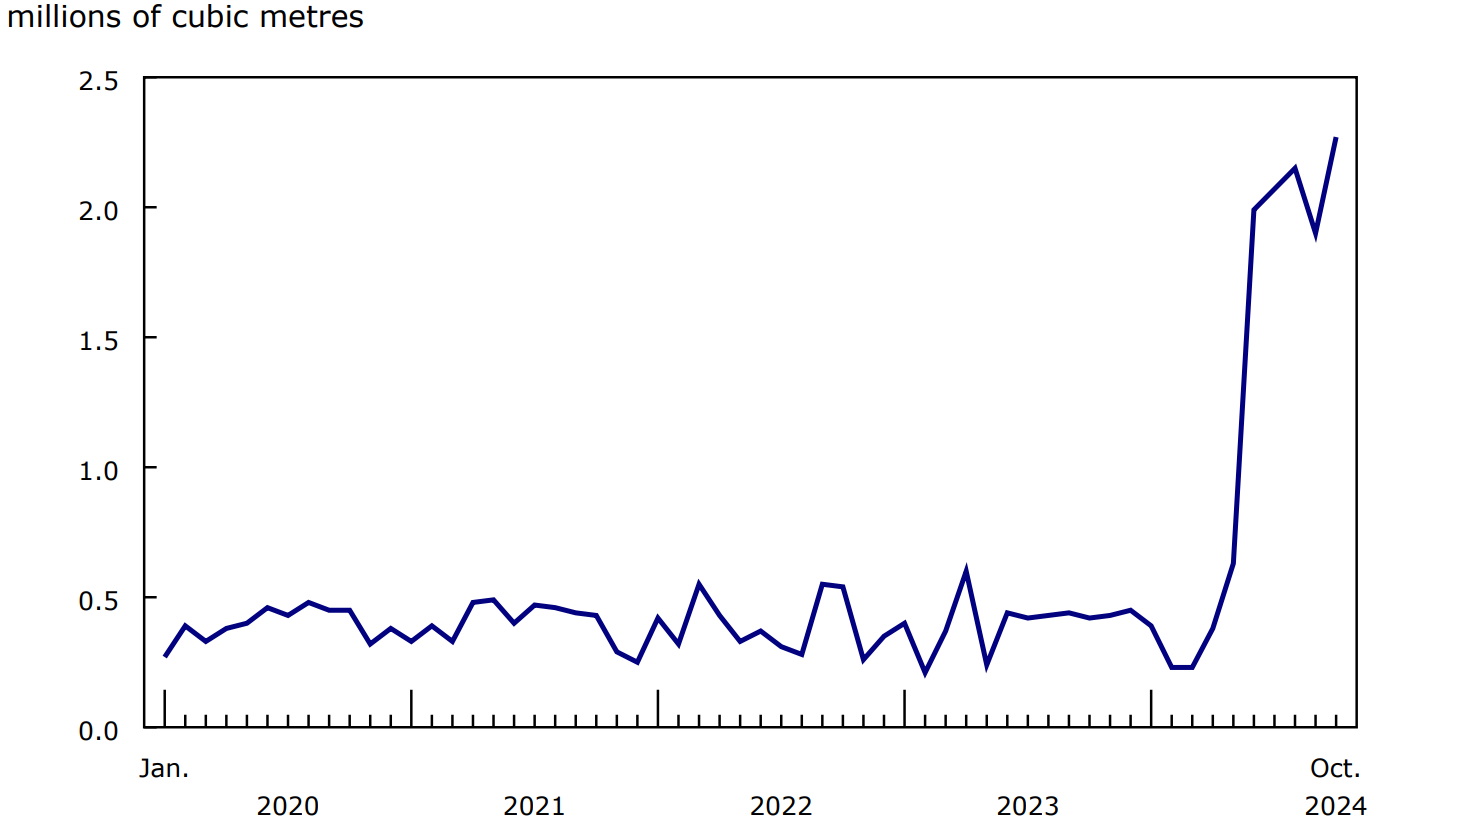
Pipeline movements of crude oil from Alberta to British Columbia sharply increased by 436.1% year over year to 2.3 million cubic metres in October. This was the highest monthly volume since the expansion of the Trans Mountain pipeline.
Chart 2: Movements of crude oil from Alberta to British Columbia
Description - Chart 2
Data table: Movements of crude oil from Alberta to British Columbia
Source: Table 25-10-0077-01.
The newly expanded Trans Mountain Pipeline began operation in May 2024, transporting crude oil and refined petroleum products from Edmonton, Alberta, to the port of Burnaby, British Columbia. This expansion nearly tripled the capacity of the existing line built in 1953, opening more Canadian crude oil for export to the global market. As a result, year-over-year rates of change are expected to be significant for some data series through to April 2025.
Closing inventories of natural gas set new series high in October
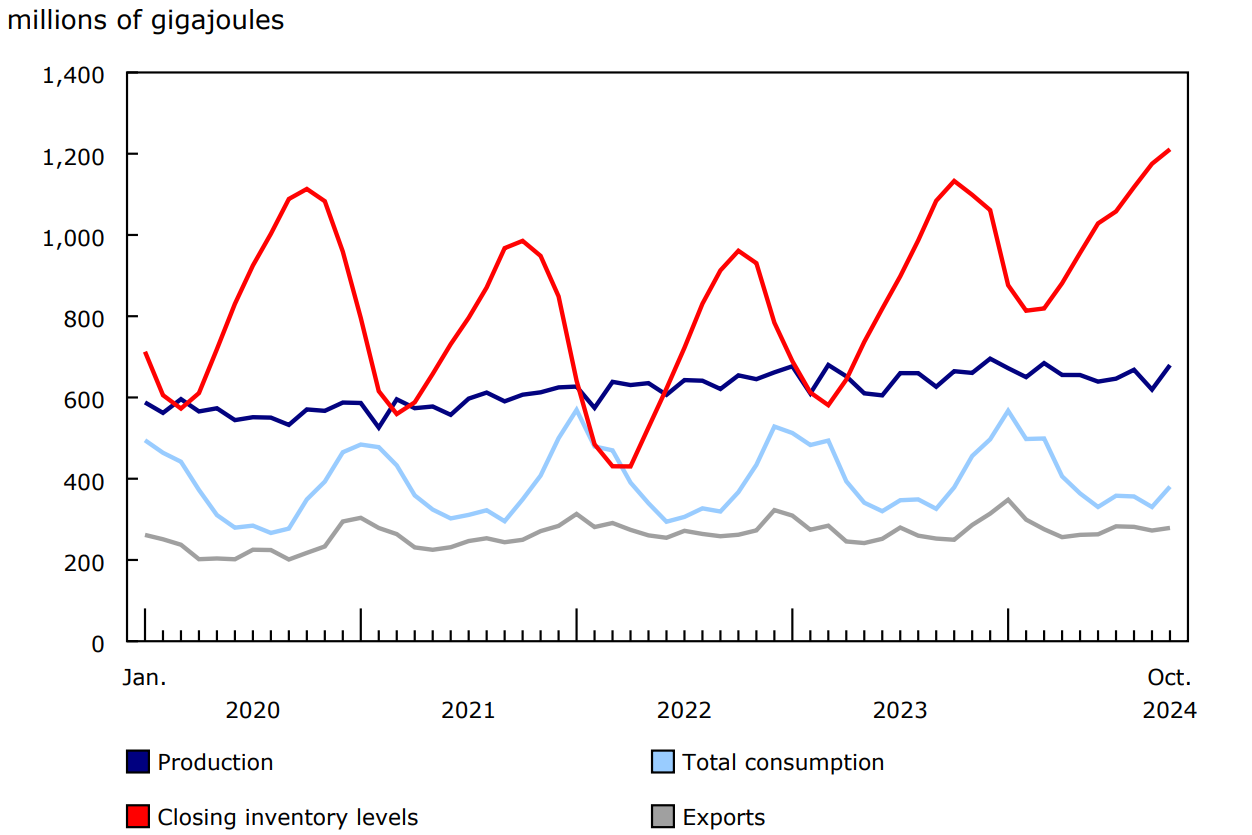
Closing inventories of natural gas held in Canadian facilities reached 1.2 billion gigajoules in October (+6.9% year over year), setting a record high for the third consecutive month. A warmer-than-usual winter in 2024, coupled with elevated production levels, resulted in larger amounts of natural gas being injected to storage. In October, storage levels were 18.1% higher than the five-year average for the month.
Production of natural gas rose 2.3% year over year to 679.6 million gigajoules in October, while deliveries of natural gas to consumers edged up 0.5% to 380.4 million gigajoules, and exports rose 11.7%.
Chart 3: Canadian natural gas production, total consumption, closing inventory levels and exports
Description - Chart 3
Data table: Canadian natural gas production, total consumption, closing inventory levels and exports
Source: Table 25-10-0055-01.
Electricity generation climbs in October
Total electricity generation in Canada rose 2.4% year over year to 47.3 million megawatt-hours (MWh) in October. Increases in generation from wind (+24.2%) and combustible (+6.9%) generation more than offset declines from nuclear (-6.5%) and hydroelectric (-0.7%) generation.
Exports of electricity to the United States were down 5.6% year over year to 2.7 million MWh in October, while imports fell 33.9% to 1.4 million MWh.
Chart 4: Total electricity generation in Canada
Description - Chart 4
Data table: Total electricity generation in Canada
Source: Table 25-10-0015-01.
Production of finished petroleum products up in October
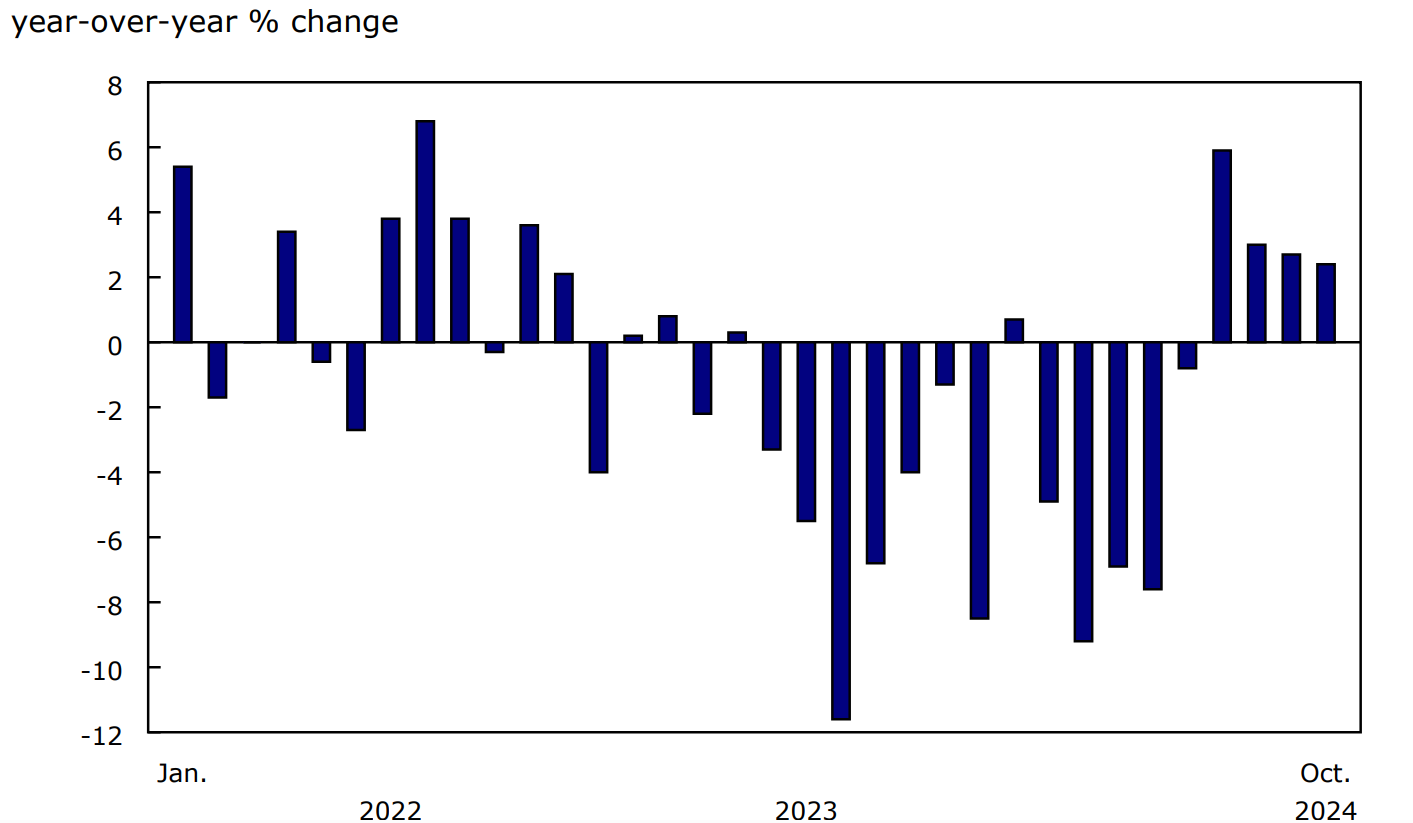
Production of finished petroleum products sharply increased by 13.7% to 10.0 million cubic metres in October, the largest year-over-year increase since August 2021 (+15.7%). Production of distillate fuel oil (+13.2%), kerosene-type jet fuel (+78.0%) and finished motor gasoline (+4.1%) were all up in October 2024. The strong production numbers for October coincided with an increase in prices for finished petroleum products. Additionally, in October 2023, production was reduced due in part to low prices and maintenance at some production facilities.
Consumption of finished petroleum products climbed 2.3% year over year in October 2024 to 8.7 million cubic metres.
Chart 5: Production of finished petroleum products
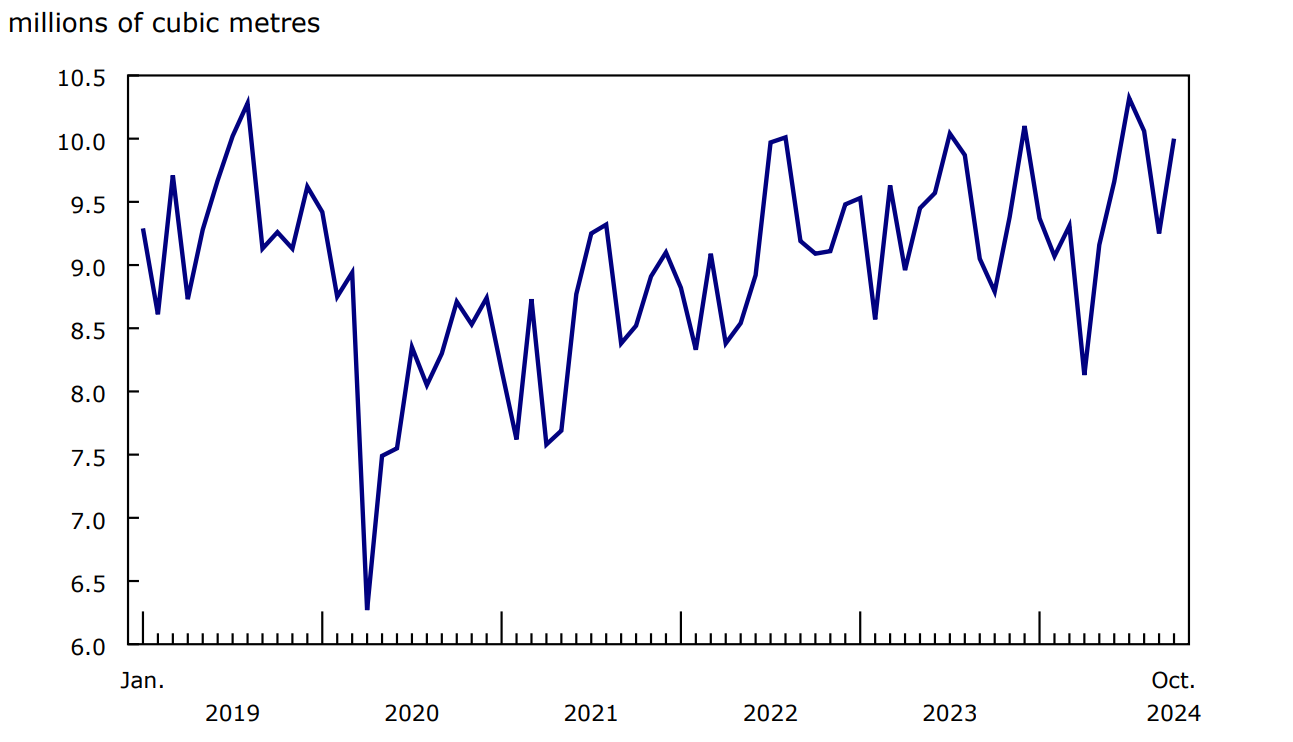
Description - Chart 5
Data table: Production of finished petroleum products
Source: Table 25-10-0081-01.
Note to readers
The Energy statistics program relies on data collected from respondents and administrative sources.
The Consolidated energy statistics table (25-10-0079-01) presents monthly data on primary and secondary energy by fuel type (crude oil, natural gas, electricity, coal, etc.) in terajoules and supply and demand characteristics (production, exports, imports, etc.) for Canada. For more information, consult the Consolidated Energy Statistics Table: User Guide.
Data in this release are not seasonally adjusted.
The following survey programs support the "Energy statistics" release:
- Crude oil and natural gas (survey number 2198; tables 25-10-0036-01, 25-10-0055-01 and 25-10-0063-01)
- Energy transportation and storage (survey number 5300; tables 25-10-0075-01 and 25-10-0077-01)
- Natural gas transmission, storage and distribution (survey numbers 2149, 5210 and 5215; tables 25-10-0057-01, 25-10-0058-01 and 25-10-0059-01)
- Refined petroleum products (survey number 2150; table 25-10-0081-01).
- Renewable fuel and hydrogen (survey number 5294; table 25-10-0082-01)
- Electric power statistics (survey number 2151; tables 25-10-0015-01 and 25-10-0016-01)
- Coal and coke statistics (survey numbers 2147 and 2003; tables 25-10-0045-01 and 25-10-0046-01).
Revisions
Energy survey data and administrative sources are subject to revisions to reflect new or updated information. Historical revisions will also be processed periodically.
Occasionally, data from Environment and Climate Change Canada are referenced by the Energy Statistics Program using Cooling Degree Days (CDDs) or Heating Degree Days (HDDs) as a measure of temperature. CDDs reflect the relationship between outdoor temperatures and the need to cool indoors to maintain room temperature. As temperatures outside rise, the number of CDDs increases. HDDs are the opposite and reflect the need to heat indoors to maintain room temperature. As temperatures outside fall, the number of HDDs increases.
Contact information
For more information, or to enquire about the concepts, methods or data quality of this release, contact us (toll-free 1-800-263-1136; 514-283-8300; infostats@statcan.gc.ca) or Media Relations (statcan.mediahotline-ligneinfomedias.statcan@statcan.gc.ca).