

In November, Canada's merchandise exports increased 2.2% and imports rose 1.8%. As a result, Canada's merchandise trade deficit with the world narrowed from $544 million in October to $323 million in November. These recent narrow trade deficits are within the typical bounds for monthly revisions to imports and exports.
Due to the implementation of the Canada Border Services Agency (CBSA) Assessment and Revenue Management (CARM) digital initiative and delays in the receipt of merchandise import data at Statistics Canada, estimates were added to the collected values in order to produce a more complete picture of Canada's import activity in October and November. Please see the Note to readers below for more information.
Consult the "International trade monthly interactive dashboard" to explore the most recent results of Canada's international trade in an interactive format.
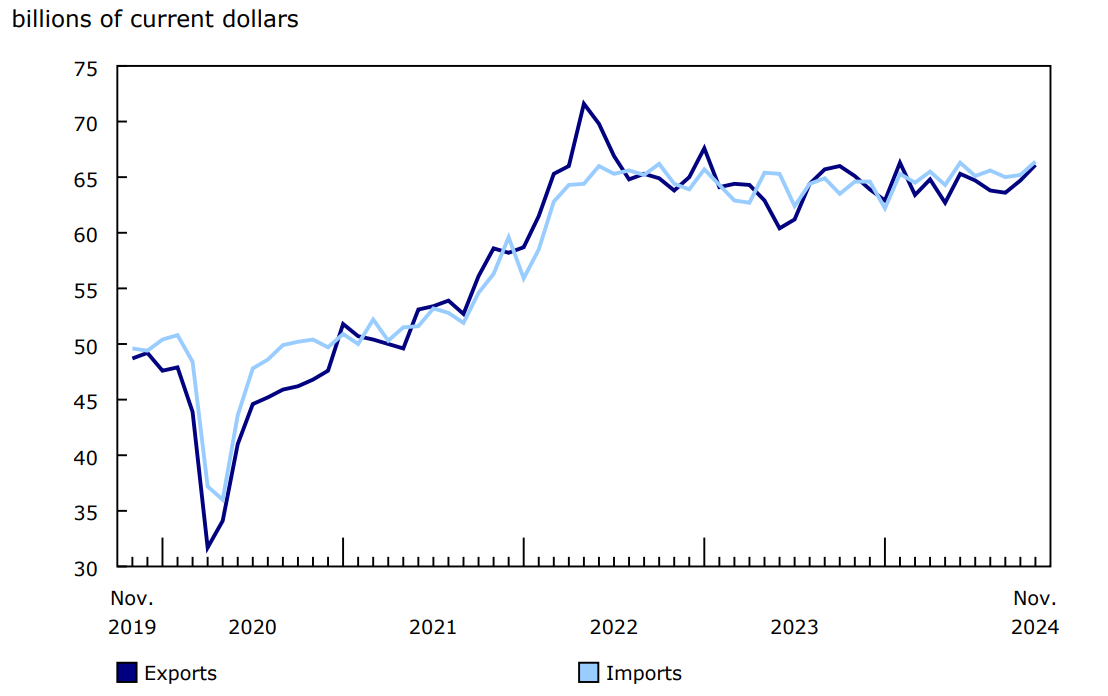
Chart 1: Merchandise exports and imports
Description - Chart 1
Data table: Merchandise exports and imports
Note: Data are on a balance-of-payments basis and are seasonally adjusted.
Source: Table 12-10-0163-01.
The depreciation of the Canadian dollar and impacts on import and export values
A large proportion of import and export transactions are completed in US dollars and must be converted to Canadian dollars to compile monthly trade statistics. All other things being equal, when the Canadian dollar depreciates against the US dollar, monthly trade values expressed in Canadian dollars are higher.
The average value of the Canadian dollar decreased 1.1 cents US in October, and then an additional 1.1 cents US in November. For those two months combined, exports were up 3.9%, while imports increased 2.2%. When expressed in US dollars, Canadian exports increased 0.8% from September to November, while imports fell 1.0%.
Second consecutive increase in exports
Following a 1.7% increase in October, total exports rose 2.2% in November. The gain was broad-based, with 9 of the 11 product sections rising. Higher prices were partly responsible for the monthly increase in exports; in real (or volume) terms, total exports rose 0.5%.
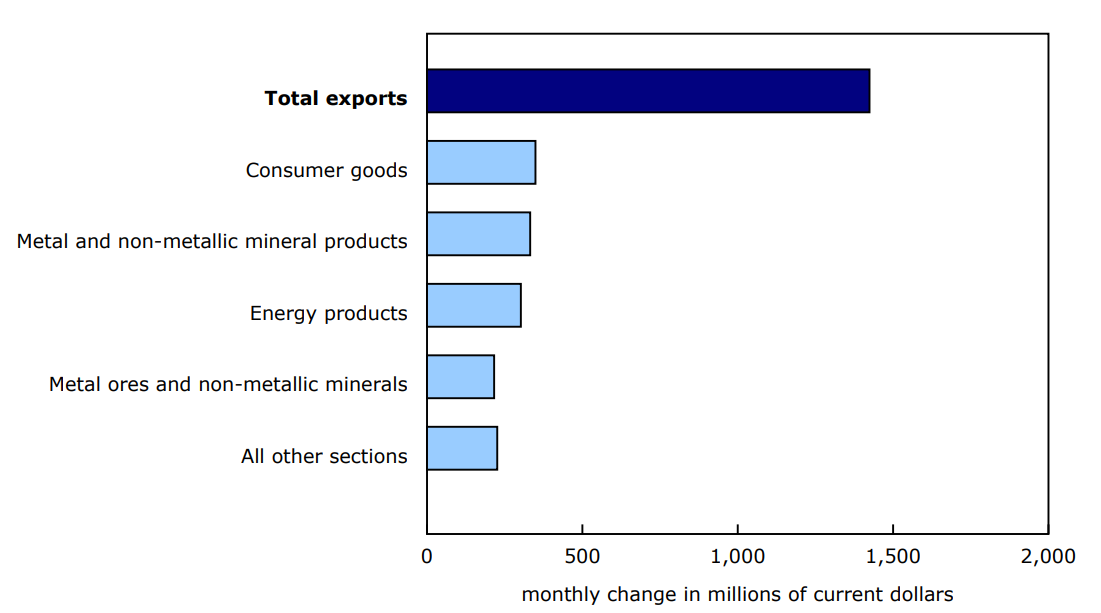
Chart 2: Contribution to the monthly change in exports, by product, November 2024
Description - Chart 2
Data table: Contribution to the monthly change in exports, by product, November 2024
Note: Data are on a balance-of-payments basis and are seasonally adjusted.
Source: Table 12-10-0163-01.
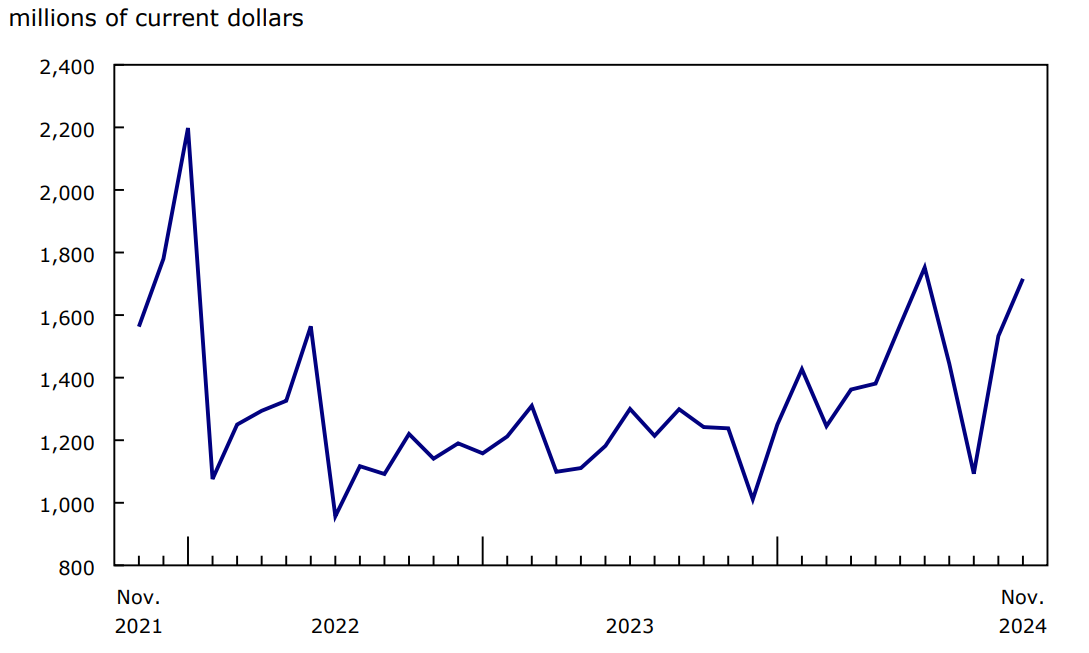
Exports of consumer goods rose 4.4% in November, a second consecutive monthly increase. As was the case in October, exports of pharmaceutical products (+11.9%) contributed the most to the increase in the product section, mainly because of large shipments of medicaments to the United States. Exports of pharmaceutical products from January to November 2024 were up 18.0% compared with the same period in 2023. Exports of miscellaneous goods and supplies also contributed to the monthly increase in November 2024, mainly because of higher exports of battery packs for electric vehicles to the United States.
Chart 3: Exports of pharmaceutical and medicinal products
Description - Chart 3
Data table: Exports of pharmaceutical and medicinal products
Note: Data are on a balance-of-payments basis and are seasonally adjusted.
Source: Table 12-10-0163-01.
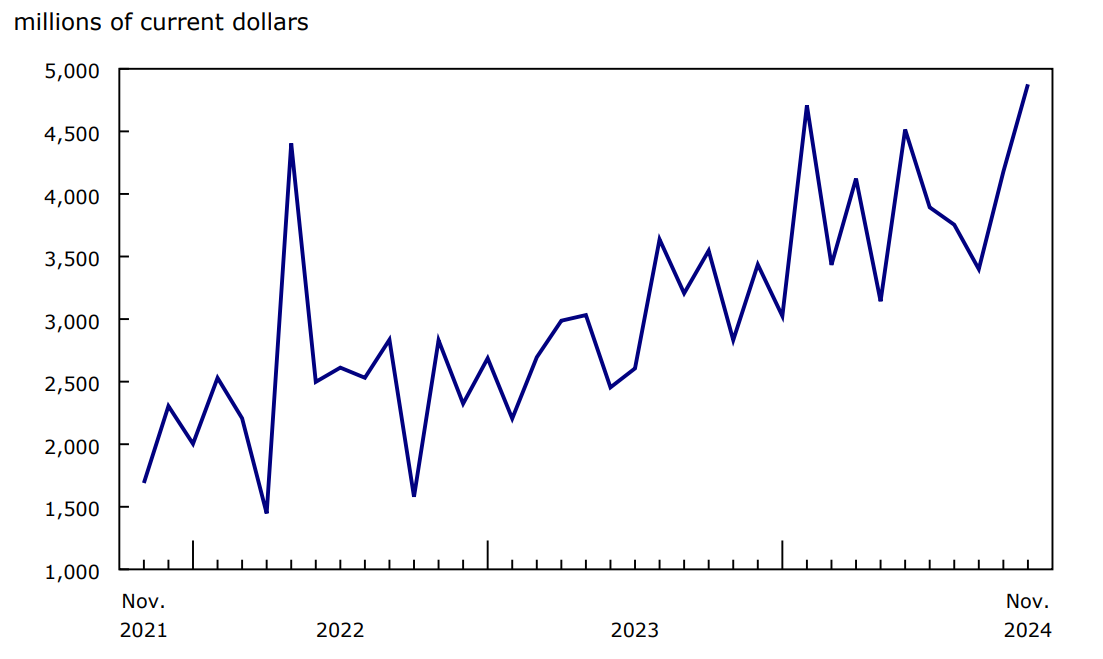
Exports of metal and non-metallic mineral products rose 3.8% in November. Exports of unwrought gold, silver, and platinum group metals, and their alloys—a category largely composed of unwrought gold—were up 16.7% to a record $4.9 billion, contributing the most to the increase in this product section. Higher exports of refined gold and higher transfers of gold to the United States were mostly responsible for the gain. Partially offsetting the increase in November were exports of unwrought nickel and nickel alloys, down 40.0% on lower shipments of nickel mattes to Norway. This decrease coincided with a recent slowdown in port activity in eastern Canada.
Chart 4: Exports of unwrought gold, silver, and platinum group metals, and their alloys
Description - Chart 4
Data table: Exports of unwrought gold, silver, and platinum group metals, and their alloys
Note: Data are on a balance-of-payments basis and are seasonally adjusted.
Source: Table 12-10-0163-01.
Exports of energy products increased 2.1% in November, mostly because of higher exports of crude oil (+4.8%), which were up on higher prices. While the month of November has seen large declines in crude oil prices in the past, these prices were relatively stable in November 2024, leading to a seasonally adjusted increase in Canadian crude oil export prices for that month.
Following a decrease of 7.0% in October, exports of metal ores and non-metallic minerals increased 10.5% in November. Exports of copper ores and concentrates (+38.7%) contributed the most to the rise in the product section, mainly on higher exports to Asia. Exports of iron ores and concentrates (+12.2%) and other metal ores and concentrates (+40.3%) also increased in November.
Imports post an increase in November
After edging up 0.3% in October, total imports rose 1.8% in November. The largest contributors to the monthly increase were imports of consumer goods (+3.8%); basic and industrial chemical, plastic and rubber products (+4.3%); industrial machinery, equipment and parts (+3.0%) and metal and non-metallic mineral products (+3.2%).
Statistics on imports are primarily based on administrative data from the CBSA and are generally not subject to significant estimation. However, given delays in the receipt of October and November import data due to the CARM digital initiative, estimated values were added to a majority of the product categories to compensate for the outstanding transactions. Users of merchandise import statistics should exercise caution when analyzing and interpreting the data and expect significant revisions to the results for these months in future publications. Please see the Note to readers below for more information.
The trade surplus with the United States widens, as does the deficit with countries other than the United States
Exports to the United States rose 6.8% in November, while imports increased 4.1%. As a result, Canada's trade surplus with the United States widened from $6.6 billion in October to $8.2 billion in November.
Exports to countries other than the United States decreased 10.3% in November, driven by lower exports of unwrought gold to Hong Kong as well as of nickel to Norway. Imports from countries other than the United States were down 1.9% in November. Canada's trade deficit with countries other than the United States widened from $7.2 billion in October to $8.5 billion in November.
Chart 5: International merchandise trade balance
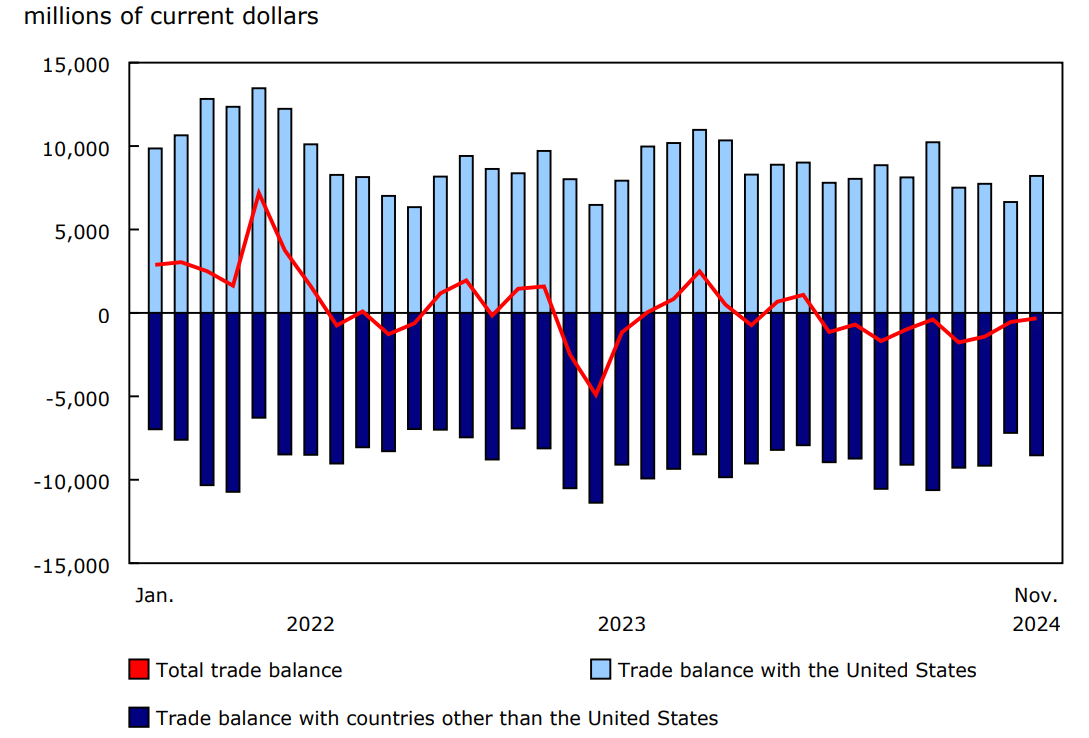
Description - Chart 5
Data table: International merchandise trade balance
Note: Data are on a balance-of-payments basis and are seasonally adjusted.
Source: Table 12-10-0011-01.
Revisions to October merchandise export and import data
Imports in October, originally reported at $65.1 billion in the previous release, were revised to $65.2 billion in the current reference month's release. Exports in October, originally reported at $64.2 billion in the previous release, were revised to $64.7 billion in the current reference month's release.
Monthly trade in services
In November, monthly service exports were down 0.2% to $18.2 billion. Meanwhile, imports of services edged down 0.1% to $18.5 billion.
When international trade in goods and services are combined, exports rose 1.7% to $84.3 billion in November, while imports increased 1.4% to $84.9 billion. As a result, Canada's total trade deficit with the world went from $850 million in October to $642 million in November.
Note to readers
Information on concepts and methods used for the monthly release of Canada's international merchandise trade is now available online. Please see "Notes on the monthly release of Canadian international merchandise trade" for more details.
For a detailed overview of the Canadian International Merchandise Trade program, please see "Guide to Canadian International Merchandise Trade Statistics."
Important notice to users of import statistics following the implementation of CBSA Assessment and Revenue Management (CARM)
Statistics Canada's primary data source used in the compilation of import statistics is undergoing a major transition as a result of the Canada Border Services Agency (CBSA) Assessment and Revenue Management (CARM) digital initiative, implemented on October 21, 2024. Despite improved coverage since the last publication of Canadian International Merchandise Trade statistics, delays in the receipt of import data at Statistics Canada continue to impact the completeness and quality of import statistics.
Analysis indicates that additional data volumes will be received for the reference month of November and also October after Statistics Canada's deadline for monthly collection. While strategies for producing estimates to account for the late receipt of data have been enhanced to maximize the comprehensiveness of merchandise trade indicators for these months, Statistics Canada's ability to respond to these issues is limited.
Canadian International Merchandise Trade statistics are produced on both a customs basis and a balance of payments basis. Customs basis statistics are highly detailed and multidimensional, while more aggregated balance-of-payments basis statistics are aligned with Canada's macroeconomic accounting framework and are the source for key indicators related to merchandise trade. Within the customs basis statistics, the use of estimates is limited compared with the balance-of-payments basis statistics, relying on placeholder estimates within the special transactions category to partially account for data expected to be received at a later date. Within balance-of-payments basis statistics, estimation is more comprehensive in order to produce a more complete picture of Canada's import activity throughout the various categories for the affected months.
In light of the issues that are temporarily impacting the completeness and quality of international merchandise trade statistics, users should exercise caution and expect material revisions until the situation stabilizes, notably for import statistics on a customs basis. Statistics Canada will provide further updates as new information becomes available.
Canadian international merchandise trade by mode of transport
Today, Statistics Canada is introducing a new data table for Canada's international merchandise trade by mode of transport, offering further insight into how goods move across Canada's borders. Table 12-10-0177-01 provides a breakdown of imports and exports by mode of transport, by the trade variant of the North American Product Classification System 2022, as well as by Canada's principal trading partners.
Real-time data table
The real-time data table 12-10-0165-01 will be updated on January 20.
Contact information
For more information, or to enquire about the concepts, methods or data quality of this release, contact us (toll-free 1-800-263-1136; 514-283-8300; infostats@statcan.gc.ca) or Media Relations (statcan.mediahotline-ligneinfomedias.statcan@statcan.gc.ca).