

Highlights
In November, 143.3 million passenger trips were taken on urban transit networks in Canada, recovering 87.0% of the pre-COVID-19 pandemic level from November 2019.
Data on total passenger trips and operating revenue for selected urban transit agencies are available in table 23-10-0307-01.
Ridership recovery stalls
In November 2024, transit riders took an estimated 143.3 million trips on Canada's urban transit networks, up 6.2% (+8.4 million trips) compared with November 2023.
Nationally, ridership in November 2024 recovered to 87.0% of its pre-pandemic level from November 2019, the third highest rate of recovery since the start of the pandemic. However, this remains 21.5 million fewer passenger trips compared with the same month in 2019.
In the two years prior to the pandemic (2018 and 2019), ridership dipped by roughly 2% from October to November. In 2024, November ridership was down 2.6% from October.
Revenue still lags
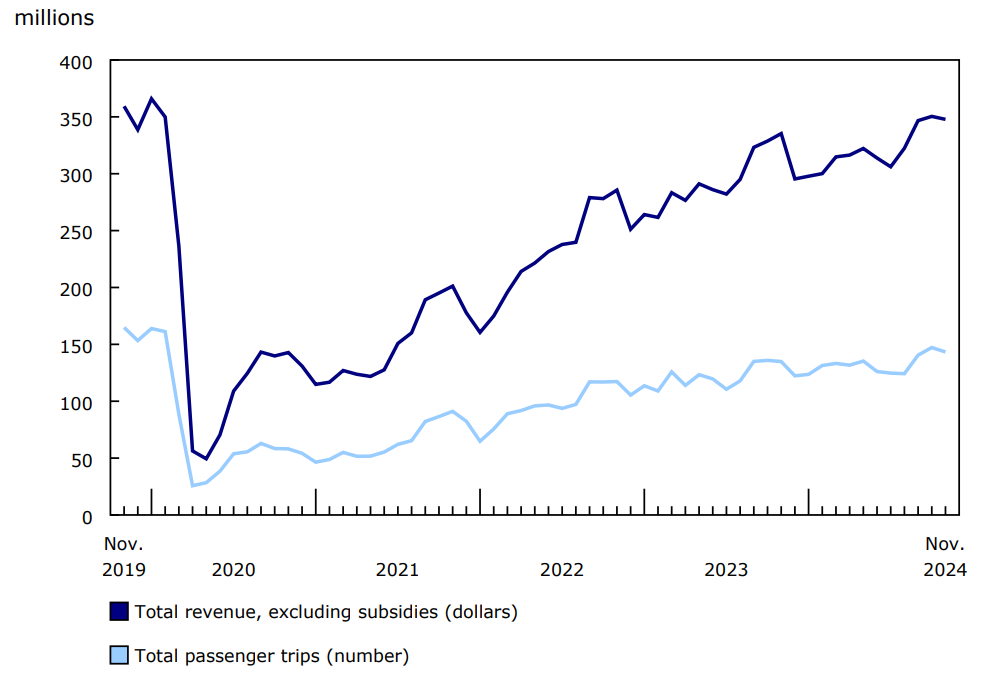
In November 2024, transit agency operating revenue (excluding subsidies) was up 3.7% from the same month in 2023, reaching $347.8 million, albeit $11.5 million lower than the pre-pandemic level in November 2019.
Chart 1: Urban public transit operating revenue and passenger trips, monthly, 2019 to 2024
Description - Chart 1
Data table: (Urban public transit operating revenue and passenger trips, monthly, 2019 to 2024
Source: Table 23-10-0251-01.
Note to readers
Statistics Canada is publishing more detail from the Monthly Passenger Bus and Urban Transit Survey. The new table 23-10-0307-01—Passenger bus and urban transit statistics, by Urban transit agency—includes operating revenue and ridership at the city level for selected transit agencies. Statistics Canada appreciates the cooperation of the 15 transit agencies in making this information available to Canadians.
Survey data are revised on a monthly basis to reflect new and updated information.
The data in this release are not seasonally adjusted.
This survey collects data on operating revenue (excluding subsidies) and the number of passenger trips from a panel of urban transit companies that represents at least 75% of revenue in each province and territory. Note that the panel is adjusted annually to maintain the 75% coverage and could differ slightly from what it was in the same month the previous year.
One-time payments from secondary and post-secondary institutions for academic-year student passes are typically reported as revenue during the early fall and early winter months.
Data prior to January 2017 can be found in table 23-10-0078-01.
Random tabular adjustment
The random tabular adjustment (RTA) technique, which aims to increase the amount of data made available to users while protecting the confidentiality of respondents, was applied to the totals of the Monthly Passenger Bus and Urban Transit Survey.
Using RTA, Statistics Canada identifies sensitive data and randomly adjusts values rather than suppressing them. The size of the adjustment is calculated to protect respondent confidentiality.
The Transportation Data and Information Hub, a web portal developed jointly by Statistics Canada and Transport Canada, provides Canadians with online access to comprehensive statistics and measures on the country's transportation sector.
Reference
Data tables: 23-10-0251-01 and 23-10-0307-01.
- Note: some data tables may best be viewed on desktop.
Definitions, data sources and methods: survey number 2745.
Previous release: Urban public transit, October 2024.
Contact information
For more information, or to enquire about the concepts, methods or data quality of this release, contact us (toll-free 1-800-263-1136; 514-283-8300; infostats@statcan.gc.ca) or Media Relations (statcan.mediahotline-ligneinfomedias.statcan@statcan.gc.ca).