

In January, the preliminary number of international arrivals to Canada by air and automobile reached 4.6 million, up 1.9% from January 2024.
Statistics Canada released the article, "Tourism in the territories: Visits, expenditures, and getting around" on December 18, 2024.
To further explore current and historical data in an interactive format, see Frontier Counts: Interactive Dashboard.
Non-resident trips to Canada by air
In January 2025, non-resident arrivals in Canada by air totalled 450,100, up 4.3% year over year (Chart 1). These include arrivals by US residents (217,700), up by 10.2% from the same month in 2024, and residents of countries other than the United States (232,400), down by 0.7%. The highest number of non-resident arrivals per day (21,600) was on Friday, January 17, 2025, before Martin Luther King Jr. Day, which was observed on Monday, January 20 in the United States, surpassing the daily average for the other Fridays during the month by 41.6%.
Chart 1: Non-resident trips to Canada by commercial aircraft, January, 2019 to 2025
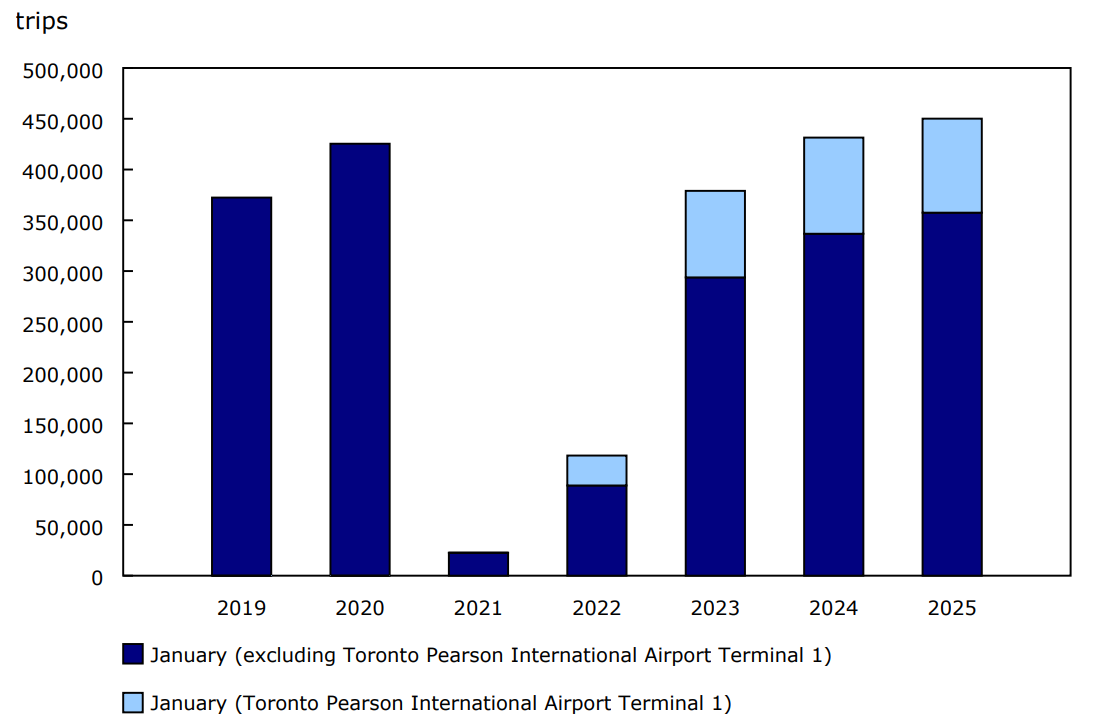
Description - Chart 1
Data table: Non-resident trips to Canada by commercial aircraft, January, 2019 to 2025
Source: Table 24-10-0056-01.
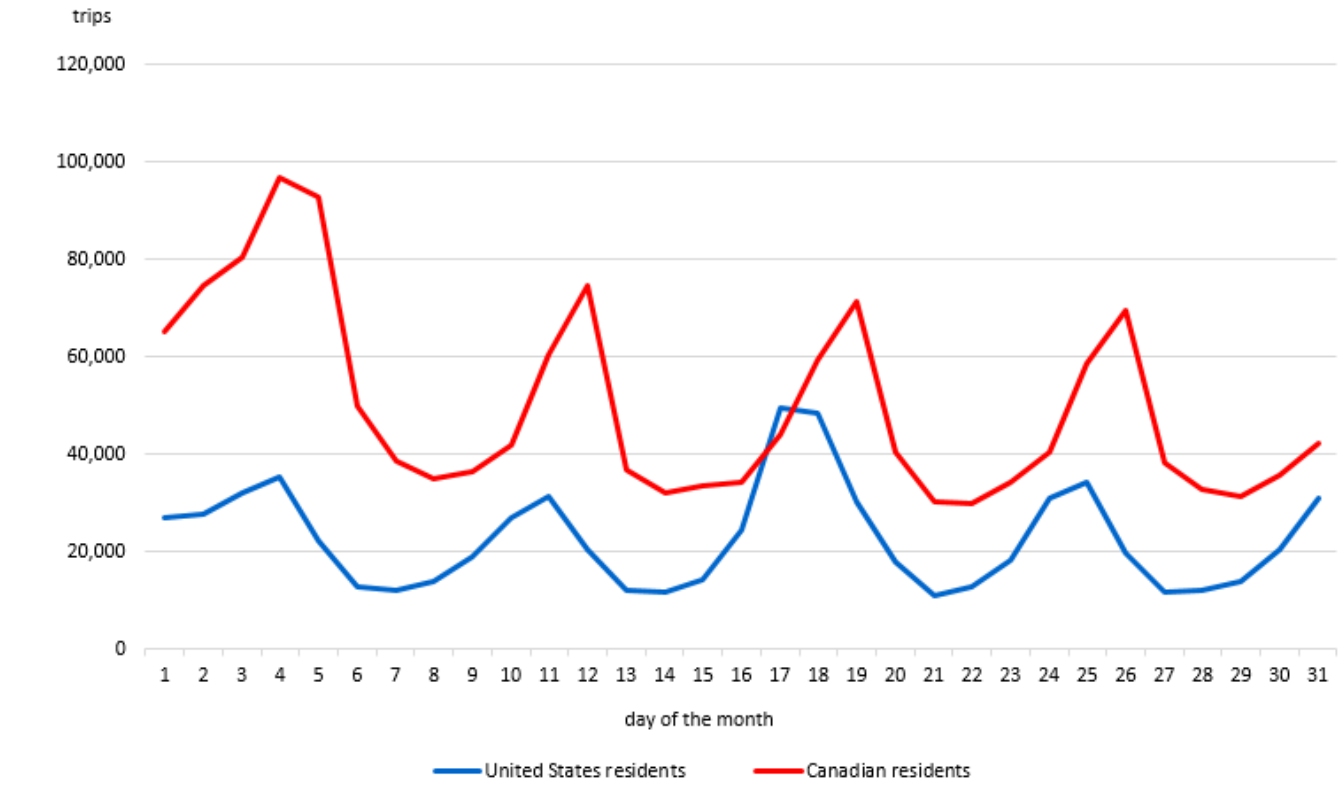
Chart 2: Trips to Canada by commercial aircraft, by country of residence, January 2025
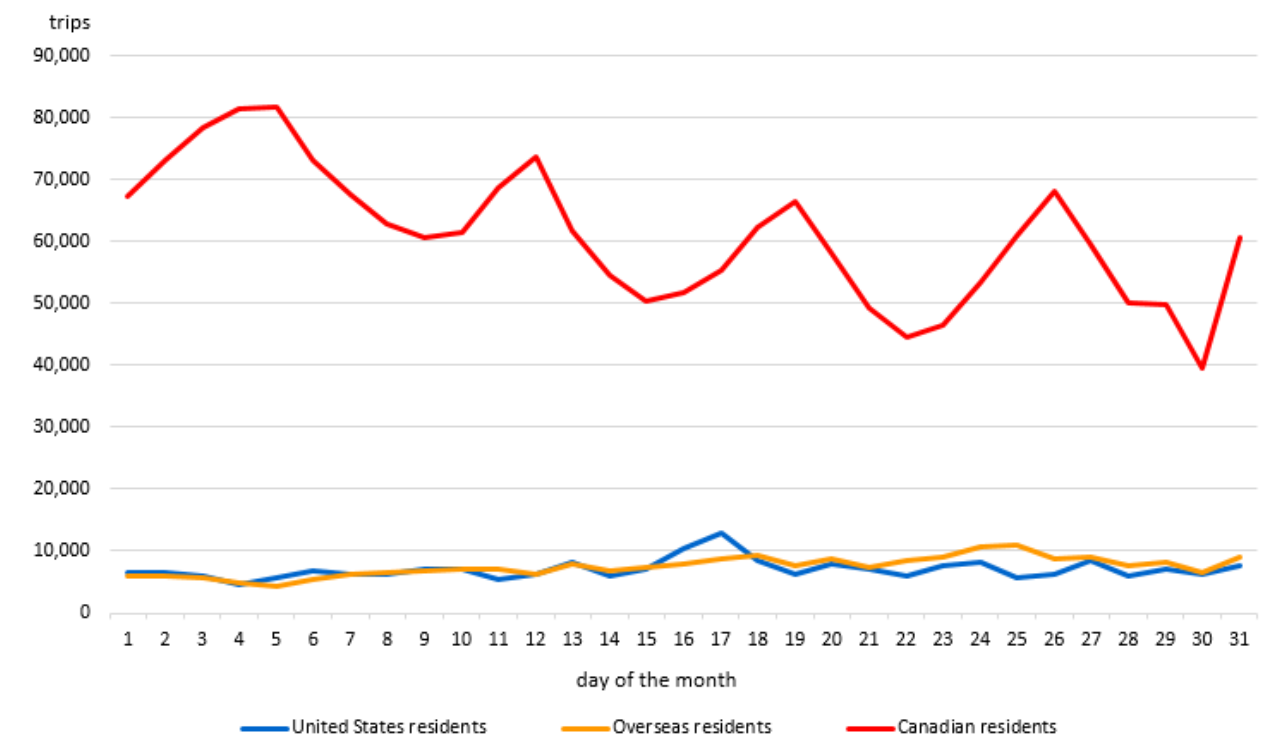
Description - Chart 2
The title of the chart is "Trips to Canada by commercial aircraft, by country of residence, January 2025"
This is a line chart.
The vertical axis shows the number of trips, from 0 to 90,000, by increments of 10,000.
The horizontal axis shows the days from January 1 to 31, by increments of one day.
There are three series in this chart.
The first series is United States residents. The lowest point on this line is 4,611 on January 4, and the highest point on this line is 12,847 on January 17.
The second series is overseas residents. The lowest point on this line is 4,341 on January 5, and the highest point on this line is 10,921 on January 25.
The third series is Canadian residents. The lowest point on this line is 39,644 on January 30, and the highest point on this line is 81,790 on January 5.
Source: Table 24-10-0056-01.
Canadian-resident return trips by air
In January, Canadian-resident return trips by air stood at 1.9 million, down 2.8% from the same month one year earlier (Chart 3). The highest number of arrivals was recorded during the first week (January 1 to 7, 2025—including New Year's Day) with a daily average of 74,600. For the remainder of the month, the daily average of arrivals decreased to 57,100.
Chart 3: Canadian-resident return trips from abroad by commercial aircraft, January, 2019 to 2025
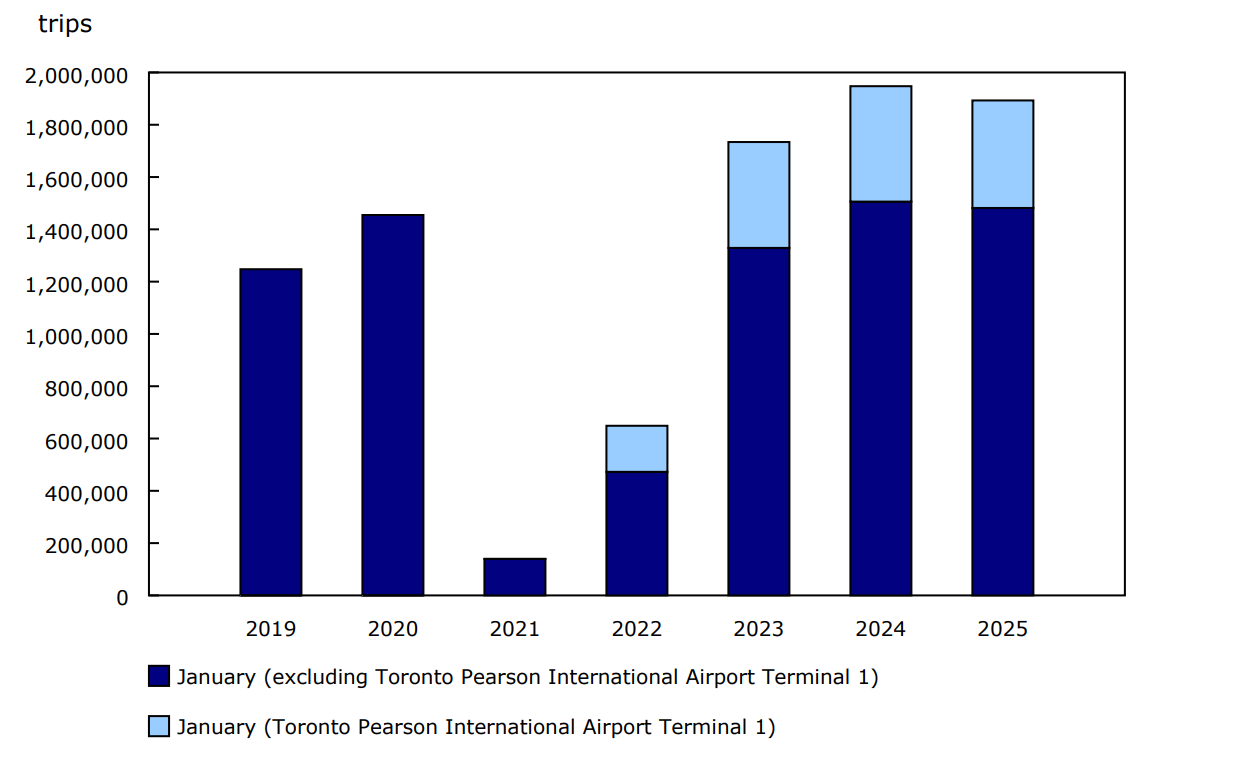
Description - Chart 3
Data table: Canadian-resident return trips from abroad by commercial aircraft, January, 2019 to 2025
Source: Table 24-10-0056-01.
US-resident trips to Canada by automobile
In January, the number of US-resident trips to Canada by automobile was 707,000, up 23.3% from the same month in 2024 (Chart 4). From Friday, January 17 to Monday, January 20, 2025 (Martin Luther King Jr. Day), a daily average of 36,600 US-resident arrivals was observed, which was 50.9% higher than the average for the remaining Friday-to-Monday periods in January.
Chart 4: United States-resident trips to Canada by automobile, January, 2019 to 2025
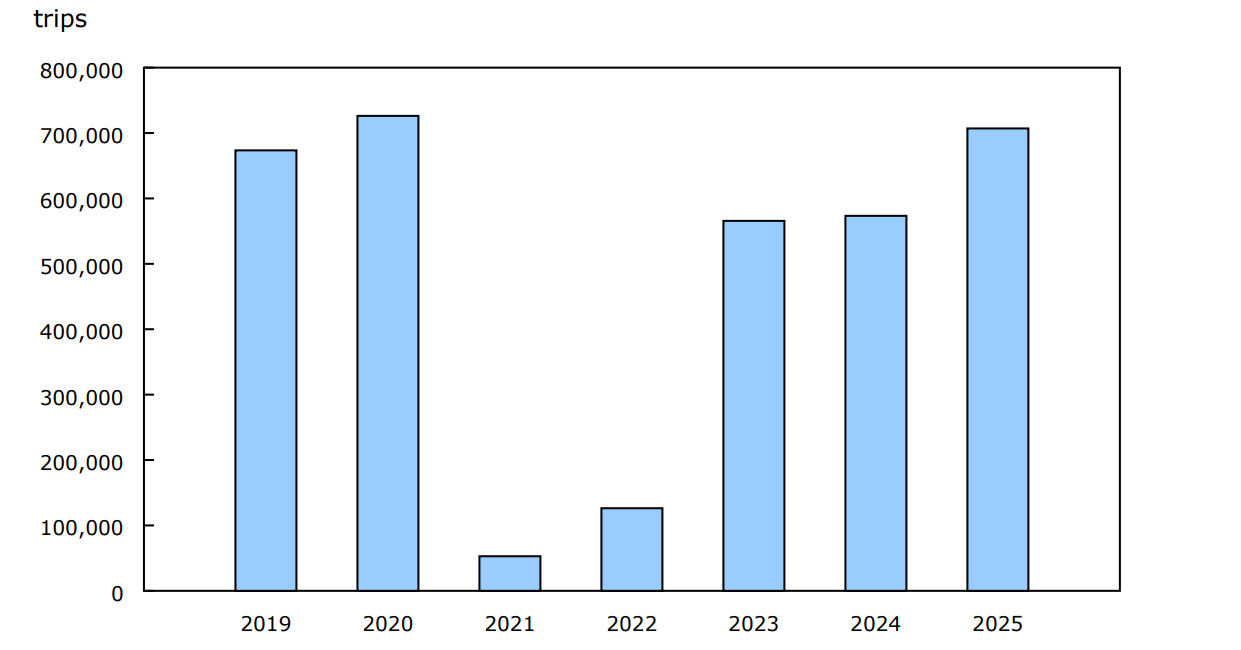
Description - Chart 4
Data table: United States-resident trips to Canada by automobile, January, 2019 to 2025
Source: Table 24-10-0057-01.
Chart 5: Trips to Canada by automobile, by country of residence, January 2025
Description - Chart 5
The title of the chart is "Trips to Canada by automobile, by country of residence, January 2025"
This is a line chart.
The vertical axis shows the number of trips, from 0 to 120,000 by increments of 20,000.
The horizontal axis shows the days from January 1 to 31, by increments of one day.
There are two series in this chart.
The first series is United States residents. The lowest point in this line is 10,997 on January 21, and the highest point in this line is 49,522 on January 17.
The second series is Canadian residents. The lowest point in this line is 29,757 on January 22, and the highest point in this line is 96,703 on January 4.
Source: Table: 24-10-0057-01.
Canadian-resident return trips by automobile
In January, the number of Canadian-resident return trips by automobile from visits to the United States totalled 1.5 million, a decline of 0.9% compared with the same month one year earlier (Chart 6). The first week of January (January 1 to 7, 2025—including New Year's Day) had the highest number of arrivals with a daily average of 71,200. This average was 63.7% higher than the daily average of arrivals for the remainder of the month.
Chart 6: Canadian-resident return trips from the United States by automobile, January, 2019 to 2025
Description - Chart 6
Data table: Canadian-resident return trips from the United States by automobile, January, 2019 to 2025
Source: Table 24-10-0057-01.
Note to readers
This release provides an early indicator of travel based on preliminary data on international arrivals to Canada for January 2025 for air and automobile (arrivals by automobile made by overseas residents are not included in this release). Complete counts will be available with the release of "Travel between Canada and other countries" on March 21, 2025.
For more information on concepts, definitions, data sources and methods, refer to Frontier Counts.
Data Sources
All counts of arrivals by air are from commercial aircraft and are produced exclusively using primary inspection kiosk (PIK) data received from the Canada Border Services Agency (CBSA). PIKs were deployed at Toronto Pearson International Airport Terminal 1 on June 22, 2021, and, as of July 2021, these arrivals are included in the total counts, which has consequently improved coverage. In 2024, PIKs captured 90.3% of all commercial air arrivals.
Counts of arrivals to the country by automobile through land ports equipped with the CBSA's automated Integrated Primary Inspection Line (IPIL) system represent a subset of US-resident trips and Canadian-resident return trips by automobile. In 2024, IPIL land ports captured 88.9% of all automobile entries.
Canadian Tourism Activity Tracker
Selected estimates from the Canadian Tourism Activity Tracker for November 2024 are available upon request. Please note that these data will no longer be produced after the December 2024 reference period. The data visualization tool, "Canadian Tourism Activity Tracker," and Table 24-10-0049-01, "Canadian Tourism Activity Tracker and Grouped Data Sources," will be archived. Users may contact tourism@statcan.gc.ca for additional information or to provide comments on the proposed change.
Reference
Data tables: Access the latest tables.
- Note: some data tables may best be viewed on desktop.
Definitions, data sources and methods: survey number 5005.
Previous release: Leading indicator of international arrivals to Canada, December 2024.
Next release: March 10, 2025.
Contact information
For more information, or to enquire about the concepts, methods or data quality of this release, contact us (toll-free 1-800-263-1136; 514-283-8300; infostats@statcan.gc.ca) or Media Relations (statcan.mediahotline-ligneinfomedias.statcan@statcan.gc.ca).