

Prices of products manufactured in Canada, as measured by the Industrial Product Price Index (IPPI), rose 1.6% month over month in January and increased 5.8% year over year. Prices of raw materials purchased by manufacturers operating in Canada, as measured by the Raw Materials Price Index (RMPI), grew 3.7% on a monthly basis and increased 11.8% year over year.
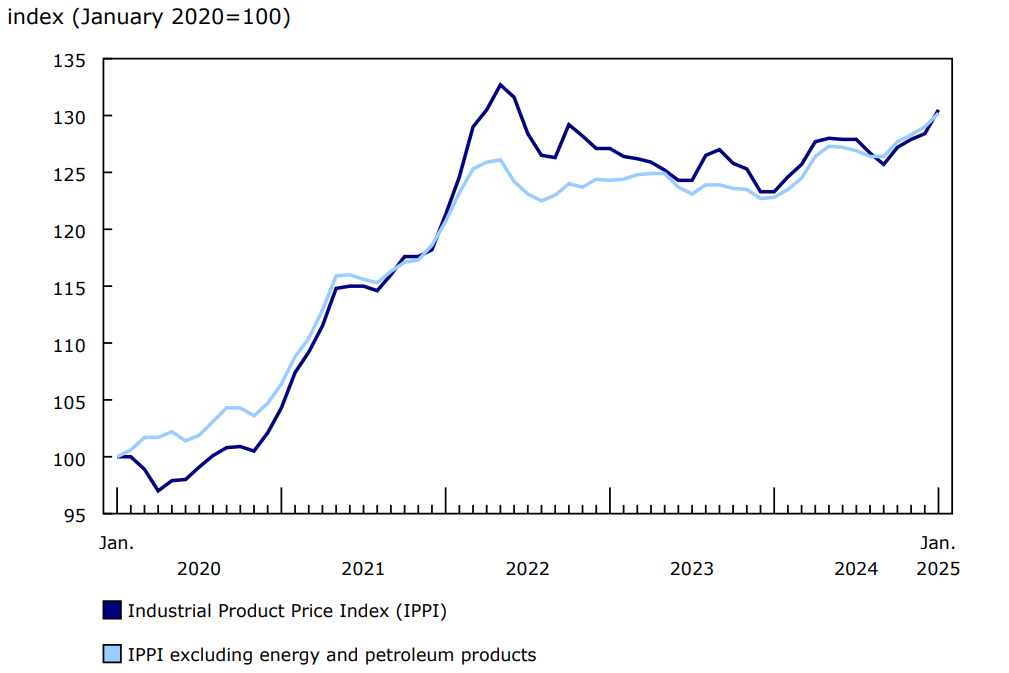
Chart 1: Prices for industrial products increase in January
Description - Chart 1
Data table: Prices for industrial products increase in January
Source: Table 18-10-0265-01.
Industrial Product Price Index
The IPPI rose 1.6% month over month in January. This was the fourth straight monthly increase and the largest gain since April 2024 (+1.6%). The January 2025 increase was driven by higher prices for energy and petroleum products. Excluding energy and petroleum products, the IPPI rose 0.9% on a monthly basis in January.
Prices for energy and petroleum products rose 7.0% month over month in January, following a 0.8% decline in December. This was the largest monthly increase for the group since August 2023 (+10.3%). The increase in January 2025 was mainly due to higher prices for refined petroleum energy products (+7.0%), especially diesel fuel (+9.4%) and finished motor gasoline (+5.4%). Higher prices for refined petroleum energy products were driven by an increase in the prices of conventional crude oil (+8.1%), their primary production input. Additionally, colder weather in January across Canada and some regions of the United States raised heating oil demand. This put upward pressure on prices, particularly for distillate fuels such as diesel.
Prices for fruit, vegetables, feed and other food products increased 2.1% month over month in January, led by higher prices for grain and oilseed products, n.e.c. (not elsewhere classified) (+5.2%). Indications of tightened oilseed supply helped push up oilseed product prices in January as challenging weather conditions in high-producing South American countries lowered production expectations.
Prices for chemicals and chemical products rose 2.3% month over month in January. This was the largest monthly growth for this commodity group since August 2023 (+3.3%). Prices for petrochemicals (+5.8%) were the primary driver of rising chemical prices in January 2025. As petrochemicals are mainly made from petroleum products, conventional crude oil prices (+8.1%) strongly influence their prices. Temporary petrochemical plant shutdowns in the United States gulf coast region associated with Winter Storm Enzo also pushed prices upward in January.
The prices of primary non-ferrous metal products were up 1.2% month over month in January. Higher prices for unwrought gold and gold alloys (+3.5%) were primarily responsible for this increase. This was the seventh consecutive monthly increase for unwrought gold and gold alloys. Gold prices hit a new record high in late January, spurred by safe-haven demand as investors weighed the possibility of the United States imposing new tariffs on international trade.
Year over year
In January, the IPPI increased 5.8% year over year, reaching its highest level over the previous 12 months. The year-over-year movement was also influenced by a base period effect. In January 2024, the IPPI was at its lowest level of 2024, as concerns about oil demand and high levels of supply led to relatively low prices for energy and petroleum products. The IPPI's year-over-year increase in January 2025 was the fourth consecutive year-over-year increase and the largest since December 2022 (+7.5%).
The top contributor to the IPPI's year-over-year increase in January 2025 was unwrought gold, silver, and platinum group metals, and their alloys (+38.8%). Other large contributors included softwood lumber (+18.3%), unwrought aluminum and aluminum alloys (+24.8%), fresh and frozen beef and veal (+20.7%), and finished motor gasoline (+7.7%). Precious metal prices were pushed up by strong safe-haven demand in the 12 months leading up to January, while limited supply contributed to the higher softwood lumber prices.
Most product groups in the IPPI experienced year-over-year price increases in January. Prices for grain and oilseed products, n.e.c. (not elsewhere classified) (-9.0%) were a noteworthy exception. Despite reduced output expectations in January, global oilseed production was strong over the 12 months ending in January.
Raw Materials Price Index
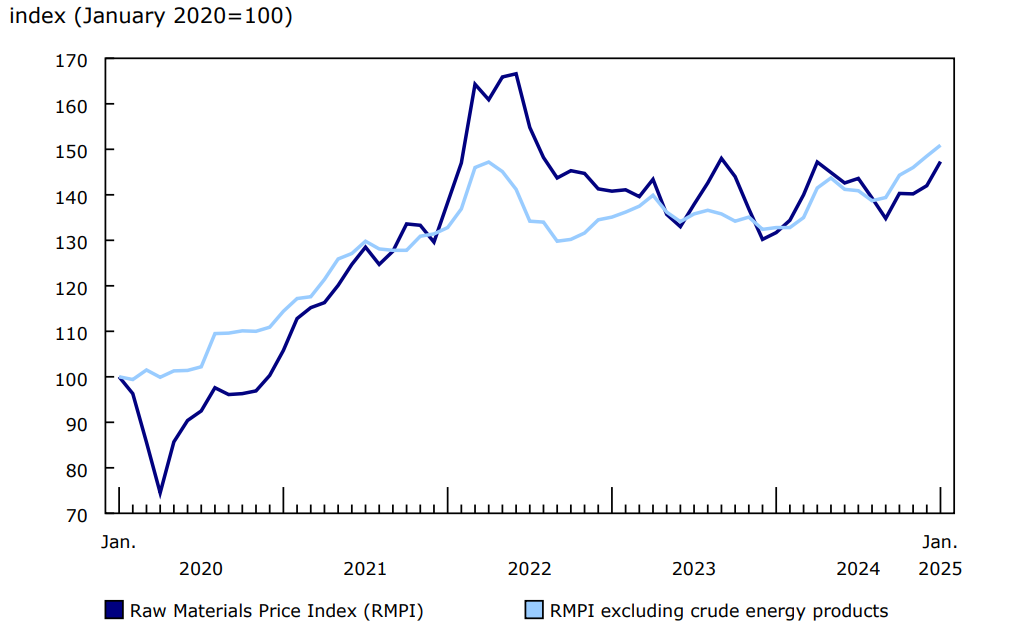
In January, the RMPI rose 3.7% on a monthly basis, mainly due to higher prices for crude energy products. Excluding crude energy products, the RMPI increased 1.6% in January.
Prices for crude energy products increased 7.2% month over month in January. This was the largest month-over-month growth for the group since March 2024 (+8.3%). Prices were higher for both conventional crude oil (+8.1%) and synthetic crude oil (+6.5%) in January 2025. Higher crude prices were partly due to new sanctions on Russian oil announced by the US government. In addition, recent crude inventory draws in the United States pushed crude prices upward. According to data from the U.S. Energy Information Administration, weekly ending crude stocks fell for nine consecutive weeks since the week ending November 17, 2024.
Prices for metal ores, concentrates and scrap (+1.9%) increased on a monthly basis for the fifth month in a row in January 2025. The prices of gold, silver, and platinum group metal ores and concentrates (+2.6%) had the largest contribution within the commodity group.
Year over year
The RMPI was up 11.8% year over year in January, the third consecutive year-over-year increase and the largest growth since September 2022 (+12.6%). The January 2025 movement was partially influenced by a base period effect, as the RMPI declined 6.5% year over year in January 2024.
The largest contributors to the RMPI's year-over-year rise in January 2025 included gold, silver, and platinum group metal ores and concentrates (+40.5%), conventional crude oil (+10.9%), cattle and calves (+26.0%), and synthetic crude oil (+15.1%).
Prices for iron ores and concentrates (-21.4%) and natural gas (-15.8%) exerted significant downward pressure on the RMPI's year-over-year movement in January. Market fundamentals in China, the world's largest iron market, influenced iron prices throughout the year.
Chart 2: Prices for raw materials rise in January
Description - Chart 2
Data table: Prices for raw materials rise in January
Source: Table 18-10-0268-01.
Note to readers
The Industrial Product Price Index (IPPI) and the Raw Materials Price Index (RMPI) are available at the Canada level only. Selected commodity groups within the IPPI are also available by region.
With each release, data for the previous six months may have been revised. The indexes are not seasonally adjusted.
The IPPI reflects the prices that producers in Canada receive as goods leave the plant gate. The IPPI does not reflect what the consumer pays. Unlike the Consumer Price Index, the IPPI excludes indirect taxes and all costs that occur between the time a good leaves the plant and the time the final user takes possession of the good. This includes transportation, wholesale and retail costs.
Canadian producers export many goods. Canadian producers often indicate goods' prices in foreign currencies, especially in US dollars, which are then converted into Canadian dollars. This is particularly the case for motor vehicles, pulp and paper products, and wood products. Therefore, fluctuations in the value of the Canadian dollar against its US counterpart affect the IPPI. However, the conversion to Canadian dollars reflects only how respondents provide their prices. This is not a measure that takes into account the full effect of exchange rates.
The conversion of prices received in US dollars is based on the average monthly exchange rate established by the Bank of Canada and available in Table 33-10-0163-01 (series v111666275). Monthly and annual variations in the exchange rate, as described in the release, are calculated according to the indirect quotation of the exchange rate (for example, CAN$1 = US$X).
The RMPI reflects the prices paid by Canadian manufacturers for key raw materials. Many of those prices are set on the world market. However, as few prices are denominated in foreign currencies, their conversion into Canadian dollars has only a minor effect on the calculation of the RMPI.
Reference
Data tables: Access the latest tables.
- Note: some data tables may best be viewed on desktop.
Definitions, data sources and methods: survey numbers 2306 and 2318.
Previous release: Industrial product and raw materials price indexes, December 2024.
Next release: March 20, 2025.
Contact information
For more information, or to enquire about the concepts, methods or data quality of this release, contact us (toll-free 1-800-263-1136; 514-283-8300; infostats@statcan.gc.ca) or Media Relations (statcan.mediahotline-ligneinfomedias.statcan@statcan.gc.ca).