

New home prices continued slowdown in January
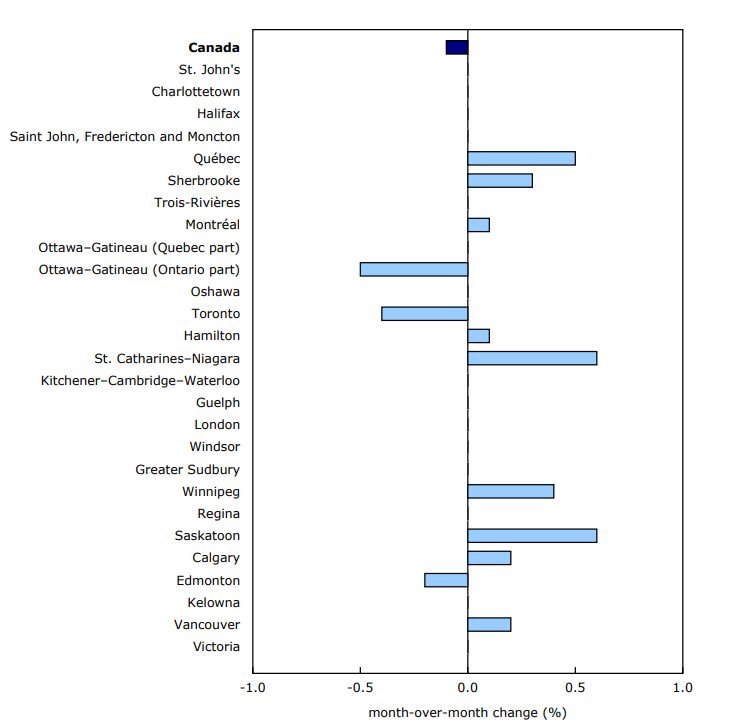
The national index edged down 0.1% on a month-over-month basis in January, following the same decline in the previous month. Prices were unchanged in 15 out of the 27 surveyed census metropolitan areas (CMAs). Meanwhile, nine CMAs saw an increase, while three CMAs were down. Even though more CMAs recorded price increases in January, a decline was seen at the national level. This decrease was driven by Toronto (-0.4%), the largest new housing market in Canada, accounting for nearly one-quarter (23.6%) of the national weight.
The largest month-over-month decrease of new home prices in January was recorded in Ottawa (-0.5%), followed by Toronto (-0.4%) and Edmonton (-0.2%). The weight of these three CMAs accounts for 38.8% of the national index. The latest new housing sales figures show a slowdown in the Ottawa and Toronto markets. Data collected from the Greater Ottawa Home Builder's Association shows a 21.2% monthly decline in sales of new detached houses and townhouses in December 2024. In the case of Toronto, Altus Group reported a decline in new single-family home sales (-68.6%) in December 2024.
The largest monthly increases in January 2025 were registered in Saskatoon (+0.6%) and St. Catharines–Niagara region (+0.6%), followed by Québec (+0.5%) and Winnipeg (+0.4%). Reduced borrowing costs fuelled the demand for housing in the CMAs where prices were relatively more affordable. The Canada Mortgage and Housing Corporation reported declines in inventory of completed and unsold single-family homes in Québec (-10.8%) and Winnipeg (-3.3%) in December 2024 compared to the previous month.
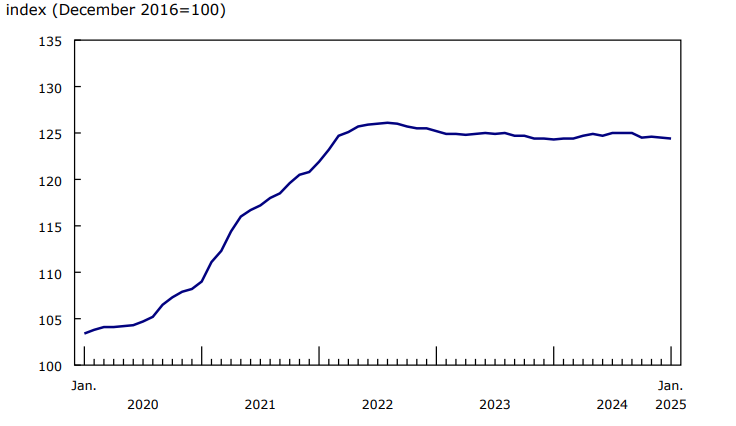
Chart 1: New Housing Price Index
Description - Chart 1
Data table: New Housing Price Index
Source: Table 18-10-0205-01.
New Housing Price Index, 12-month change
Nationally, the New Housing Price Index edged up by 0.1% year over year in January 2025.
The largest annual increases were in Calgary (+4.3%), Québec (+4.2%) and Saskatoon (+3.2%).
The largest annual declines in January were recorded in Toronto (-1.7%), Ottawa (-1.5%), and Kitchener–Cambridge–Waterloo (-1.5%).
Chart 2: New house prices decline at the national level
Description - Chart 2
Data table: New house prices decline at the national level
Source: Table 18-10-0205-02.
Note to readers
The New Housing Price Index (NHPI) measures changes over time in the selling prices of new residential houses. The prices are those agreed upon between the contractor and the buyer at the time the contract is signed. The detailed specifications for each new house remain the same between two consecutive periods.
The prices collected from builders and included in the index are market selling prices less value-added taxes, such as the federal Goods and Services Tax and the provincial harmonized sales tax.
The survey covers the following dwelling types: new single homes, semi-detached homes and townhomes (row or garden homes). The index is available at the national and provincial levels and for 27 census metropolitan areas (CMAs).
The index is not subject to revision and is not seasonally adjusted.
Annual weights have been updated with the publication of data for the January 2025 reference period.
Reference
Data table: 18-10-0205-01.
- Note: some data tables may best be viewed on desktop.
Definitions, data sources and methods: survey number 2310.
Previous release: New Housing Price Index, December 2024.
Next release: March 21, 2025.
Contact information
For more information, or to enquire about the concepts, methods or data quality of this release, contact us (toll-free 1-800-263-1136; 514-283-8300; infostats@statcan.gc.ca) or Media Relations (statcan.mediahotline-ligneinfomedias.statcan@statcan.gc.ca).