

Primary energy production increased 5.8% year over year in December, setting a record for the series, which began in 2020. All primary energy types contributed to the overall gain.
Secondary energy production increased 1.3% in December, with refined petroleum products (+1.2%) leading the gain.
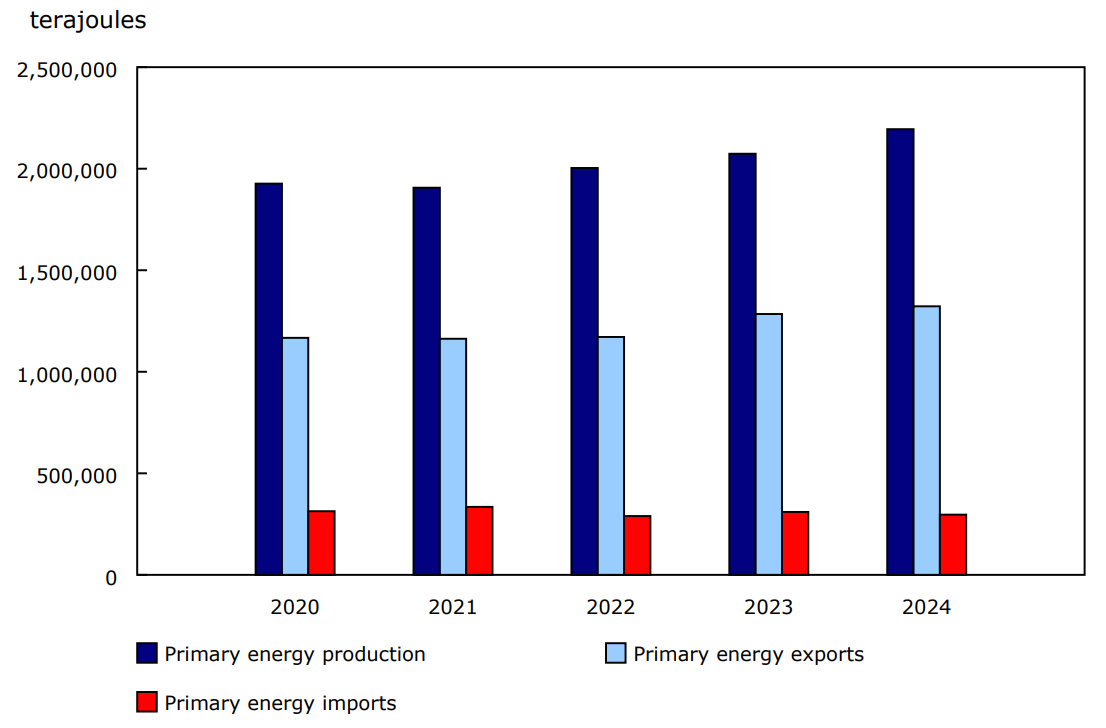
Chart 1: Primary energy production, exports and imports for the month of December, 2020 to 2024
Description - Chart 1
Data table: Primary energy production, exports and imports for the month of December, 2020 to 2024
Source: Table 25-10-0079-01.
Record crude oil production and exports
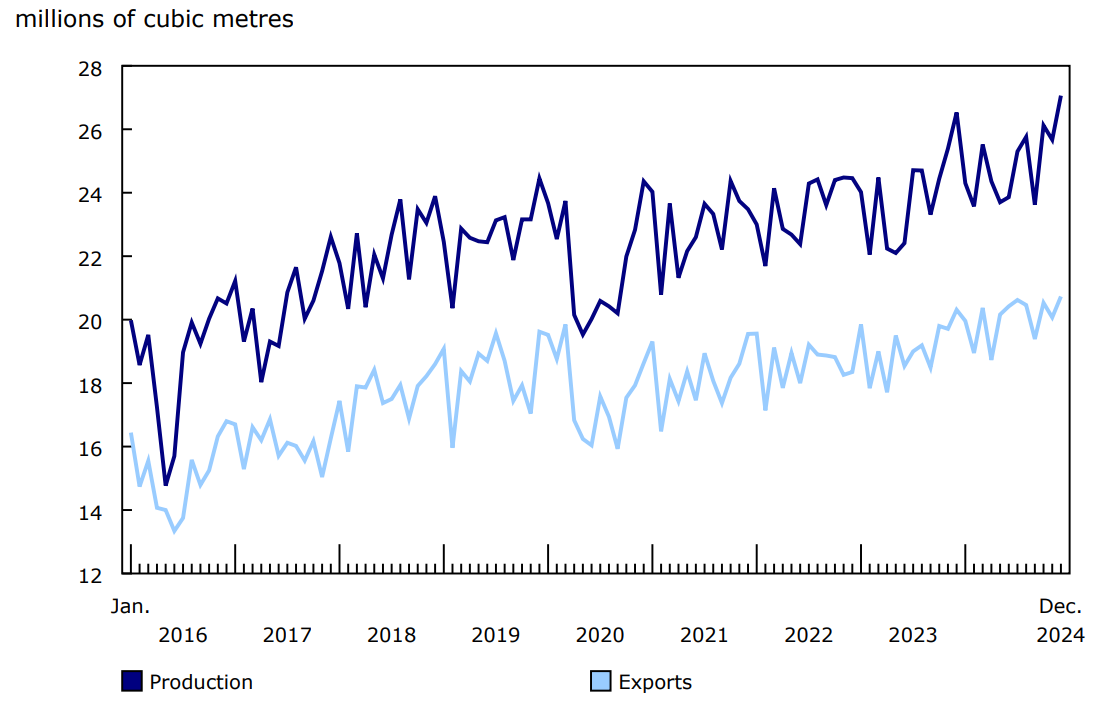
Production of crude oil and equivalent products rose 2.0% to 27.1 million cubic metres in December, the highest monthly production since the start of the data series in 2016.
The largest contribution to the gain in December 2024 came from light and medium crude oil, up 6.6% to 4.3 million cubic metres, the highest production level since March 2020 in the wake of the COVID-19 pandemic.
Oil sands production rose 0.9% to a record high of 17.8 million cubic metres in December 2024. Production of both synthetic crude oil (+1.3%) and crude bitumen (+0.7%) were up, with synthetic crude reaching a new monthly high, as all upgraders were producing at near full capacity.
Exports of crude oil and equivalent products also reached a new high in December, rising 2.1% year over year to 20.7 million cubic metres. The increase was driven primarily by exports to the United States by other modes of transport (marine and rail), which jumped 88.3%, mostly because of marine exports. Meanwhile, exports to the United States by pipeline were down (-2.7%), the fourth consecutive monthly year-over-year decline, partially offsetting the overall increase.
Chart 2: Production and exports of crude oil and equivalent products
Description - Chart 2
Data table: Production and exports of crude oil and equivalent products
Source: Table 25-10-0063-01.
The newly expanded Trans Mountain Pipeline began operation in May 2024, transporting crude oil and refined petroleum products from Edmonton, Alberta, to the port of Burnaby, British Columbia. This expansion nearly tripled the capacity of the existing line built in 1953, opening more Canadian crude oil for export to the global market. As a result, year-over-year rates of change are expected to be significant for some data series through to April 2025.
Production of natural gas reaches record high
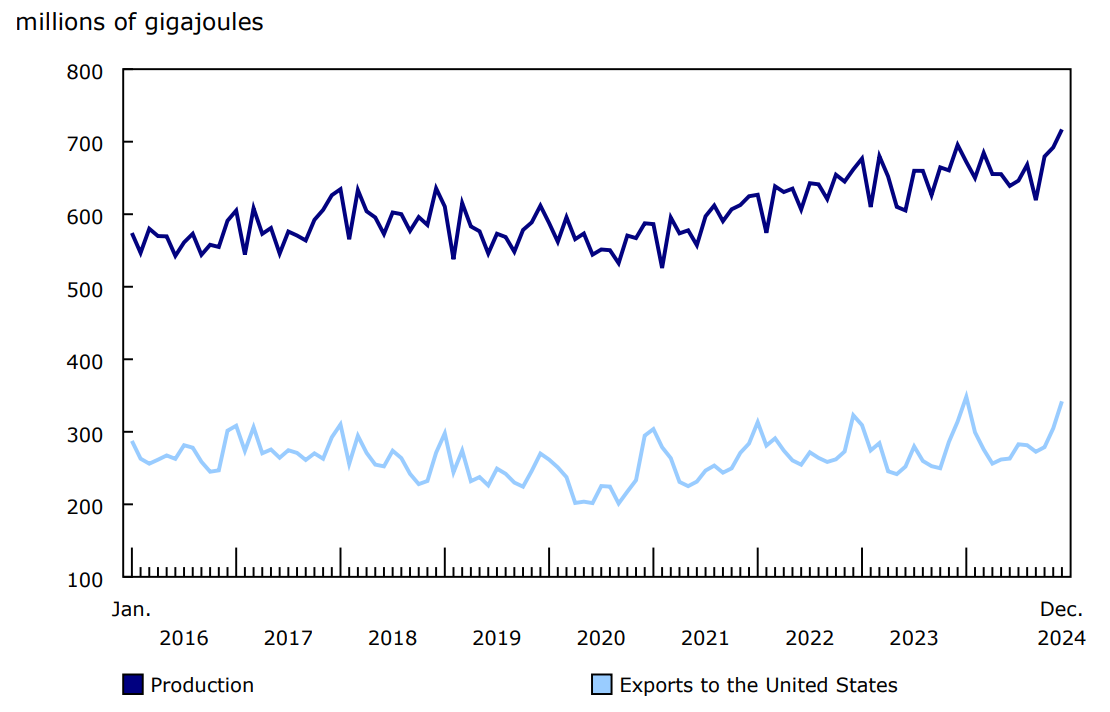
Marketable production of natural gas rose 3.1% year over year to 716.9 million gigajoules in December, the highest production level reported since the start of this data series in January 2016. Production of natural gas usually spikes in the winter, when demand is highest. In addition, producers may be increasing production in anticipation of the opening of a liquified natural gas export terminal in British Columbia later in 2025.
Total deliveries of natural gas to Canadian consumers were up 5.6% year over year to 525.0 million gigajoules in December 2024. Deliveries to the residential sector (+14.8%) accounted for most of the increase, which coincided with colder temperatures across much of Canada compared with December 2023.
Exports of natural gas to the United States climbed 8.9% year over year to 342.0 million gigajoules in December 2024. This was the highest export level recorded for December since the start of the data series in 2016, and the second highest overall behind January 2024 (348.3 million gigajoules). Similar to Canada, US demand for natural gas was also up in December because of colder temperatures and increased volume required for heating.
Chart 3: Canadian production and exports of natural gas
Description - Chart 3
Data table: Canadian production and exports of natural gas
Source: Table 25-10-0055-01.
Hydroelectricity generation increases in December
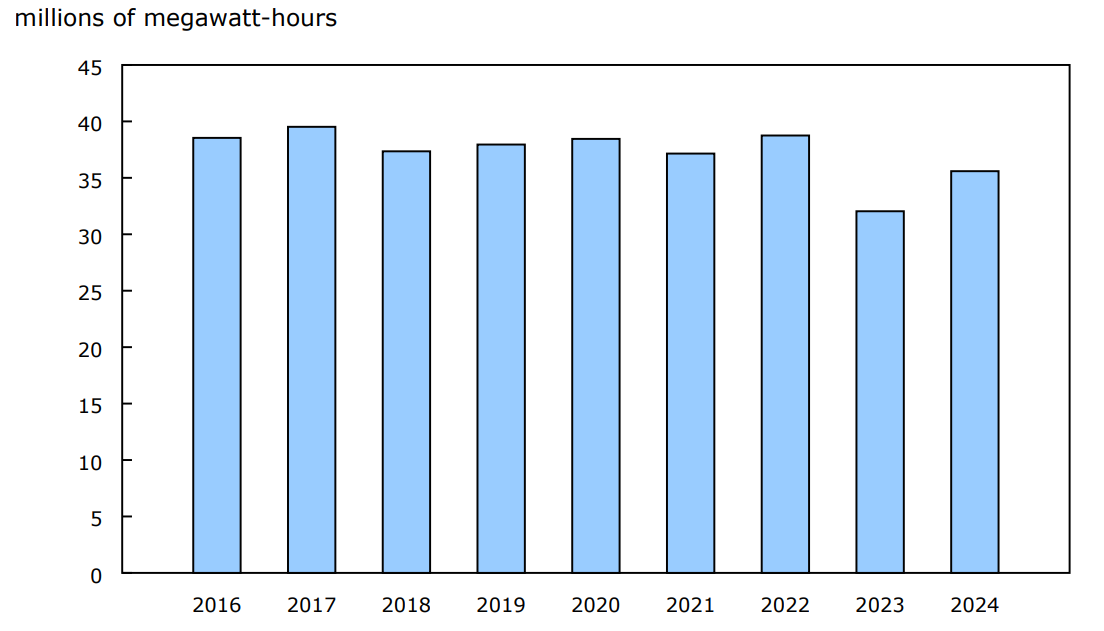
Total electricity generation in Canada jumped 9.1% year over year to 61.6 million megawatt-hours (MWh) in December. An 11.1% increase in hydroelectric generation was the main driver of the overall rise, but generation from combustibles (+6.4%), nuclear (+6.9%), wind (+6.2%) and solar (+4.5%) were also up.
According to Environment and Climate Change Canada, drought conditions were considerably improved across much of Canada in December 2024 compared with December 2023. This contributed to significant year over year increases in December 2024 in hydroelectric generation in Quebec (+12.1%), British Columbia (+34.8%) and Manitoba (+11.1%).
Chart 4: Canadian hydroelectricity generation for the month of December, 2016 to 2024
Description - Chart 4
Data table: Canadian hydroelectricity generation for the month of December, 2016 to 2024
Source: Table 25-10-0015-01.
Canadian consumption of electricity rose 7.4% year over year to 59.9 million MWh in December. This coincided with colder temperatures across much of the country compared with one year earlier. This was the highest level of consumption recorded for the month of December since this series was redesigned in 2016.
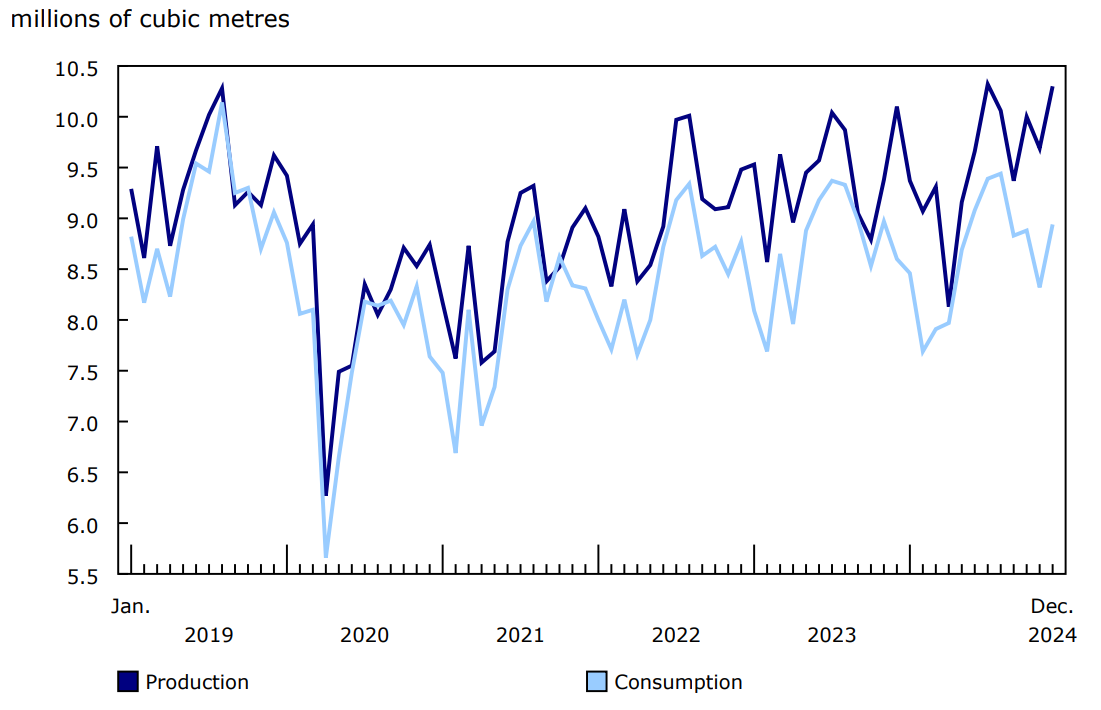
Production and consumption of refined petroleum products up in December
Production of refined petroleum products climbed 2.0% year over year in December to 10.3 million cubic metres. Finished motor gasoline (+5.5%) and kerosene-type jet fuel (+1.6%) led the overall increase.
Consumption of refined petroleum products rose 4.0% year over year to 8.9 million cubic metres in December because of increased demand for distillate fuel oil and finished motor gasoline.
Chart 5: Production and consumption of refined petroleum products
Description - Chart 5
Data table: Production and consumption of refined petroleum products
Source: Table 25-10-0081-01.
Focus on Canada and the United States
December 2024 saw the highest overall level of primary energy exports since the series began in 2020. The increase in December 2024 stemmed from crude oil exports (815 854 terajoules), of which 95.1% went to the United States. Natural gas exports to the United States stood at 342 009 terajoules for the month.
On an annual basis, in 2024, Canada produced a total of 23.7 million terajoules of primary energy. Almost two-thirds of this energy was exported to the United States, including 100% of electricity and natural gas exports and over 95% of crude oil.
Note to readers
The Energy Statistics Program relies on data collected from respondents and administrative sources.
The Consolidated Energy Statistics table (25-10-0079-01) presents monthly data on primary and secondary energy by fuel type (crude oil, natural gas, electricity, coal, etc.) in terajoules and supply and demand characteristics (production, exports, imports, etc.) for Canada. For more information, consult the Consolidated Energy Statistics Table: User Guide.
Data in this release are not seasonally adjusted.
The following survey programs support the "Energy statistics" release:
- Crude oil and natural gas (survey number 2198; tables 25-10-0036-01, 25-10-0055-01 and 25-10-0063-01)
- Energy transportation and storage (survey number 5300; tables 25-10-0075-01 and 25-10-0077-01)
- Natural gas transmission, storage and distribution (survey numbers 2149, 5210 and 5215; tables 25-10-0057-01, 25-10-0058-01 and 25-10-0059-01)
- Refined petroleum products (survey number 2150; table 25-10-0081-01).
- Renewable fuel and hydrogen (survey number 5294; table 25-10-0082-01)
- Electric power statistics (survey number 2151; tables 25-10-0015-01 and 25-10-0016-01)
- Coal and coke statistics (survey numbers 2147 and 2003; tables 25-10-0045-01 and 25-10-0046-01).
Revisions
Energy survey data and administrative sources are subject to revisions to reflect new or updated information. Historical revisions will be processed periodically.
With this release, revisions have been made to the following data series:
- Table 25-10-0046-01: Coal, monthly production and exports data have been revised, for the period from September to November 2024.
- Table 25-10-0081-01: Petroleum products data have been revised, for the period from January to November 2024.
- Table 25-10-0082-01: Renewable fuel plant statistics data have been revised, for the period from July to November 2024.
- Table 25-10-0075-01: Crude oil and petroleum products inventories held by domestic transporters data have been revised, for the period from January 2020 to November 2024.
- Table 25-10-0077-01: Crude oil and petroleum products movements, by mode of transport and by product type data have been revised, for the period from January 2020 to November 2024.
- Table 25-10-0057-01: Canadian natural gas storage data have been revised for November 2024.
- Table 25-10-0058-01: Canadian monthly natural gas transmission data have been revised for November 2024.
- Table 25-10-0059-01: Canadian monthly natural gas distribution data have been revised for the month of February 2024 and the period from June to October 2024.
- Table 25-10-0036-01: Natural gas liquids and sulphur products from processing plants data have been revised, for the period from January to November 2024.
- Table 25-10-0055-01: Supply and disposition of natural gas data have been revised, for the period from January to November 2024.
- Table 25-10-0063-01: Supply and disposition of crude oil and equivalent data have been revised, for the period from January 2020 to November 2024.
- Table 25-10-0079-01: Consolidated energy statistics have been revised for the period from January 2020 to November 2024 to incorporate data from the above-mentioned revisions.
Occasionally, data from Environment and Climate Change Canada are referenced by the Energy Statistics Program using Cooling Degree Days (CDDs) or Heating Degree Days (HDDs) as a measure of temperature. CDDs reflect the relationship between outdoor temperatures and the need to cool indoors to maintain room temperature. As temperatures outside rise, the number of CDDs increases. HDDs are the opposite and reflect the need to heat indoors to maintain room temperature. As temperatures outside fall, the number of HDDs increases.
Contact information
For more information, or to enquire about the concepts, methods or data quality of this release, contact us (toll-free 1-800-263-1136; 514-283-8300; infostats@statcan.gc.ca) or Media Relations (statcan.mediahotline-ligneinfomedias.statcan@statcan.gc.ca).