

In February, the preliminary number of international arrivals to Canada by air and automobile was 4.1 million, down 10.9% from February 2024. This was the first year-over-year decline since March 2021.
Non-resident trips to Canada by air decline
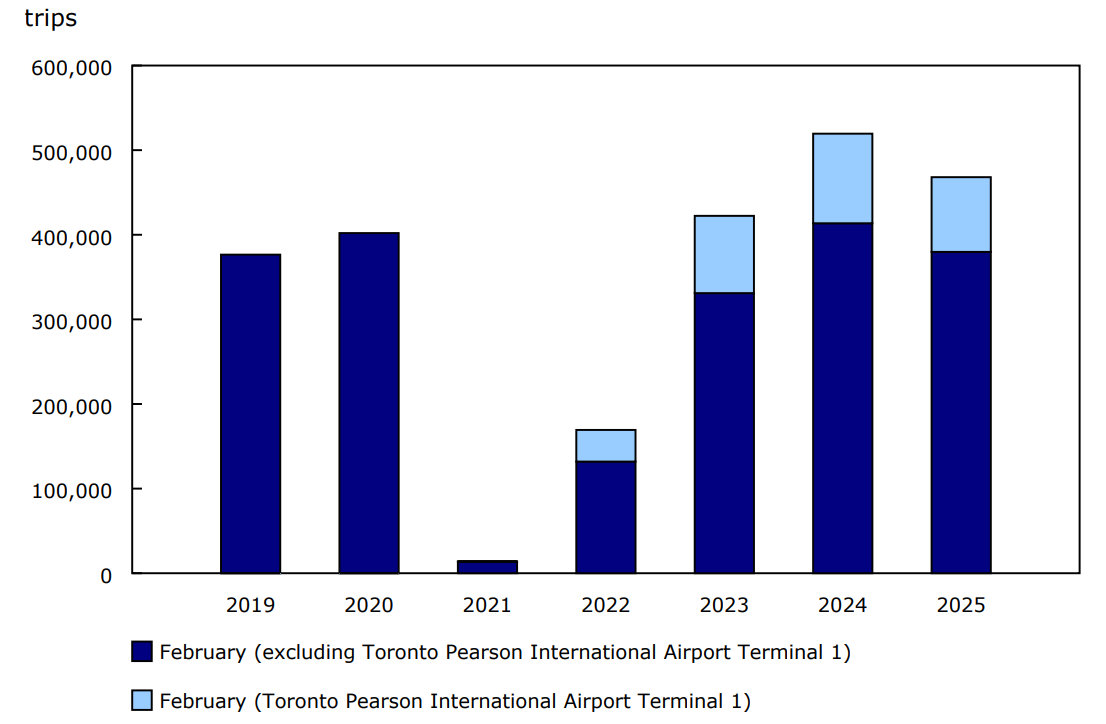
In February 2025, non-resident arrivals in Canada by air totalled 468,100, down 9.9% year over year (Chart 1). These included arrivals by US residents (228,000; -1.3% from the same month in 2024), and residents of countries other than the US (240,000; -16.8%).
According to the daily traffic data, on Friday, February 14 and Saturday, February 15, 2025, preceding President's Day in the US (on February 17), a daily average of 24,300 for non-resident trips was observed, which was 33.6% higher than the daily average for the remaining Fridays and Saturdays during the month.
Chart 1: Non-resident trips to Canada by commercial aircraft, February, 2019 to 2025
Description - Chart 1
Data table: Non-resident trips to Canada by commercial aircraft, February, 2019 to 2025
Source: Table 24-10-0056-01.
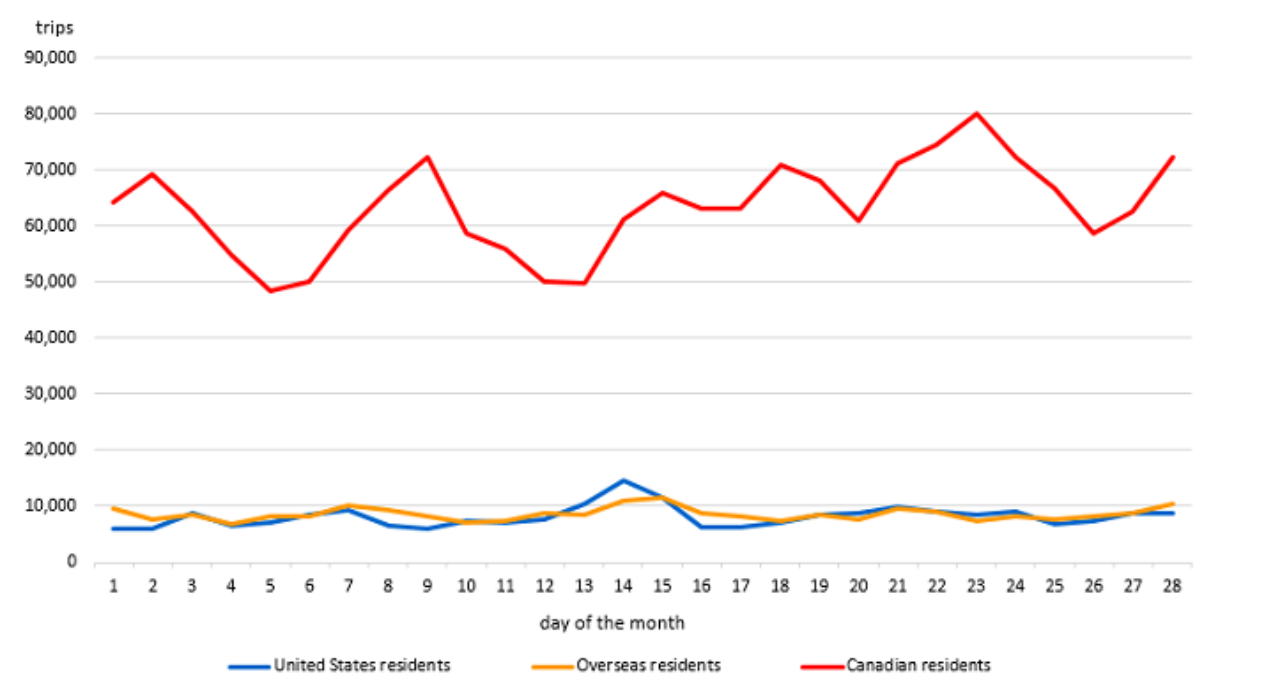
Chart 2: Trips to Canada by commercial aircraft, by country of residence, February 2025
Description - Infographic 1
The title of the chart is "Trips to Canada by commercial aircraft, by country of residence, February 2025"
This is a line chart.
The vertical axis shows the number of trips, from 0 to 90,000, by increments of 10,000.
The horizontal axis shows the days from February 1 to 28, by increments of one day.
There are three series in this chart.
The first series is United States residents. The lowest point on this line is 5,866 on February 9, and the highest point on this line is 14,693 on February 14.
The second series is overseas residents. The lowest point on this line is 6,932 on February 4, and the highest point on this line is 11,481 on February 15.
The third series is Canadian residents. The lowest point on this line is 48,331 on February 5 and the highest point on this line is 80,185 on February 23.
Source: Table 24-10-0056-01.
Canadian-resident return trips by air down
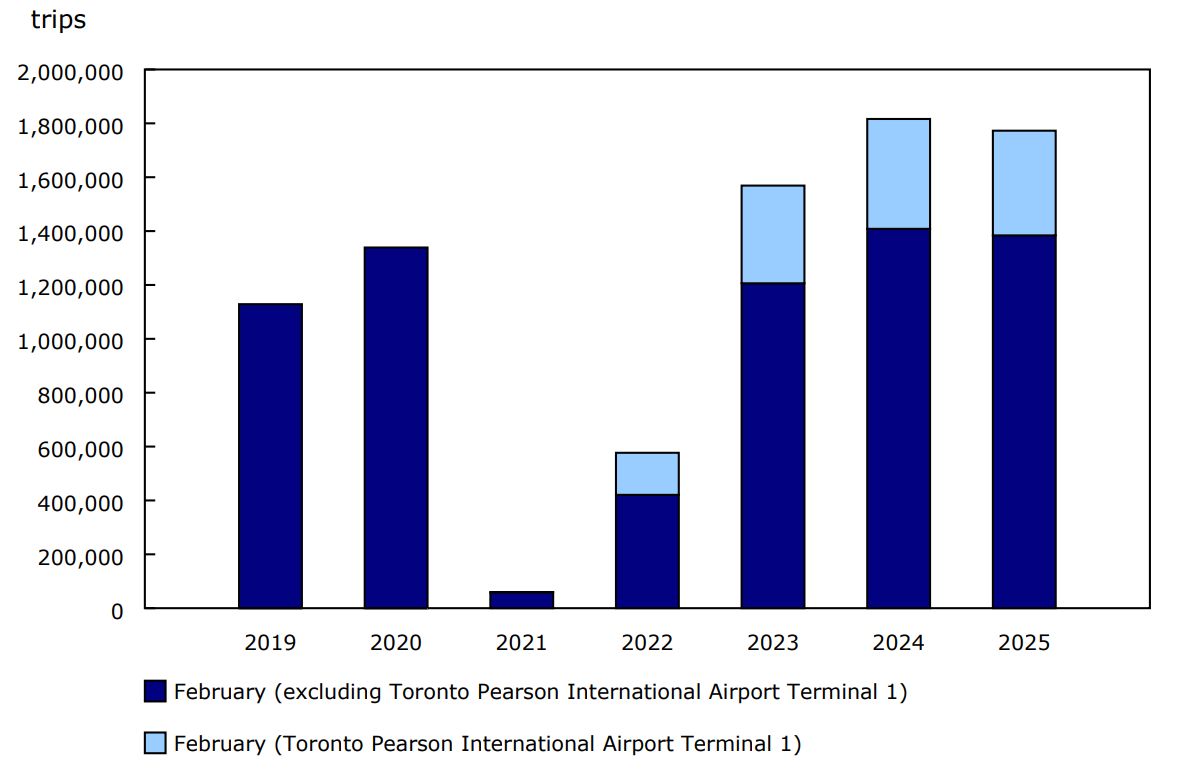
In February, Canadian-resident return trips by air stood at 1.8 million, down 2.4% from the same month one year earlier (Chart 3). The highest number of arrivals per day (80,200) was recorded on Sunday, February 23, surpassing the daily average for the remaining Sundays of the month by 17.6%.
Chart 3: Canadian-resident return trips from abroad by commercial aircraft, February, 2019 to 2025
Description - Chart 2
Data table: Canadian-resident return trips from abroad by commercial aircraft, February, 2019 to 2025
Source: Table 24-10-0056-01.
US-resident trips to Canada by automobile decrease
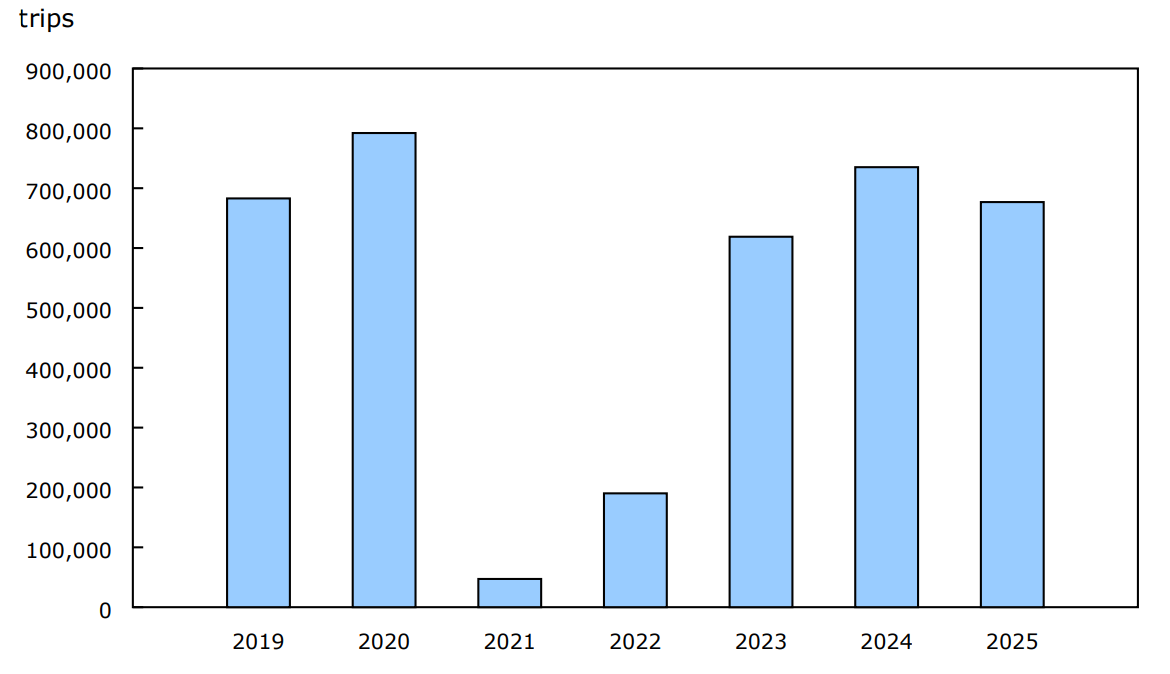
In February, the number of US-resident trips to Canada by automobile was 676,800, a decline of 7.9% from the same month in 2024 (Chart 4). This was the second year-over-year decline observed since March 2021.
From Friday, February 14, to Monday, February 17, 2025, inclusive of the President's Day in the US, an average of 41,800 US-resident arrivals per day was observed. This average was 63.2% higher than the average for the remaining Friday-to-Monday periods in February.
Chart 4: United States-resident trips to Canada by automobile, February, 2019 to 2025
Description - Chart 3
Data table: United States-resident trips to Canada by automobile, February, 2019 to 2025
Source: Table 24-10-0057-01.
Chart 5: Trips to Canada by automobile, by country of residence, February 2025
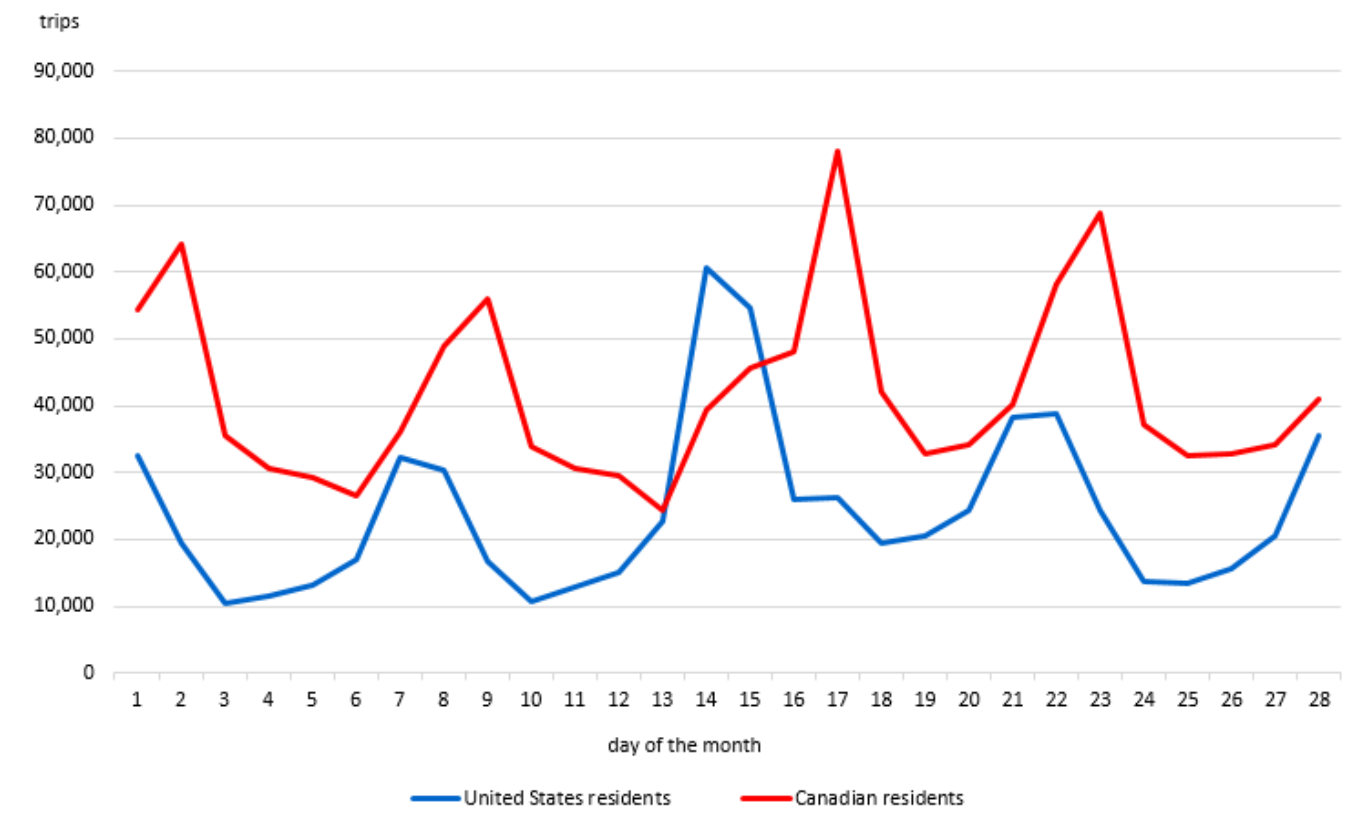
Description - Infographic 2
The title of the chart is "Trips to Canada by automobile, by country of residence, February 2025"
This is a line chart.
The vertical axis shows the number of trips, from 0 to 90,000 by increments of 10,000.
The horizontal axis shows the days from February 1 to 28, by increments of one day.
There are two series in this chart.
The first series is United States residents. The lowest point in this line is 10,399 on February 3, and the highest point in this line is 60,623 on February 14.
The second series is Canadian residents. The lowest point in this line is 24,372 on February 13, and the highest point in this line is 78,006 on February 17.
Source: Table 24-10-0057-01.
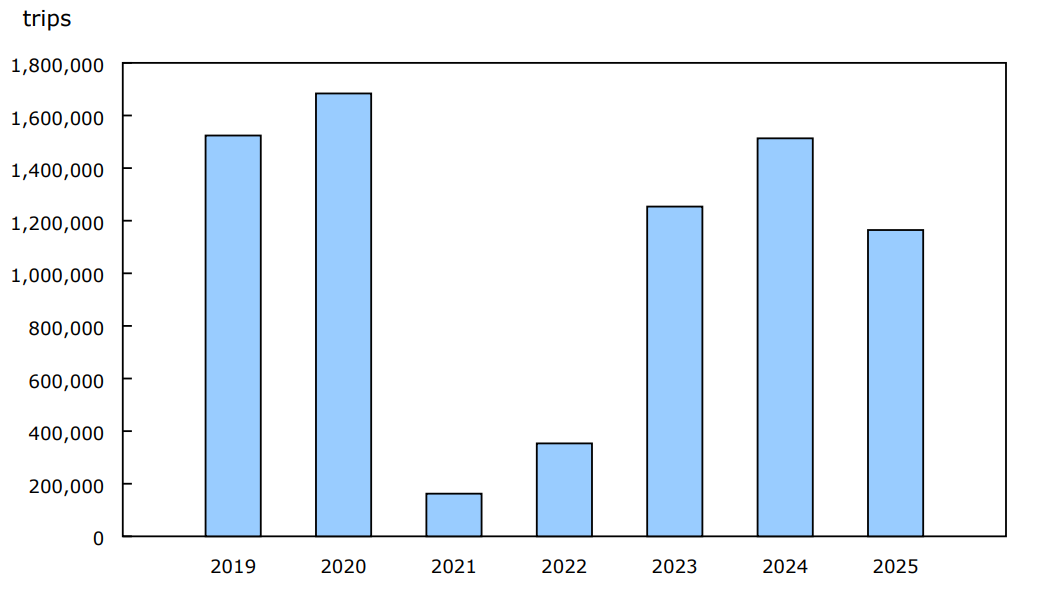
Canadian-resident return trips from US by automobile decline
In February, the number of Canadian-resident return trips by automobile from the US totalled 1.2 million, a steep decline (-23.0%) from the same month in 2024 (Chart 6). February 2025 marked the second consecutive month of year-over-year decline and the second decline observed since March 2021.
On Monday, February 17, 2025 (Family Day in Alberta, British Columbia, New Brunswick, Ontario and Saskatchewan; Heritage Day in Nova Scotia; Islander Day in Prince Edward Island; Louis Riel Day in Manitoba), the highest number of return trips by automobile from the US per day (78,000) was observed. This was 119.8% higher than the daily average for the remaining Mondays in February (35,500).
Chart 6: Canadian-resident return trips from the United States by automobile, February, 2019 to 2025
Description - Chart 4
Data table: Canadian-resident return trips from the United States by automobile, February, 2019 to 2025
Source: Table 24-10-0057-01.
Focus on Canada and the United States
In February 2025, the number of arrivals to Canada by US residents by air (228,000; -1.3%) and by automobile (676,800; -7.9%) decreased from the same month in 2024. This is the first year-over-year decline since March 2021 for the air indicator.
In February 2025, Canadian residents flew back from 585,700 trips to the US, which represented a 13.1% decline from the same month in 2024. For Canadian-resident return trips by automobile from the US, February 2025 saw a steep decline of 23.0% year over year to 1.2 million. This represented a second consecutive month of year-over-year decline and the second decline observed since March 2021.
For more information, see Focus on Canada and the United States.
Note to readers
This release provides an early indicator of travel based on preliminary data on international arrivals to Canada for February 2025 for air and automobile (arrivals by automobile made by overseas residents are not included in this release). Complete counts will be available with the release of "Travel between Canada and other countries" on April 23.
For more information on concepts, definitions, data sources and methods, refer to Frontier Counts.
Data Sources
All counts of arrivals by air are from commercial aircraft and are produced exclusively using primary inspection kiosk (PIK) data received from the Canada Border Services Agency (CBSA). PIKs were deployed at Toronto Pearson International Airport Terminal 1 on June 22, 2021, and, as of July 2021, these arrivals are included in the total counts, which has consequently improved coverage. In 2024, PIKs captured 90.3% of all commercial air arrivals.
Counts of arrivals to the country by automobile through land ports equipped with the CBSA's automated Integrated Primary Inspection Line (IPIL) system represent a subset of US-resident trips and Canadian-resident return trips by automobile. In 2024, IPIL land ports captured 88.9% of all automobile entries.
Canadian Tourism Activity Tracker
Selected estimates from the Canadian Tourism Activity Tracker for December 2024 are available upon request. Please note that these data will no longer be produced after the December 2024 reference period. The data visualization tool, "Canadian Tourism Activity Tracker," and Table 24-10-0049-01, "Canadian Tourism Activity Tracker and Grouped Data Sources," will be archived. Users may contact tourism@statcan.gc.ca for additional information or to provide comments on the proposed change.
Reference
Data tables: Access the latest tables.
- Note: some data tables may best be viewed on desktop.
Definitions, data sources and methods: survey number 5005.
Previous release: Leading indicator of international arrivals to Canada, January 2025.
Next release: April 10, 2025.
Contact information
For more information, or to enquire about the concepts, methods or data quality of this release, contact us (toll-free 1-800-263-1136; 514-283-8300; infostats@statcan.gc.ca) or Media Relations (statcan.mediahotline-ligneinfomedias.statcan@statcan.gc.ca).