

Job vacancies hold steady in the fourth quarter
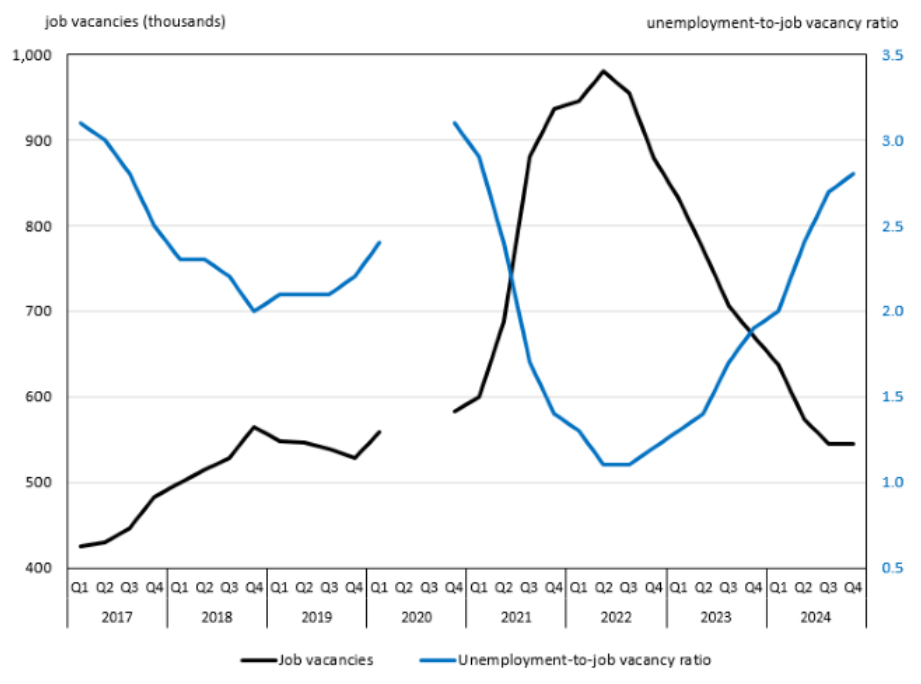
Job vacancies were virtually unchanged in the fourth quarter at 547,800, following nine consecutive quarters of decline since peaking at 983,600 in the second quarter of 2022.
Job vacancies held steady for full and part-time as well as permanent and temporary positions in the fourth quarter of 2024. Year over year, job vacancies were down for both full-time (-16.8%; -84,200) and part-time (-24.2%; -42,400) positions. Job vacancies were also down on a year-over-year basis for permanent (-18.2%; -99,700) and temporary (-21.4%; -26,800) positions.
Total labour demand (the sum of filled and vacant positions) rose by 24,900 (+0.1%) in the fourth quarter due to an increase in payroll employment (+24,700; +0.1%).
The job vacancy rate—which corresponds to the number of vacant positions as a proportion of total labour demand—also held steady in the fourth quarter at 3.1%. On a year-over-year basis, the job vacancy rate was down 0.7 percentage points.
Unemployment-to-job vacancy ratio continues to trend upwards
There were 2.8 unemployed persons for every job vacancy in the fourth quarter, compared with 2.7 in the previous quarter. This increase was due to an uptick in unemployment (+53,500; +3.7%, as measured by the Labour Force Survey [LFS]), as the number of vacancies was little changed in the fourth quarter.
The overall unemployment-to-job vacancy ratio has trended up since the third quarter of 2022, when it was 1.1. The steady increase in this ratio over this period was driven by fewer job vacancies (-408,800; -42.8%) and more unemployed persons (+455,000; +43.2%, as measured by the LFS).
Chart 1: Unemployment-to-job vacancy ratio continues to rise, as unemployment increases in the fourth quarter
Description - Chart 1
The title of the chart is "Unemployment-to-job vacancy ratio continues to rise, as unemployment increases in the fourth quarter"
This is a linear chart.
The vertical axis on the left shows the number of job vacancies in thousands, by increments of 100. It starts at 400 and ends at 1,000.
The vertical axis on the right shows the unemployment-to-job vacancy ratio, by increments of 0.5. It starts at 0.5 and ends at 3.5.
The horizontal axis shows each quarter, from the first quarter of 2017 to the fourth quarter of 2024.
The black line represents the number of job vacancies (in thousands) in the last 32 quarters, with 425.2 in the first quarter of 2017, 429.1 in the second quarter of 2017, 446.2 in the third quarter of 2017, 483.4 in the fourth quarter of 2017, 499.6 in the first quarter of 2018, 515.1 in the second quarter of 2018, 528.9 in the third quarter of 2018, 564.3 in the fourth quarter of 2018, 548.7 in the first quarter of 2019, 546.1 in the second quarter of 2019, 538.3 in the third quarter of 2019, 528.6 in the fourth quarter of 2019, 558.3 in the first quarter of 2020, second and third quarters of 2020 were omitted because data were not collected during this phase of the COVID-19 pandemic, 582.7 in the fourth quarter of 2020, 600.1 in the first quarter of 2021, 687.4 in the second quarter of 2021, 880.8 in the third quarter of 2021, 936.7 in the fourth quarter of 2021, 945.2 in the first quarter of 2022, 980.2 in the second quarter of 2022, 954.2 in the third quarter of 2022, 879.3 in the fourth quarter of 2022, 831.0 in the first quarter of 2023, 772.4 in the second quarter of 2023, 705.9 in the third quarter of 2023, 671.5 in the fourth quarter of 2023, 637.3 in the first quarter of 2024, 574.2 in the second quarter of 2024, 545.2 in the third quarter of 2024, and 545.4 in the fourth quarter of 2024.
The blue line represents the unemployment-to-job vacancy ratio in the last 32 quarters, with 3.1 in the first quarter of 2017, 3.0 in the second quarter of 2017, 2.8 in the third quarter of 2017, 2.5 in the fourth quarter of 2017, 2.3 in the first quarter of 2018, 2.3 in the second quarter of 2018, 2.2 in the third quarter of 2018, 2.0 in the fourth quarter of 2018, 2.1 in the first quarter of 2019, 2.1 in the second quarter of 2019, 2.1 in the third quarter of 2019, 2.2 in the fourth quarter of 2019, 2.4 in the first quarter of 2020, second and third quarters of 2020 were omitted because data were not collected during this phase of the COVID-19 pandemic, 3.1 in the fourth quarter of 2020, 2.9 in the first quarter of 2021, 2.4 in the second quarter of 2021, 1.7 in the third quarter of 2021, 1.4 in the fourth quarter of 2021, 1.3 in the first quarter of 2022, 1.1 in the second quarter of 2022, 1.1 in the third quarter of 2022, 1.2 in the fourth quarter of 2022, 1.3 in the first quarter of 2023, 1.4 in the second quarter of 2023, 1.7 in the third quarter of 2023, 1.9 in the fourth quarter of 2023, 2.0 in the first quarter of 2024, 2.4 in the second quarter of 2024, 2.7 in the third quarter of 2024, and 2.8 in the fourth quarter of 2024.
Note: Job Vacancy and Wage Survey data collection was suspended for the second and third quarters of 2020. Therefore, data for these reference periods are not available. Data are adjusted for seasonality. The total number of vacancies is equal to the sum of job vacancies in the provinces (excluding the territories) for consistency with the geographic coverage of the Labour Force Survey.
Sources: Job Vacancy and Wage Survey (5217), table 14-10-0400-01, and Labour Force Survey (3701), table 14-10-0287-01.
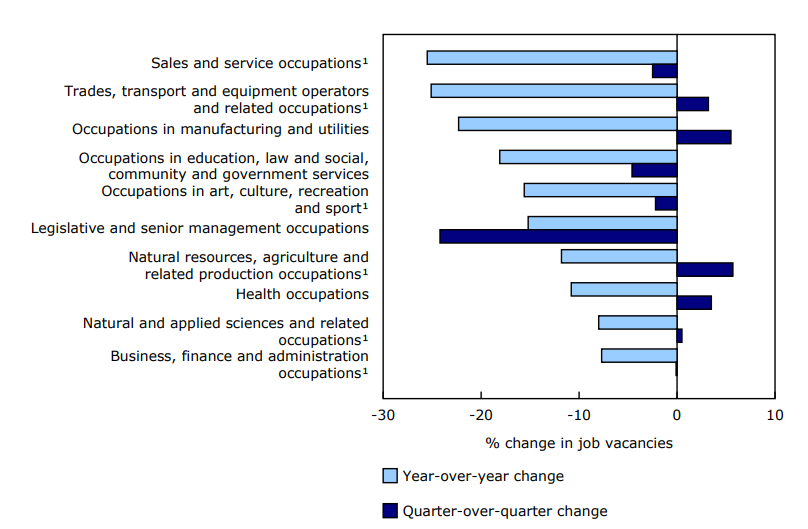
Job vacancies down in two broad occupational groups and up in two
In the fourth quarter, job vacancies were up in health occupations (+2,800; +3.5%) and occupations in manufacturing and utilities (+900; +5.5%). These increases were partially offset by declines in occupations in education, law and social, community and government services (-2,500; -4.6%) and legislative and senior management occupations (-300; -24.2%). Vacancies were little changed in the remaining six broad occupational groups.
On a year-over-year basis, the number of job vacancies was down in all 10 broad occupational groups, led by sales and service occupations (-52,200; -25.5%), trades, transport and equipment operators and related occupations (-34,100; -25.1%), and occupations in education, law and social, community and government services (-11,500; -18.1%).
Year over year, the proportion of long-term vacancies—vacancies for which recruitment efforts have been ongoing for 90 days or more—was down in 8 of the 10 broad occupational groups in the fourth quarter. The largest decreases were in occupations in legislative and senior management occupations (-16.4 percentage points to 22.2%) and occupations in manufacturing and utilities (-10.4 percentage points to 25.6%). The lone group to see an increase in the proportion of long-term vacancies was business, finance and administration occupations (+2.7 percentage points to 24.1%) (not seasonally adjusted).
Chart 2: Quarter-over-quarter percentage change in vacancies varies across broad occupation groups
Description - Chart 2
Data table: Quarter-over-quarter percentage change in vacancies varies across broad occupation groups
1. Quarter-over-quarter proportional changes are not statistically significant.
Note: Data are adjusted for seasonality.
Source: Job Vacancy and Wage Survey (5217), table 14-10-0399-01.
More job vacancies in health occupations
Job vacancies in health occupations rose by 2,800 (+3.5%) to 81,700 in the fourth quarter, after two consecutive decreases totalling 13,000 (-14.1%) from the first quarter to the third quarter.
Year over year, vacancies in health occupations were down by 10,300 (-11.4%) in the fourth quarter. Among the 43 occupations within this broad occupational group, 8 occupations recorded a decline in vacancies over this period. Registered nurses and registered psychiatric nurses (-5,500 to 23,300), nurse aides, orderlies and patient service associates (-2,800 to 18,200) and licensed practical nurses (-2,600 to 10,700) accounted for the largest decreases. Combined, these three occupations accounted for just under two-thirds (65.4%) of the total vacancies in health occupations in the fourth quarter (not seasonally adjusted).
Little change in job vacancies in sales and service occupations
Job vacancies in sales and service occupations were little changed in the fourth quarter after eight consecutive quarters of decline. Compared with the peak in the fourth quarter of 2021 (345,500), vacancies in sales and service occupations were down by 193,100 (-55.9%).
Year over year, job vacancies in sales and service occupations fell by 52,200 (-25.5%) in the fourth quarter, the largest decline of all the broad occupational groups. This decline accounted for 41.3% of the total yearly declines.
Within this broad occupational group, vacancies for food counter attendants, kitchen helpers and related support occupations (-9,500 to 25,500), retail salespersons and visual merchandisers (-8,200 to 20,900), and store shelf stockers, clerks and order fillers (-6,100 to 6,700) recorded the largest year-over-year declines in the fourth quarter (not seasonally adjusted).
Despite the decreases, vacancies in sales and service occupations were the highest among the 10 broad occupational groups, accounting for 27.8% of the total number of vacancies in the fourth quarter.
Average offered hourly wage continues to grow
On a year-over-year basis, the average offered hourly wage for vacant positions was up 7.4% to $28.30 in the fourth quarter, following a 7.6% increase to $27.55 in the third quarter and an increase of 6.8% to $26.80 in the second quarter (data in this section are not seasonally adjusted).
In comparison, the average hourly wages for all employees (from the LFS) were up by 4.4% in the fourth quarter, down from 5.0% in the previous quarter.
Recent increases in average offered hourly wages for vacant positions were partly due to a shift in the relative composition of job vacancies towards occupations that typically offer higher wages. Using a method that holds constant the composition of job vacancies by occupation (based on the composition observed in the fourth quarter of 2023), average offered hourly wages grew by 5.0% on a year-over-year basis in the fourth quarter of 2024, down slightly from 5.1% in the third quarter, but up from 4.2% in the second quarter.
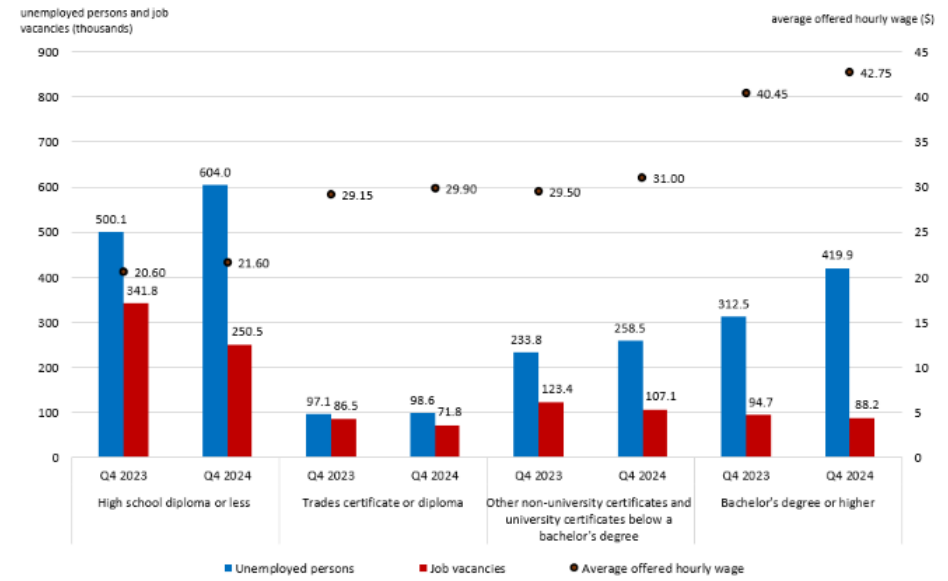
Largest decline in vacancies for positions requiring a high school diploma or less
Compared with a year earlier, there were fewer vacant positions for the four combined educational levels sought by employers in the fourth quarter. Positions requiring a high school diploma or less decreased by 91,400 (-26.7%), accounting for 70.9% of the overall year-over-year decline in job vacancies (data in this section are not seasonally adjusted).
There were 2.4 unemployed persons with a high school diploma or less for every job vacancy requiring this level of education in the fourth quarter, up from 1.5 in the same quarter of 2023.
In comparison, the number of vacancies for positions requiring a bachelor's degree or higher fell 6.8% (-6,500) over the same period. The unemployment-to-job vacancy ratio for this level of education was 4.8 in the fourth quarter, up from 3.3 in the same quarter of 2023.
This increase in the fourth quarter of 2024 was mostly attributable to more unemployed persons with a bachelor's degree or higher level of education (+107,400; +34.4%).
The average offered hourly wage for job vacancies requiring a bachelor's degree or higher was $42.75 in the fourth quarter, nearly twice that for vacancies requiring a high school diploma or less ($21.60).
Chart 3: Positions requiring a high school diploma or less continue to account for the largest share of the total decline in job vacancies, year over year
Description - Chart 3
The title of the chart is "Positions requiring a high school diploma or less continue to account for the largest share of the total decline in job vacancies, year over year"
This is a scatter and bar combination chart.
The vertical axis on the left shows the number of unemployed persons (blue bar) and job vacancies (dark red bar) in thousands by increments of 100. It starts at 0 and ends at 900.
The vertical axis on the right shows the average offered hourly wages in dollars, by increments of $5. It starts at $0 and ends at $45.
The horizontal axis shows the fourth quarter of 2023 and the fourth quarter of 2024 for each selected educational group: high school diploma or less, trades certificate or diploma, other non-university certificates and university certificates below a bachelor's degree, and bachelor's degree or higher.
The first blue bar represents the fourth quarter of 2023 for unemployed persons holding high school diploma or less, with the number of unemployed persons at 500.1.
The second blue bar represents the fourth quarter of 2024 for unemployed persons holding high school diploma or less, with the number of unemployed persons at 604.0.
The third blue bar represents the fourth quarter of 2023 for unemployed persons holding trades certificate or diploma, with the number of unemployed persons at 97.1.
The fourth blue bar represents the fourth quarter of 2024 for unemployed persons holding trades certificate or diploma, with the number of unemployed persons at 98.6.
The fifth blue bar represents the fourth quarter of 2023 for unemployed persons holding other non-university certificates and university certificates below a bachelor's degree, with the number of unemployed persons at 233.8.
The sixth blue bar represents the fourth quarter of 2024 for unemployed persons holding other non-university certificates and university certificates below a bachelor's degree, with the number of unemployed persons at 258.5.
The seventh blue bar represents the fourth quarter of 2023 for unemployed persons holding bachelor's degree or higher, with the number of unemployed persons at 312.5.
The eighth blue bar represents the fourth quarter of 2024 for unemployed persons holding bachelor's degree or higher, with the number of unemployed persons at 419.9.
The first dark red bar represents the fourth quarter of 2023 for job vacancies requiring high school diploma or less, with job vacancies at 341.8. The average offered hourly wage for this group was $20.60 in the fourth quarter of 2023.
The second dark red bar represents the fourth quarter of 2024 for job vacancies requiring high school diploma or less, with job vacancies at 250.5. The average offered hourly wage was $21.60 in the fourth quarter of 2024.
The third dark red bar represents the fourth quarter of 2023 for job vacancies requiring trades certificate or diploma, with job vacancies at 86.5. The average offered hourly wage for this group was $29.15 in the fourth quarter of 2023.
The fourth dark red bar represents the fourth quarter of 2024 for job vacancies requiring trades certificate or diploma, with job vacancies at 71.8. The average offered hourly wage for this group was $29.90 in the fourth quarter of 2024.
The fifth dark red bar represents the fourth quarter of 2023 for job vacancies requiring other non-university certificates and university certificates below a bachelor's degree, with job vacancies at 123.4. The average offered hourly wage for this group was $29.50 in the fourth quarter of 2023.
The sixth dark red bar represents the fourth quarter of 2024 for job vacancies requiring other non-university certificates and university certificates below a bachelor's degree, with job vacancies at 107.1. The average offered hourly wage for this group was $31.00 in the fourth quarter of 2024.
The seventh dark red bar represents the fourth quarter of 2023 for job vacancies requiring bachelor's degree or higher, with job vacancies at 94.7. The average offered hourly wage for this group was $40.45 in the fourth quarter of 2023.
The eighth dark red bar represents the fourth quarter of 2024 for job vacancies requiring bachelor's degree or higher, with job vacancies at 88.2. The average offered hourly wage for this group was $42.75 in the fourth quarter of 2024.
Note: Data are not seasonally adjusted.
Sources: Job Vacancy and Wage Survey (5217), table 14-10-0443-01, and Labour Force Survey (3701), table 14-10-0019-01.
Fewer job vacancies in 5 of 69 economic regions
In the fourth quarter, job vacancies were down in Alberta (-3,300 to 66,400) but up in Quebec (+6,300 to 130,500) and Prince Edward Island (+300 to 2,800). Job vacancies were little changed in the remaining provinces and territories.
At the regional level, job vacancies in the fourth quarter were down in Lower Mainland-Southwest, British Columbia (-4,000 to 56,400); Ottawa, Ontario (-2,000 to 15,600); Cape Breton, Nova Scotia (-700 to 2,100); Cariboo, British Columbia (-700 to 2,800); and Outaouais, Quebec (-600 to 3,400).
Meanwhile, increases in job vacancies were reported in seven regions, led by Laurentides, Quebec (+2,700 to 10,600), Northeast, Ontario (+1,200 to 9,100), and Estrie, Quebec (+1,100 to 9,100). Vacancies were little changed in the remaining economic regions.
Year over year, job vacancy rates were down in 56 of the 69 economic regions in the fourth quarter. The biggest declines were in Cariboo, British Columbia (-2.0 percentage points to 4.0%), Yorkton-Melville, Saskatchewan (-1.6 percentage points to 4.1%), Muskoka-Kawarthas, Ontario (-1.6 percentage points to 3.2%), and Stratford–Bruce Peninsula, Ontario (-1.6 percentage points to 2.7%).
Meanwhile, job vacancy rates increased in three economic regions: Parklands and North, Manitoba (+1.0 percentage points to 6.2%), Côte-Nord and Nord-du-Québec, Quebec (+0.8 percentage points to 5.1%), and Prince Edward Island (+0.4 percentage points to 3.8%). Parklands and North, Manitoba had the highest job vacancy rate across all economic regions in the fourth quarter. The remaining 10 economic regions were little changed.
Chart 4: 10 economic regions with the highest and lowest job vacancy rates

Description - Chart 4
Data table: 10 economic regions with the highest and lowest job vacancy rates
1. Year-over-year changes are not statistically significant.
Note: Data are seasonally adjusted.
Source: Job Vacancy and Wage Survey (5217), table 14-10-0398-01.
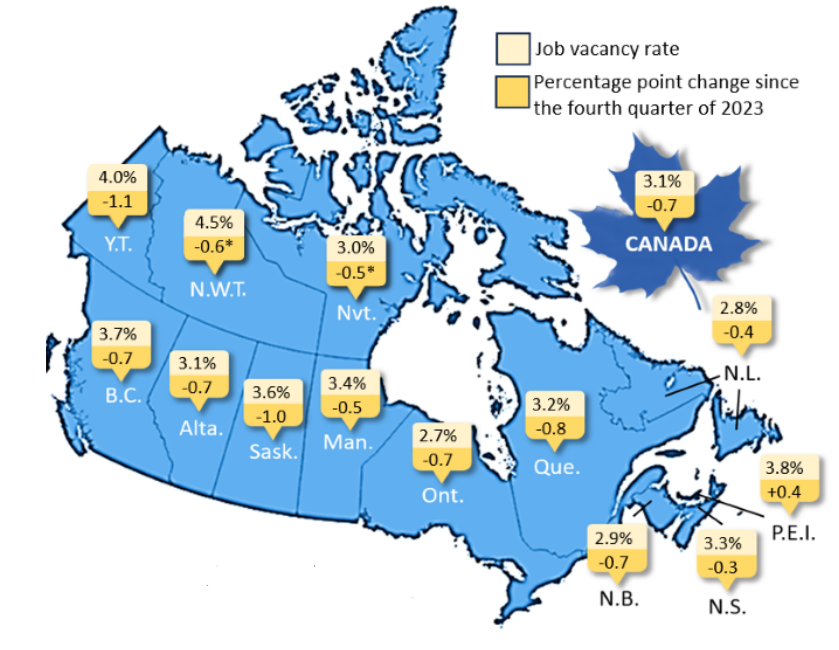
Map 1: Job vacancy rate by province and territory, fourth quarter of 2024
Description - Map 1
This is a map of Canada by province and territory showing job vacancy rate in the fourth quarter of 2024 and the percentage point change from the fourth quarter of 2023 to the fourth quarter of 2024.
The job vacancy rate in Canada was 3.1% in the fourth quarter of 2024, and the percentage point change from the fourth quarter of 2023 to the fourth quarter of 2024 was -0.7.
The job vacancy rate in Newfoundland and Labrador was 2.8% in the fourth quarter of 2024, and the percentage point change from the fourth quarter of 2023 to the fourth quarter of 2024 was -0.4.
The job vacancy rate in Prince Edward Island was 3.8% in the fourth quarter of 2024, and the percentage point change from the fourth quarter of 2023 to the fourth quarter of 2024 was +0.4.
The job vacancy rate in Nova Scotia was 3.3% in the fourth quarter of 2024, and the percentage point change from the fourth quarter of 2023 to the fourth quarter of 2024 was -0.3.
The job vacancy rate in New Brunswick was 2.9% in the fourth quarter of 2024, and the percentage point change from the fourth quarter of 2023 to the fourth quarter of 2024 was -0.7.
The job vacancy rate in Quebec was 3.2% in the fourth quarter of 2024, and the percentage point change from the fourth quarter of 2023 to the fourth quarter of 2024 was -0.8.
The job vacancy rate in Ontario was 2.7% in the fourth quarter of 2024, and the percentage point change from the fourth quarter of 2023 to the fourth quarter of 2024 was -0.7.
The job vacancy rate in Manitoba was 3.4% in the fourth quarter of 2024, and the percentage point change from the fourth quarter of 2023 to the fourth quarter of 2024 was -0.5.
The job vacancy rate in Saskatchewan was 3.6% in the fourth quarter of 2024, and the percentage point change from the fourth quarter of 2023 to the fourth quarter of 2024 was -1.0.
The job vacancy rate in Alberta was 3.1% in the fourth quarter of 2024, and the percentage point change from the fourth quarter of 2023 to the fourth quarter of 2024 was -0.7.
The job vacancy rate in British Columbia was 3.7% in the fourth quarter of 2024, and the percentage point change from the fourth quarter of 2023 to the fourth quarter of 2024 was -0.7.
The job vacancy rate in Yukon was 4.0% in the fourth quarter of 2024, and the percentage point change from the fourth quarter of 2023 to the fourth quarter of 2024 was -1.1.
The job vacancy rate in the Northwest Territories was 4.5% in the fourth quarter of 2024, and the percentage point change from the fourth quarter of 2023 to the fourth quarter of 2024 was -0.6*.
The job vacancy rate in Nunavut was 3.0% in the fourth quarter of 2024, and the percentage point change from the fourth quarter of 2023 to the fourth quarter of 2024 was -0.5*.
Notes: Not statistically significant changes are denoted with an asterisk (*). Data are seasonally adjusted.
Source: Job Vacancy and Wage Survey (5217), table 14-10-0398-01.
Note to readers
The Job Vacancy and Wage Survey (JVWS) provides comprehensive data on job vacancies and offered wages by industrial sector and detailed occupation for Canada and the provinces, territories and economic regions. Additional information is also available by occupation, such as the proportion of job vacancies for full-time and part-time positions, the duration of job vacancies, the levels of education and experience sought for the job, and other characteristics. Job vacancy, offered wage, and vacancy characteristics data are released quarterly.
Estimates by sector are based on the North American Industry Classification System 2022 Version 1.0. Estimates by geographical area are based on the Standard Geographical Classification 2021. Estimates by occupation reflect the National Occupational Classification (NOC) 2021 Version 1.0. The NOC is a five-tiered hierarchical structure of occupational groups with successive levels of disaggregation. The structure is as follows: (1) 10 broad occupational categories, also referred to as one-digit NOC; (2) 45 major groups, also referred to as two-digit NOC; (3) 89 sub-major groups, also referred to as three-digit NOC; (4) 162 minor groups, also referred to as four-digit NOC; and (5) 516 unit groups, also referred to as five-digit NOC.
Because of the COVID-19 pandemic, data collection for the JVWS was suspended for the second and third quarters of 2020.
Preliminary monthly estimates are produced for job vacancies and job vacancy rates by province and by industrial sector. These preliminary monthly JVWS estimates are released on a monthly basis with the estimates from Survey of Employment, Payrolls and Hours. More information about the concepts and use of data from the JVWS is available in the Guide to the Job Vacancy and Wage Survey (75-514-G).
The target population of the survey includes all business locations in Canada, excluding those involved primarily in religious organizations and private households. Federal, provincial, and territorial, as well as international and other extraterritorial public administrations, are also excluded from the survey.
Unless otherwise stated, this release presents seasonally adjusted estimates, which facilitate comparisons by removing the effects of seasonal variations. For more information on seasonal adjustment, see Seasonally adjusted data – Frequently asked questions.
Seasonally adjusted quarterly job vacancy data are available online (tables 14-10-0398-01, 14-10-0399-01 and 14-10-0400-01). The analyses of the job vacancy levels and rates by sector (20 broad industrial sector groups), one-digit NOC (10 broad occupational categories), province and economic region are based on seasonally adjusted data. However, the analyses of the job vacancy levels and rates by subsector, two-digit NOC, three-digit NOC, four-digit NOC, and five-digit NOC are based on non-seasonally adjusted data.
The unemployment-to-job vacancy ratio excludes the territories for consistency with the geographic coverage of the Labour Force Survey.
This analysis focuses on differences between estimates that are statistically significant at the 68% confidence level.
Data tables
Tables 14-10-0325, 14-10-0326, 14-10-0328 and 14-10-0356 have now been archived. They have been replaced with 14-10-0441-01, 14-10-0442-01, 14-10-0443-01, and 14-10-0444-01, respectively, presenting the new classifications.
Data tables are updated on March 18, 2025.
Reference
Data tables: Access the latest tables.
- Note: some data tables may best be viewed on desktop.
Definitions, data sources and methods: survey number 5217.
Previous release: Job vacancies, third quarter 2024.
Contact information
For more information, or to enquire about the concepts, methods or data quality of this release, contact us (toll-free 1-800-263-1136; 514-283-8300; infostats@statcan.gc.ca) or Media Relations (statcan.mediahotline-ligneinfomedias.statcan@statcan.gc.ca).