

In December, the business opening rate dropped 0.3 percentage points to 4.7% following an increase of a similar extent in the previous month. The business closure rate contracted 0.2 percentage points to 4.7% in December after holding relatively steady at 4.9% over the previous two months. In December, the opening rate was equal to its 2015-to-2019 historical average whereas the closure rate settled 0.1 percentage points above its historical average.
Chart 1: Monthly business openings and closures as a percentage of active businesses, business sector, January 2023 to December 2024, seasonally adjusted data
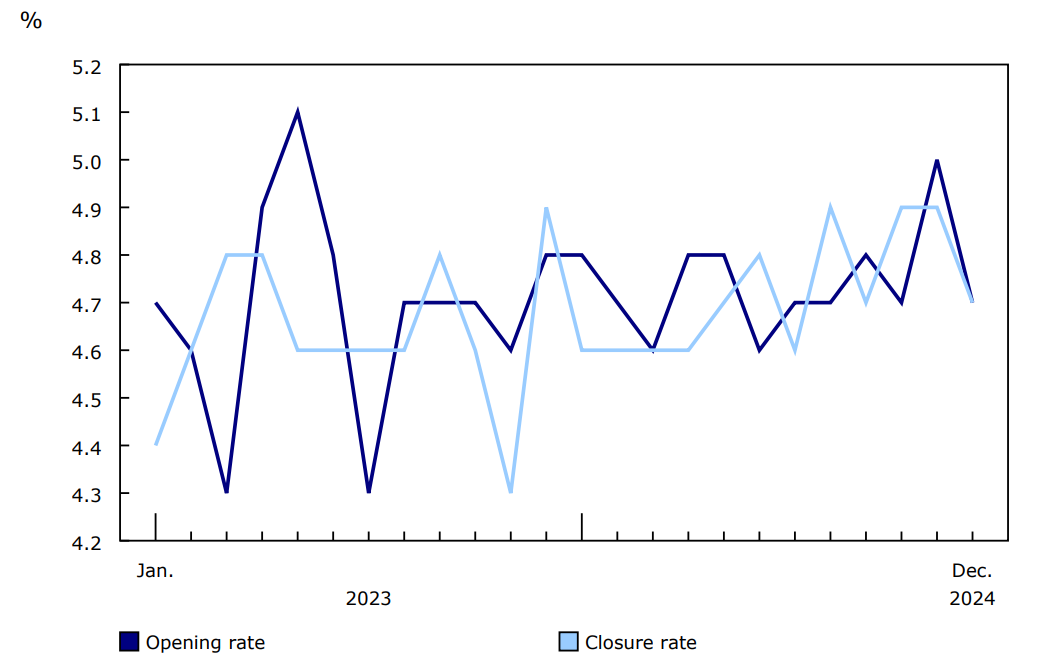
Source: Table 33-10-0270-01.
In December 2024, the number of active businesses rose slightly by 0.1% (+822 businesses) as the number of openings was a little higher than that of closures. In the same month, payroll employment grew 0.1%, real gross domestic product increased by 0.2% and business insolvency filings dropped from 465 in November to 392 in December.
The decline in the business opening rate in December was largely driven by the 0.3 percentage point decrease in the reopening rate (to 3.0%) as the entry rate held relatively steady at 1.7% for a second consecutive month. While the reopening rate was 0.1 percentage points above its historical average, the entry rate was 0.1 percentage points below its historical average.
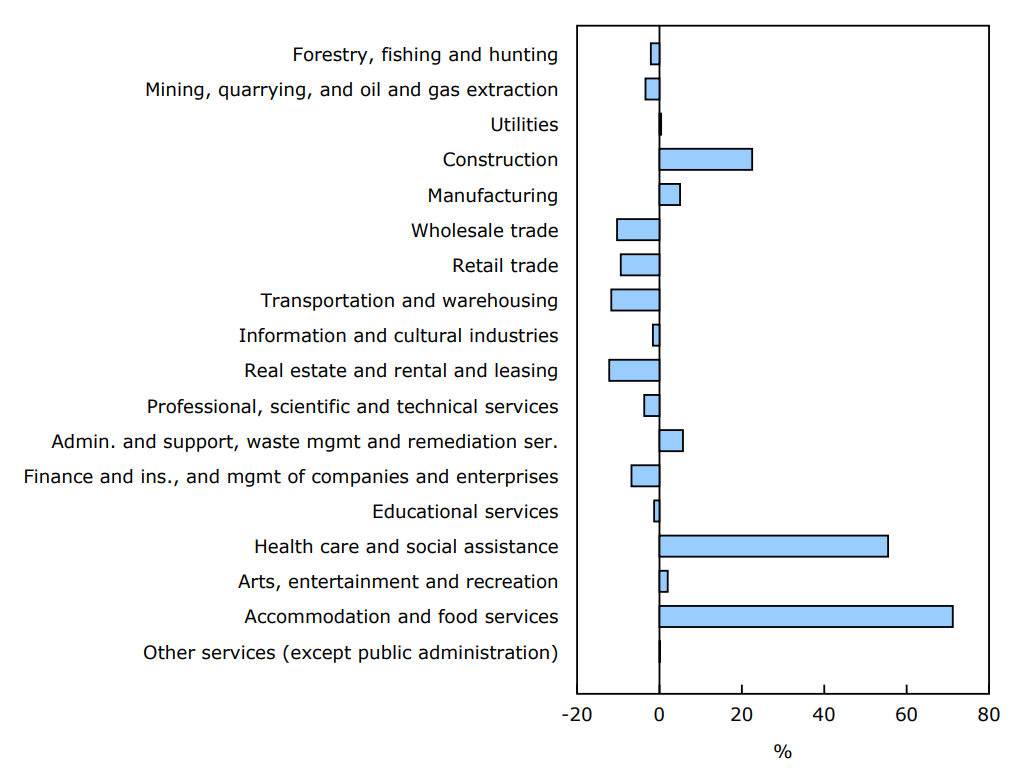
In December, the change in the number of active businesses varied across sectors. The increase in the overall number of active businesses was driven by accommodation and food services (+726 businesses compared with November; 71.2% contribution to the increase in the overall number of active businesses). It was followed by health care and social assistance (+566 businesses; 55.5% contribution) and construction (+230 businesses; 22.5% contribution).
The increase in the overall number of active businesses in December was largely mitigated by the decrease in transportation and warehousing (-119 businesses; 11.7% negative contribution), wholesale trade (-105 businesses; 10.3% negative contribution) and retail trade (-96 businesses; 9.4% negative contribution).
Chart 2: Percent contribution of sectors to the increase in the number of active businesses, November to December 2024, seasonally adjusted data
Description - Chart 2
Source: Table 33-10-0270-01.
The number of active businesses remains relatively stable in 2024
In 2024, the business opening rate ranged from 4.6% to 5.0%. With the exception of March and June (4.6% for each), the opening rate was greater than or equal to its historical average of 4.7% in every month. The closure rate ranged from 4.6% to 4.9% and has remained at or above its historical average of 4.6% throughout 2024.
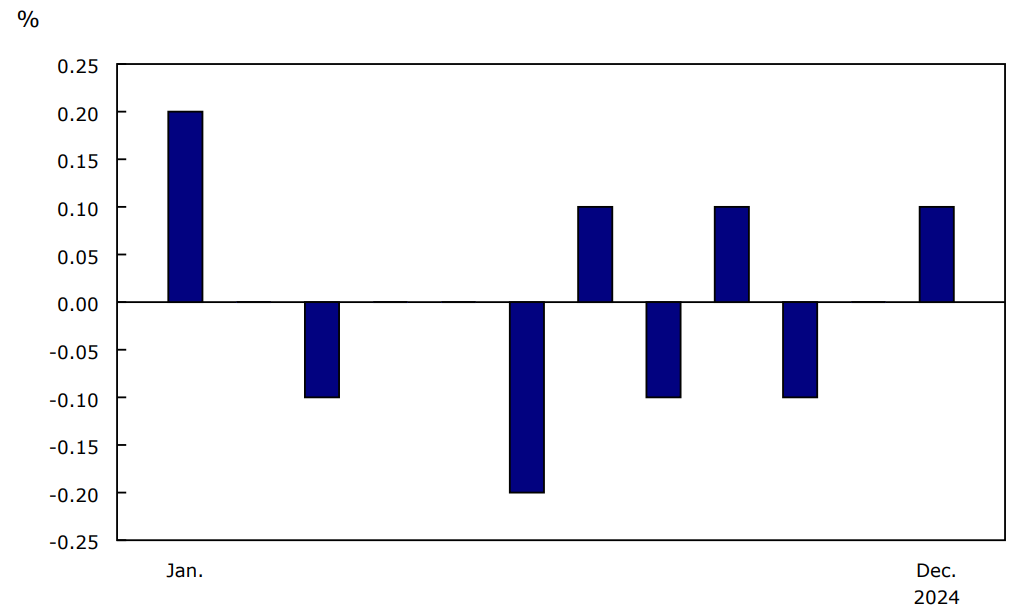
For eight months in 2024, there was negative or relatively no growth in the number of active businesses. The largest growth in the number of active businesses was recorded in January (+0.2% growth rate; +1,457 businesses). It's also worth noting the 0.2% decline (-2,044 businesses) in the number of active businesses in June.
Chart 3: Monthly growth rate of the number of active businesses, business sector, January to December 2024, seasonally adjusted data
Description - Chart 3
Source: Table 33-10-0270-01.
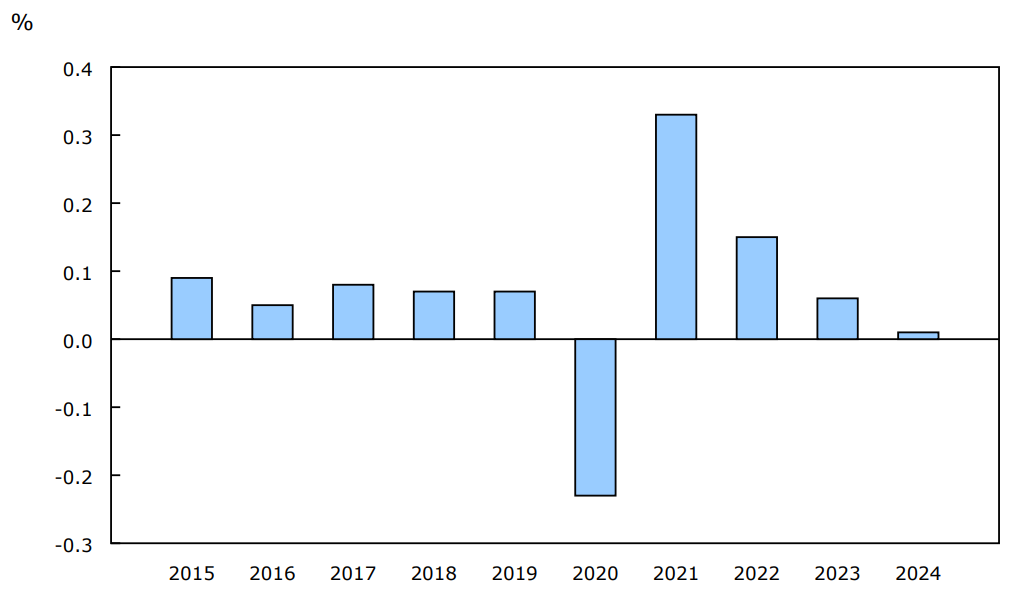
With the exception of 2020 and the beginning of the COVID-19 pandemic, the monthly average number of active businesses has been on an upward trend since 2015. However, the pace of growth has slowed since 2022. Indeed, the monthly average growth rate in the number of active businesses dropped from 0.15% in 2022 to 0.06% in 2023 and 0.01% in 2024. The monthly average closure rate was 4.7% in 2024 and equal to the monthly average opening rate, which explains the slight variation in the average number of active businesses from 2023 to 2024.
Chart 4: Monthly average growth rate of active businesses, business sector, 2015 to 2024, seasonally adjusted data
Description - Chart 4
Data table: Monthly average growth rate of active businesses, business sector, 2015 to 2024, seasonally adjusted data
Source: Table 33-10-0270-01.
Note to readers
With each release, data for the preceding month are revised as additional information becomes available. This may also involve minor revisions to historical data due to seasonal adjustment. Users are encouraged to use the most up-to-date data available for each month.
Seasonal adjustment is applied separately to each sector to account for unique patterns, which can lead to discrepancies between business sector figures and the sum of sector-specific ones.
Percentages in Chart 2 represent the contribution of each sector to the business sector's overall variation. The percentage is negative when the direction of the sector's variation is different from that of the overall variation, and it's positive when sectoral and overall variation are in the same direction.
More precisely, a sector's contribution is negative if it shows a decrease in active businesses, while the total number of active businesses has increased. Similarly, a sector's contribution is negative if it shows an increase in active businesses, while the total number of active businesses has fallen.
For more information on the data presented in this release, see the Monthly Business Openings and Closures (5401) survey page.
Reference
Data tables: 33-10-0270-01 and 33-10-0722-01.
- Note: some data tables may best be viewed on desktop.
Definitions, data sources and methods: survey number 5401.
Previous release: Monthly estimates of business openings and closures, November 2024.
Contact information
For more information, or to enquire about the concepts, methods or data quality of this release, contact us (toll-free 1-800-263-1136; 514-283-8300; infostats@statcan.gc.ca) or Media Relations (statcan.mediahotline-ligneinfomedias.statcan@statcan.gc.ca).