

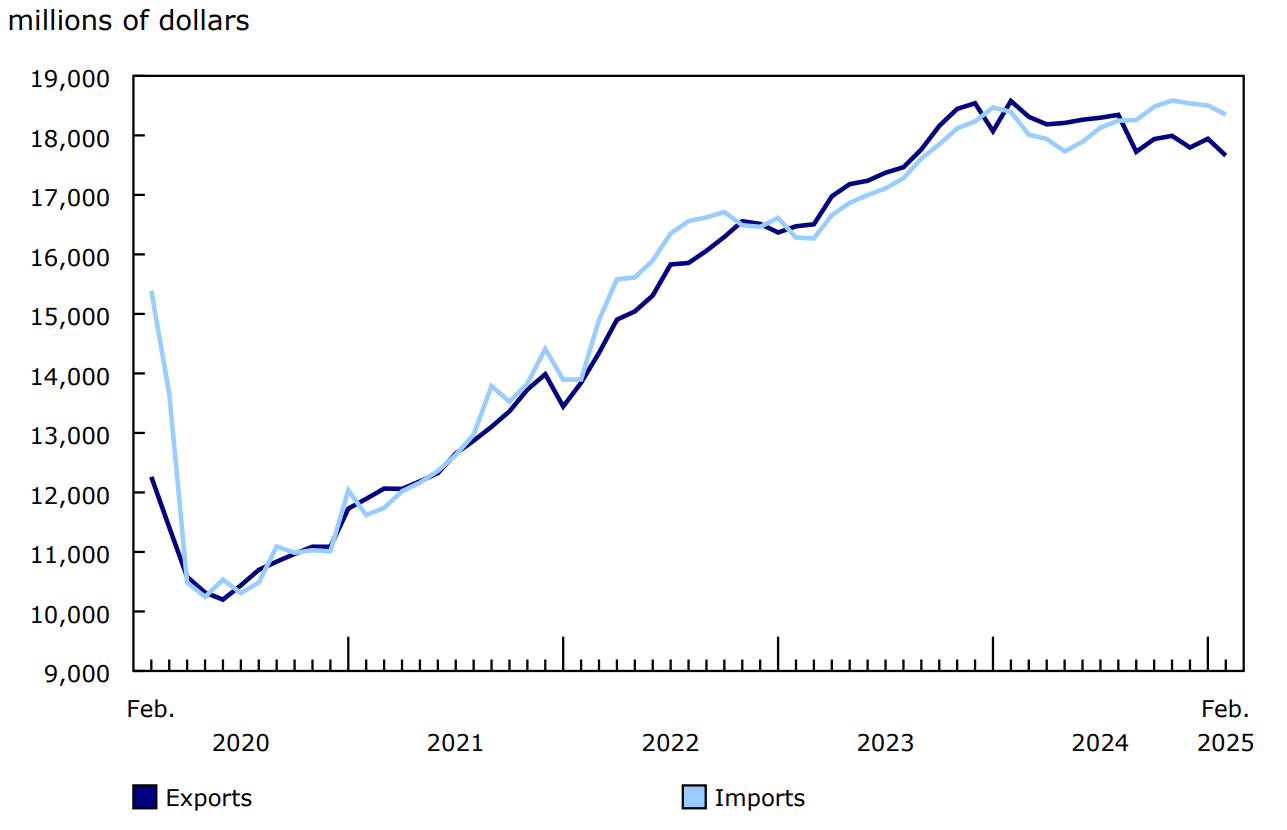
Canada's monthly international trade in services deficit widened from $0.6 billion in January to $0.7 billion in February. Overall, exports of services declined 1.6% to $17.7 billion, while imports of services were down 0.8% to $18.3 billion.
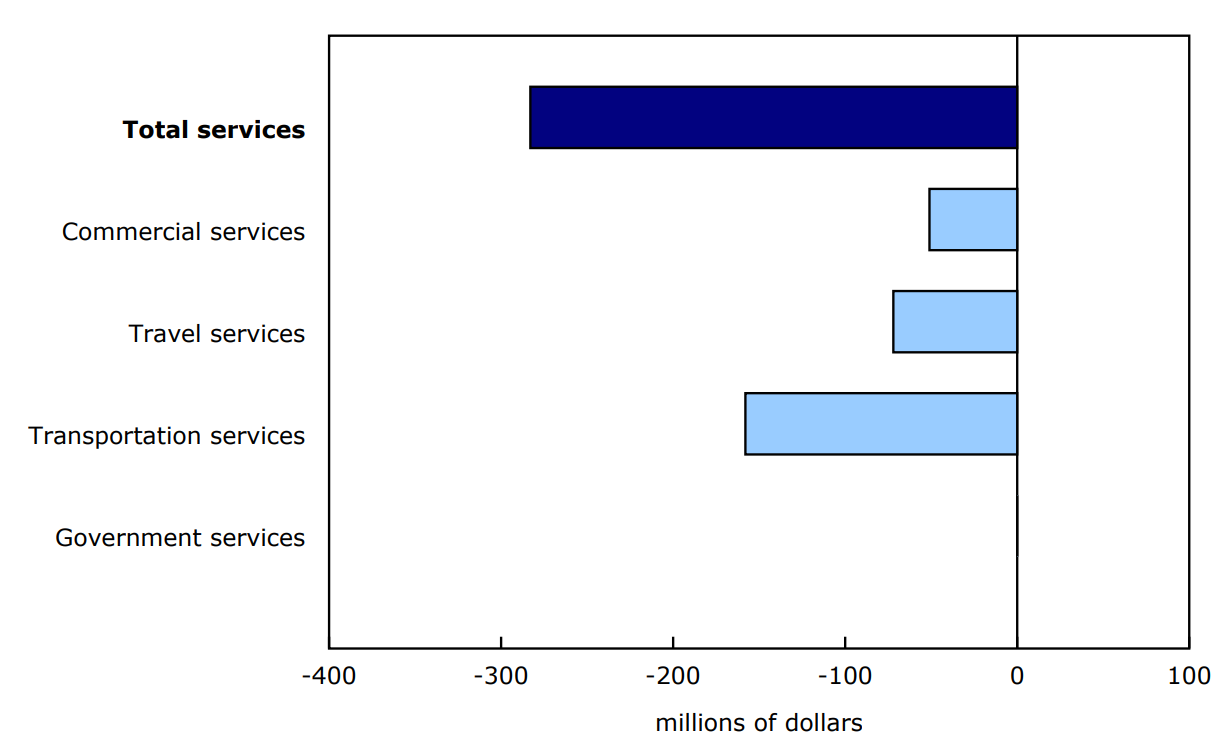
Exports of transportation services declined 7.7% to $1.9 billion in February, largely due to lower receipts of passenger fares. Exports of commercial services (-0.5%) and travel services (-1.3%) also recorded decreases.
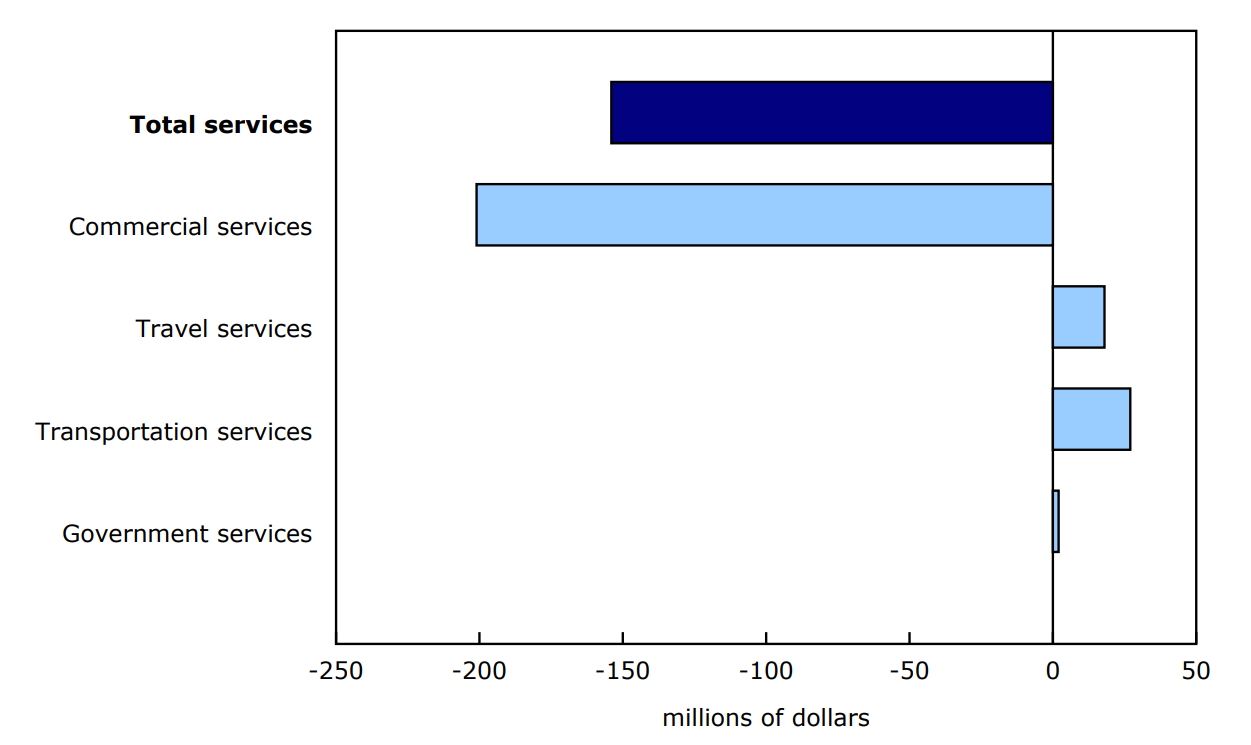
Imports of commercial services decreased 2.0% to $10.0 billion in February, following an increase of 2.5% in January. Both the increase in January and the decrease in February were largely due to imports of financial services. Imports of travel services (+0.4%) rose slightly in February, as lower spending by Canadian-resident travellers in the United States was more than offset by higher spending by Canadian-resident travellers in non-US countries. The lower spending in the United States occurred as the number of Canadian-resident return trips from the United States recorded a steep decline on a year-over-year basis.
To explore the most recent results of Canada's international trade in services in an interactive format, see the International trade monthly interactive dashboard.
Chart 1: International trade in services
Description - Chart 1
Data table: International trade in services
Note: Data are seasonally adjusted.
Source: Table 12-10-0144-01.
Total exports of goods fell 5.5% to $70.1 billion in February, while total imports of goods were up 0.8% to $71.6 billion. This resulted in the goods trade balance going from a surplus of $3.1 billion in January to a deficit of $1.5 billion in February. Combined, the trade balance for goods and services amounted to a deficit of $2.2 billion in February.
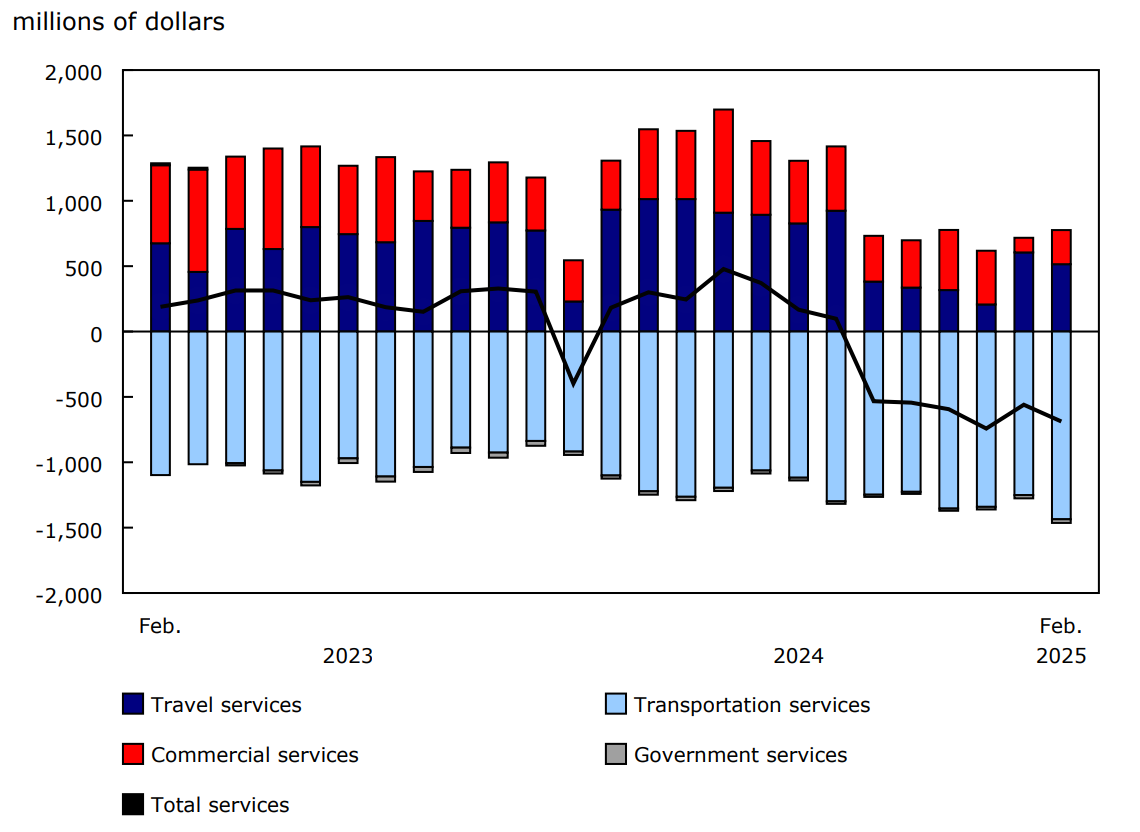
Chart 2: International trade in services, balances
Description - Chart 2
Data table: International trade in services, balances
Note: Data are seasonally adjusted.
Source: Table 12-10-0144-01.
Chart 3: Contribution to the monthly change in exports, February 2025
Description - Chart 3
Data table: Contribution to the monthly change in exports, February 2025
Note: Data are seasonally adjusted.
Source: Table 12-10-0144-01.
Chart 4: Contribution to the monthly change in imports, February 2025
Description - Chart 4
Data table: Contribution to the monthly change in imports, February 2025
Note: Data are seasonally adjusted.
Source: Table 12-10-0144-01.
Table 1: International trade in services—seasonally adjusted
Table 2: International trade in goods and services—seasonally adjusted
Reference
Data table: 12-10-0144-01.
- Note: some data tables may best be viewed on desktop.
Definitions, data sources and methods: survey number 1536.
Previous release: Canadian international trade in services, January 2025.
Next release: May 6, 2025.
Contact information
For more information, or to enquire about the concepts, methods or data quality of this release, contact us (toll-free 1-800-263-1136; 514-283-8300; infostats@statcan.gc.ca) or Media Relations (statcan.mediahotline-ligneinfomedias.statcan@statcan.gc.ca).