

In March, the preliminary number of international arrivals (returning Canadian residents and non-residents combined) to Canada by air and automobile was 4.9 million, down 14.0% from March 2024. This was the second consecutive month of year-over-year decline and the second decline observed since March 2021.
Non-resident trips to Canada by air decline
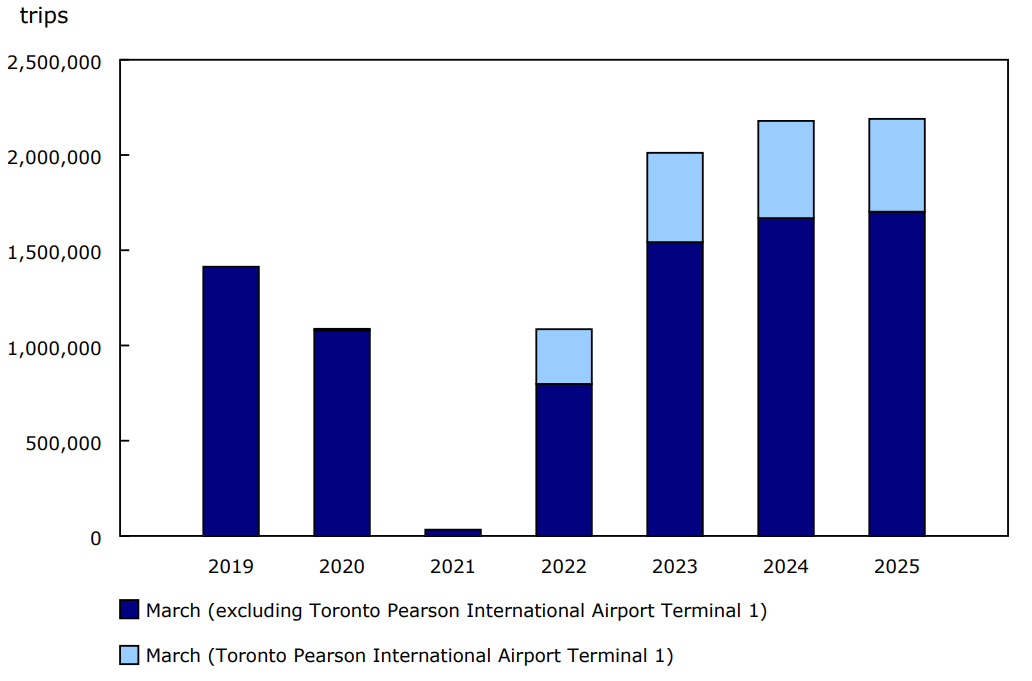
In March 2025, non-resident arrivals to Canada by air totalled 532,900, down 7.4% year over year (Chart 1). There were fewer arrivals by residents of countries other than the United States (245,900; -15.8%) from the same month in 2024, while arrivals by residents of the United States posted a modest gain (287,000; +1.2%).
According to the daily traffic data, in March 2025, the highest number of US-resident arrivals per day was observed on Friday, March 28 (12,700), which was 16.5% higher than the daily average for the other Fridays of the month.
Chart 1: Non-resident trips to Canada by commercial aircraft, March, 2019 to 2025

Description - Chart 1
Data table: Non-resident trips to Canada by commercial aircraft, March, 2019 to 2025
Source: Table 24-10-0056-01.
Chart 2: Trips to Canada by commercial aircraft, by country of residence, March 2025

Description - Chart 2
The title of the chart 2 is "Trips to Canada by commercial aircraft, by country of residence, March 2025"
This is a line chart.
The vertical axis shows the number of trips, from 0 to 90,000, by increments of 10,000.
The horizontal axis shows the days from March 1 to 31, by increments of one day.
There are three series in this chart.
The first series is United States residents. The lowest point on this line is 6,920 on March 15, and the highest point on this line is 12,672 on March 28.
The second series is overseas residents. The lowest point on this line is 5,776 on March 15, and the highest point on this line is 11,646 on March 1.
The third series is Canadian residents. The lowest point on this line is 55,952 on March 25 and the highest point on this line is 83,228 on March 16.
Source: Table 24-10-0056-01.
Canadian-resident return trips by air up marginally
In March, Canadian-resident return trips by air from both the United States and countries other than the United States stood at 2.2 million, a slight increase of 0.5% from the same month one year earlier (Chart 3) which was driven by an increase (+9.1%) in return trips from countries other than the United States. In contrast, the return trips that Canadian residents made by air from the United States were 13.5% lower than the same month in 2024.
From Friday, March 7 to Sunday, March 9, 2025, a daily average of 78,100 returning Canadian-resident arrivals was observed. This was 7.6% higher than the average for the other Friday-to-Sunday periods during the month.
Chart 3: Canadian-resident return trips from abroad by commercial aircraft, March, 2019 to 2025
Description - Chart 3
Data table: Canadian-resident return trips from abroad by commercial aircraft, March, 2019 to 2025
Source: Table 24-10-0057-01.
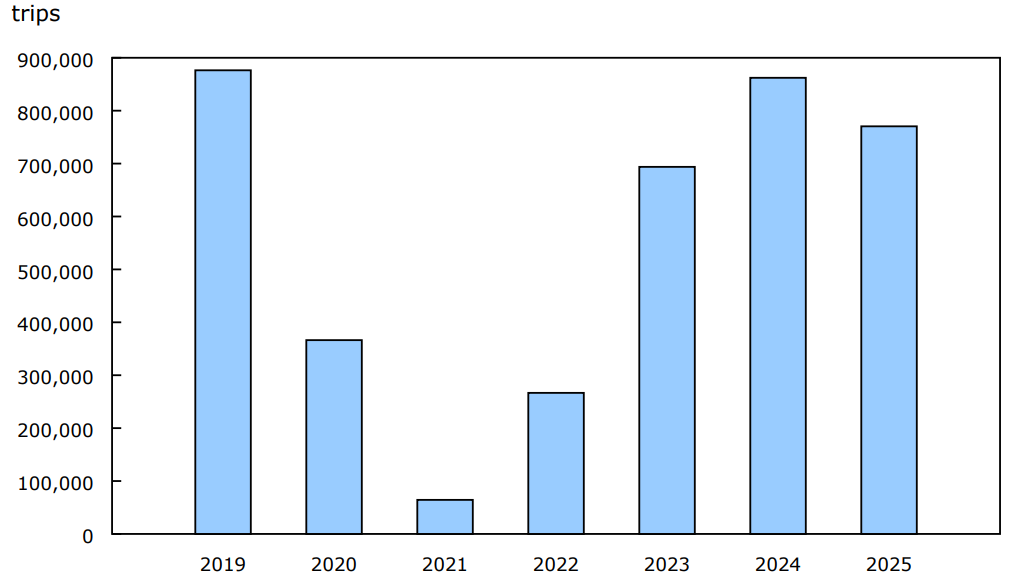
US-resident trips to Canada by automobile decrease
In March, the number of US-resident trips to Canada by automobile was 770,400, a decline of 10.6% from the same month in 2024 (Chart 4). This was the second consecutive month of year-over-year decline and the third decline observed since March 2021.
In March 2025, the highest number of arrivals per day was observed on Saturday, March 22 (44,200), and the lowest was seen on Tuesday, March 4 (12,900).
Chart 4: United States-resident trips to Canada by automobile, March, 2019 to 2025
Description - Chart 4
Data table: United States-resident trips to Canada by automobile, March, 2019 to 2025
Source: Table 24-10-0057-01.
Chart 5: Trips to Canada by automobile, by country of residence, March 2025

Description - Chart 5
The title of the chart 5 is "Trips to Canada by automobile, by country of residence, March 2025"
This is a line chart.
The vertical axis shows the number of trips, from 0 to 100,000 by increments of 10,000.
The horizontal axis shows the days from March 1 to 31, by increments of one day.
There are two series in this chart.
The first series is United States residents. The lowest point on this line is 12,853 on March 4, and the highest point on this line is 44,173 on March 22.
The second series is Canadian residents. The lowest point on this line is 33,419 on March 20 and the highest point on this line is 88,721 on March 16.
Source: Table 24-10-0057-01.
Canadian-resident return trips from the United States by automobile continue to decline
In March, the number of Canadian-resident return trips by automobile from the United States totalled 1.5 million, a steep decline (-31.9%) from the same month in 2024 (Chart 6). March 2025 marked the third consecutive month of year-over-year decline, and the third decline observed since March 2021.
In March 2025, from Friday, March 14 to Sunday, March 16, an average of 67,300 returning Canadian-resident arrivals per day was observed. This average was 32.1% higher than the daily average for the other Friday-to-Sunday periods in March.
Chart 6: Canadian-resident return trips from the United States by automobile, March, 2019 to 2025

Description - Chart 6
Data table: Canadian-resident return trips from the United States by automobile, March, 2019 to 2025
Source: Table 24-10-0057-01.
Focus on Canada and the United States
In March 2025, the number of arrivals to Canada by US residents by air increased 1.2% from the same month in 2024, while arrivals by automobile decreased 10.6%.
In March 2025, Canadian residents flew back from 719,500 trips to the United States, which represented a 13.5% decline from the same month in 2024. For Canadian-resident return trips by automobile from the United States, March 2025 saw a decline of 31.9% to 1.5 million. This was the third consecutive month of year-over-year decline.
For more data and insights on areas touched by the socio-economic relationship between Canada and the United States, see the Focus on Canada and the United States webpage.
Note to readers
This release provides an early indicator of travel based on preliminary data on international arrivals to Canada for March 2025 for air and automobile (arrivals by automobile made by overseas residents are not included in this release). Complete counts will be available with the release of "Travel between Canada and other countries" on May 22.
For more information on concepts, definitions, data sources and methods, refer to Frontier Counts.
Data sources
All counts of arrivals by air are from commercial aircraft and are produced exclusively using primary inspection kiosk (PIK) data received from the Canada Border Services Agency (CBSA). PIKs were deployed at Toronto Pearson International Airport Terminal 1 on June 22, 2021, and, as of July 2021, these arrivals are included in the total counts, which has consequently improved coverage. In 2024, PIKs captured 90.3% of all commercial air arrivals.
Counts of arrivals to the country by automobile through land ports equipped with the CBSA's automated Integrated Primary Inspection Line (IPIL) system represent a subset of US-resident trips and Canadian-resident return trips by automobile. In 2024, IPIL land ports captured 88.9% of all automobile entries.
Please be advised that for March 11 and 12, 2025, some PIK records received from CBSA were incomplete. Data imputation has been applied to country of residence for non-residents. Other variables released by Frontier Counts were either not impacted or could be directly determined by travellers' responses to other questions.
Reference
Data tables: Access the latest tables.
- Note: some data tables may best be viewed on desktop.
Definitions, data sources and methods: survey number 5005.
Previous release: Leading indicator of international arrivals to Canada, February 2025.
Next release: May 12, 2025.
Contact information
For more information, or to enquire about the concepts, methods or data quality of this release, contact us (toll-free 1-800-263-1136; 514-283-8300; infostats@statcan.gc.ca) or Media Relations (statcan.mediahotline-ligneinfomedias.statcan@statcan.gc.ca).