

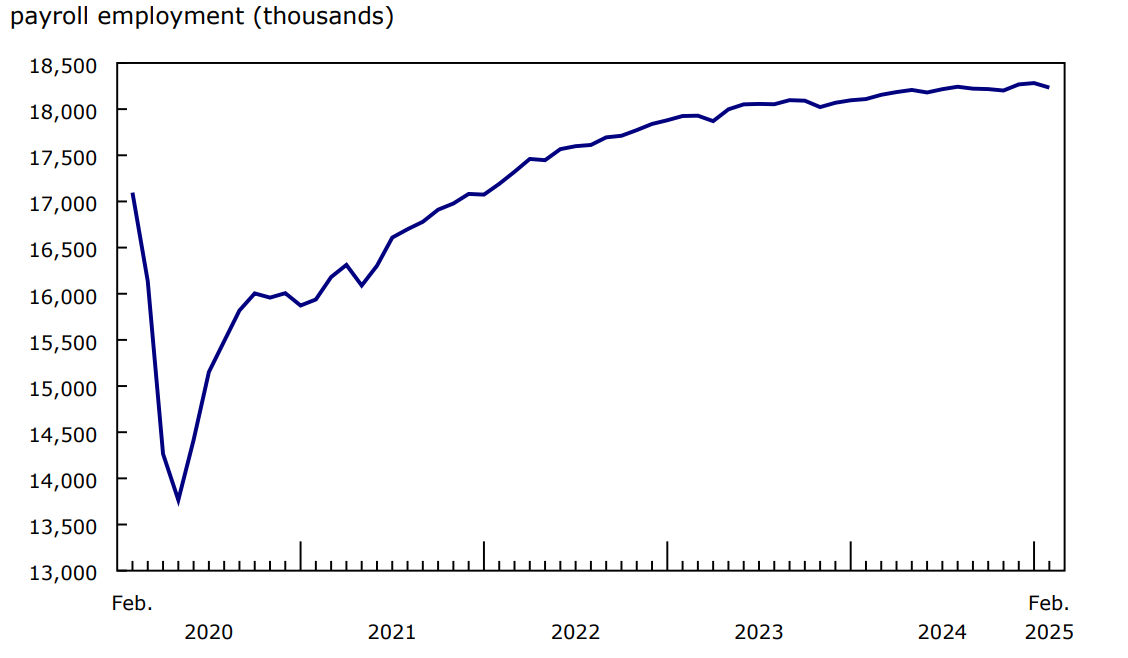
The number of employees receiving pay and benefits from their employer—measured as "payroll employment" in the Survey of Employment, Payrolls and Hours—decreased by 49,000 (-0.3%) in February, following an increase of 14,400 (+0.1%) in January. On a year-over-year basis, payroll employment was up 124,300 (+0.7%) in February.
Chart 1: Payroll employment declines in February following an increase in January
Description - Chart 1
Data table: Payroll employment declines in February following an increase in January
Source: Survey of Employment, Payrolls and Hours (2612), table 14-10-0220-01.
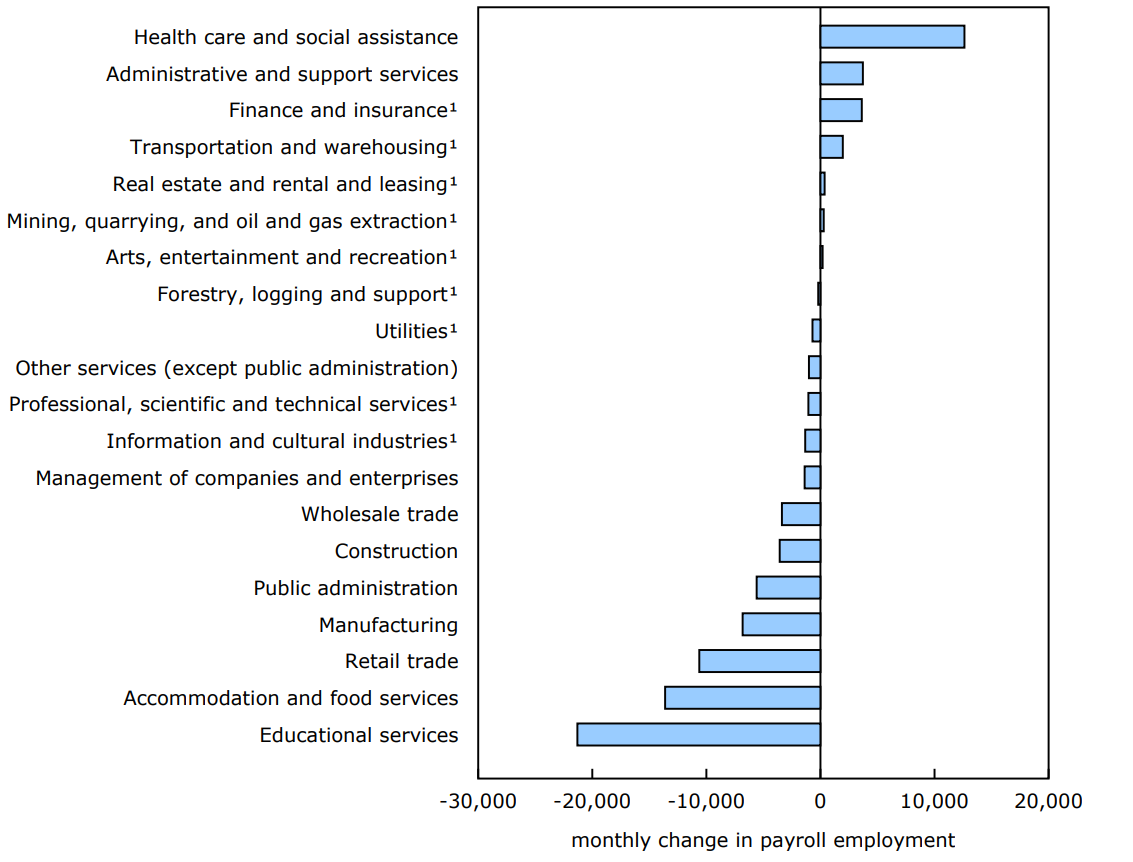
In February, monthly payroll employment declines were recorded in 9 of the 20 sectors, including educational services (-21,300; -1.4%), accommodation and food services (-13,600; -1.0%), retail trade (-10,600; -0.5%), manufacturing (-6,800; -0.4%) and public administration (-5,600; -0.4%). Health care and social assistance (+12,600; +0.5%) as well as administrative and support, waste management and remediation services (+3,700; +0.5%) were the only sectors to record increases in February. The remaining nine sectors were little changed.
Meanwhile, in February, there were 528,000 job vacancies in Canada, marking the sixth consecutive month of little change. On a year-over-year basis, job vacancies were down by 131,100 (-19.9%) in February.
Chart 2: Payroll employment in February decreases in nine sectors and increases in two
Description - Chart 2
Data table: Payroll employment in February decreases in nine sectors and increases in two
1. Payroll employment changes are not statistically significant.
Source: Survey of Employment, Payrolls and Hours (2612), table 14-10-0220-01.
Payroll employment loss in educational services in February offsets the gain in January
Payroll employment in the educational services sector decreased by 21,300 (-1.4%) in February, offsetting the increase in January (+20,400; +1.4%). The sector has recorded little overall change in payroll employment since July 2024, following a net gain of 42,200 (+2.9%) from January to July 2024.
On a year-over-year basis, payroll employment in educational services was up 27,700 (+1.9%) in February 2025. Elementary and secondary schools (+31,400; +3.7%) recorded the largest increase over this period.
Payroll employment in accommodation and food services decreases in February
Payroll employment in accommodation and food services decreased by 13,600 (-1.0%) in February, bringing the cumulative decline since December 2024 to 19,200 (-1.5%). The decline over the two-month period was driven by full-service restaurants and limited-service eating places (-18,400; -1.8%).
February payroll employment loss in retail trade more than offsets the gain in January
Payroll employment in retail trade decreased by 10,600 (-0.5%) in February, more than offsetting the gain observed in January (+5,700; +0.3%). On a year-over-year basis, payroll employment in retail trade was down 28,500 (-1.4%) in February.
The month-over-month decline in February in payroll employment in the retail trade sector was led by health and personal care retailers (-2,200; -1.0%), warehouse clubs, supercentres and other general merchandise retailers (-2,100; -1.3%) and building material and supplies dealers (-1,600; -1.2%).
Payroll employment in manufacturing decreases in February
Payroll employment in the manufacturing sector decreased by 6,800 (-0.4%) in February. Despite the monthly decline, payroll employment in the sector has recorded little net variation in recent years. In February, payroll employment in the sector was down by 6,600 (-0.4%) compared with one year earlier and up by 8,400 (+0.5%) compared with January 2022.
Machinery manufacturing (-1,600; -1.1%) was the largest contributor to the overall decline in February 2025, followed by fabricated metal products manufacturing (-1,100; -0.7%) and chemical manufacturing (-1,000; -1.1%).
Payroll employment in automotive manufacturing industries (which include motor vehicle manufacturing, motor vehicle parts manufacturing and motor vehicle body and trailer manufacturing) edged down in February (-500; -0.4%) and was down 2,100 (-1.6%) compared with one year earlier. The year-over-year decline in automotive industries largely reflects the decline in motor vehicle parts manufacturing (-2,100; -2.9%).
Payroll employment continues to trend upwards in health care and social assistance in February
Payroll employment in health care and social assistance increased by 12,600 (+0.5%) in February, continuing the upward trend observed since September 2022, with a cumulative gain of 219,400 (+9.8%) over this period.
The gain in February 2025 was broad-based, with increases being recorded in nursing and residential care facilities (+5,100; +1.0%), ambulatory health care services (+3,600; +0.5%), hospitals (+2,100; +0.3%) and social assistance (+1,800; +0.4%).
Average weekly earnings increase in February on a year-over-year basis
On a year-over-year basis, average weekly earnings were up 5.4% to $1,298 in February, following a 5.6% increase in January. In general, growth in average weekly earnings can reflect a range of factors, including changes in wages, composition of employment, hours worked and base-year effects.
Month over month, average weekly earnings were little changed in February.
Average weekly hours in February (33.5 hours) were unchanged on a month-over-month and year-over-year basis.
Job vacancies little changed in February
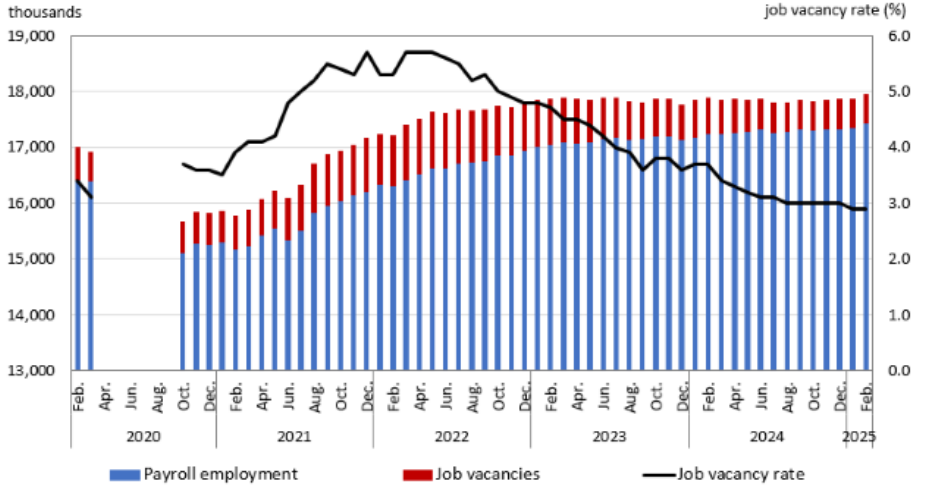
In February, there were 528,000 job vacancies in Canada, marking the sixth consecutive month of little change. On a year-over-year basis, job vacancies were down by 131,100 (-19.9%).
The job vacancy rate—which corresponds to the number of vacant positions as a proportion of total labour demand—was 2.9% in February. This was unchanged from the previous month but down by 0.8 percentage points from February 2024 (3.7%).
There were 2.8 unemployed persons for every job vacancy in February 2025, up from 2.0 in February 2024. The unemployment-to-job vacancy ratio has held steady since August 2024, at 2.8, except in November 2024 and January 2025, when the ratio was 2.9.
Chart 3: Job vacancies and job vacancy rate little changed in February
Description - Chart 3
The title of the chart is "Job vacancies and job vacancy rate little changed in February"
This is a linear and bar combination chart.
The vertical axis on the left shows the number of job vacancies and number of payroll employment in thousands, by increments of 1,000. It starts at 13,000 and ends at 19,000.
The vertical axis on the right shows the job vacancy rate by percentage, by increments of 1 percentage point. It starts at 0.0 and ends at 6.0.
The horizontal axis shows each month from February 2020 to February 2025.
The dark red bar represents the number of job vacancies (in thousands) in the last 61 months, with 578.1 in February 2020, 531.5 in March 2020, April 2020 to September 2020 omitted because data were not collected during this phase of the COVID-19 pandemic, 576.3 in October 2020, 569.5 in November 2020, 572.4 in December 2020, 561.3 in January 2021, 616.6 in February 2021, 643.7 in March 2021, 651.9 in April 2021, 673.6 in May 2021, 770.3 in June 2021, 812.8 in July 2021, 876.3 in August 2021, 928.2 in September 2021, 919.3 in October 2021, 908.4 in November 2021, 976.5 in December 2021, 922.0 in January 2022, 917.3 in February 2022, 990.2 in March 2022, 992.9 in April 2022, 1,003.4 in May 2022, 989.1 in June 2022, 978.5 in July 2022, 924.3 in August 2022, 932.3 in September 2022, 888.3 in October 2022, 866.7 in November 2022, 854.3 in December 2022, 858.8 in January 2023, 835.1 in February 2023, 803.5 in March 2023, 798.8 in April 2023, 776.8 in May 2023, 744.5 in June 2023, 717.9 in July 2023, 694.6 in August 2023, 644.6 in September 2023, 672.6 in October 2023, 671.8 in November 2023, 634.2 in December 2023, 662.9 in January 2024, 659.1 in February 2024, 602.5 in March 2024, 592.9 in April 2024, 571.3 in May 2024, 552.9 in June 2024, 548.0 in July 2024, 532.2 in August 2024, 532.4 in September 2024, 527.3 in October 2024, 533.9 in November 2024, 538.7 in December 2024, 524.9 in January 2025 and 528.0 in February 2025.
The blue bar represents the payroll employment (in thousands) in the last 61 months, with 16,419.5 in February 2020, 16,386.5 in March 2020, April 2020 to September 2020 omitted because data were not collected during this phase of the pandemic, 15,099.8 in October 2020, 15,276.8 in November 2020, 15,248.1 in December 2020, 15,294.4 in January 2021, 15,167.5 in February 2021, 15,233.1 in March 2021, 15,432.0 in April 2021, 15,556.6 in May 2021, 15,334.5 in June 2021, 15,505.9 in July 2021, 15,826.9 in August 2021, 15,940.4 in September 2021, 16,025.9 in October 2021, 16,130.7 in November 2021, 16,204.2 in December 2021, 16,323.3 in January 2022, 16,300.7 in February 2022, 16,420.0 in March 2022, 16,512.1 in April 2022, 16,622.4 in May 2022, 16,625.2 in June 2022, 16,701.8 in July 2022, 16,737.0 in August 2022, 16,756.7 in September 2022, 16,850.6 in October 2022, 16,853.4 in November 2022, 16,931.9 in December 2022, 16,995.4 in January 2023, 17,038.9 in February 2023, 17,094.0 in March 2023, 17,075.1 in April 2023, 17,077.5 in May 2023, 17,142.8 in June 2023, 17,164.2 in July 2023, 17,131.3 in August 2023, 17,154.4 in September 2023, 17,202.1 in October 2023, 17,186.9 in November 2023, 17,132.6 in December 2023, 17,182.8 in January 2024, 17,235.2 in February 2024, 17,241.3 in March 2024, 17,266.4 in April 2024, 17,269.6 in May 2024, 17,316.6 in June 2024, 17,262.0 in July 2024, 17,280.2 in August 2024, 17,323.6 in September 2024, 17,302.9 in October 2024, 17,323.5 in November 2024, 17,319.9 in December 2024, 17,348.4 in January 2025 and 17,428.3 in February 2025.
The black line represents the job vacancy rate (in percentage) in the last 61 months, with 3.4% in February 2020, 3.1% in March 2020, April 2020 to September 2020 omitted because data were not collected during this phase of the pandemic, 3.7% in October 2020, 3.6% in November 2020, 3.6% in December 2020, 3.5% in January 2021, 3.9% in February 2021, 4.1% in March 2021, 4.1% in April 2021, 4.2% in May 2021, 4.8% in June 2021, 5.0% in July 2021, 5.2% in August 2021, 5.5% in September 2021, 5.4% in October 2021, 5.3% in November 2021, 5.7% in December 2021, 5.3% in January 2022, 5.3% in February 2022, 5.7% in March 2022, 5.7% in April 2022, 5.7% in May 2022, 5.6% in June 2022, 5.5% in July 2022, 5.2% in August 2022, 5.3% in September 2022, 5.0% in October 2022, 4.9% in November 2022, 4.8% in December 2022, 4.8% in January 2023, 4.7% in February 2023, 4.5% in March 2023, 4.5% in April 2023, 4.4% in May 2023, 4.2% in June 2023, 4.0% in July 2023, 3.9% in August 2023, 3.6% in September 2023, 3.8% in October 2023, 3.8% in November 2023, 3.6% in December 2023, 3.7% in January 2024, 3.7% in February 2024, 3.4% in March 2024, 3.3% in April 2024, 3.2% in May 2024, 3.1% in June 2024, 3.1% in July 2024, 3.0% in August 2024, 3.0% in September 2024, 3.0% in October 2024, 3.0% in November 2024, 3.0% in December 2024, 2.9% in January 2025 and 2.9% in February 2025.
Note: Total labour demand is equal to the sum of payroll employment and job vacancies. Job Vacancy and Wage Survey data collection was suspended from April 2020 to September 2020. Therefore, data for these reference periods are not available. Data are seasonally adjusted.
Source: Job Vacancy and Wage Survey (5217), table 14-10-0406-01.
Job vacancies up in finance and insurance and down in management of companies and enterprises
In February, finance and insurance (+7,500 to 22,100) and management of companies and enterprises (-600 to 1,800) were the only sectors to record a significant change in the number of job vacancies.
The job vacancy rate in February was highest in accommodation and food services (4.5%), other services (except public administration) (4.2%) and health care and social assistance (4.1%). In contrast, it was lowest in utilities (1.0%), educational services (1.2%) and management of companies and enterprises (1.4%).
Year over year, vacancies were down in 14 of the 20 sectors in February. The largest declines were recorded in health care and social assistance (-24,700; -19.0%), accommodation and food services (-18,600; -23.3%) and construction (-18,500; -31.6%). No sector recorded a year-over-year increase in job vacancies.
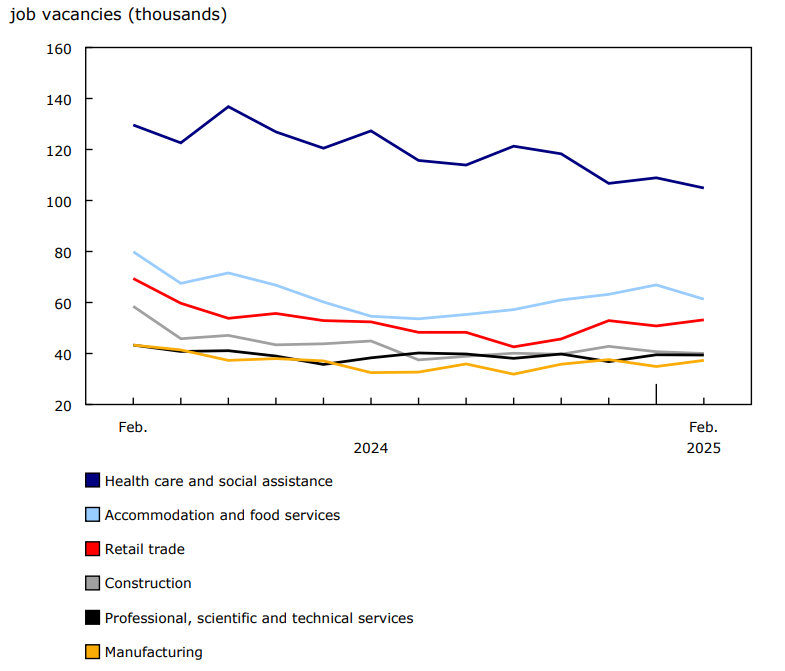
Three sectors account for approximately two in five job vacancies
In February, health care and social assistance, accommodation and food services, and retail trade together accounted for over 4 in 10 job vacancies (41.6%) in Canada. Health care and social assistance contributed the most to job vacancies (19.9%), followed by accommodation and food services (11.6%) and retail trade (10.1%). Of these sectors, health care and social assistance is the only one that continues to have significantly more vacancies than before the COVID-19 pandemic.
Chart 4: Top six sectors with the most job vacancies in February
Description - Chart 4
Data table: Top six sectors with the most job vacancies in February
Note: Data are seasonally adjusted.
Source: Job Vacancy and Wage Survey (5217), table 14-10-0406-01.
Job vacancies in transportation and warehousing continue downward trend
In February, job vacancies for the transportation and warehousing sector edged down by 1,200 (-4.8%) to 23,300, following a decrease of 5,600 (-18.7%) in January. This was the lowest level of job vacancies in this sector since October 2017 (22,900). Vacancies in the sector have been on a downward trend since reaching a peak in July 2022.
In February 2025, the job vacancy rate in transportation and warehousing was 2.7%, which was little changed from January but down 1.6 percentage points from February 2024. This was the largest year-over-year decrease in the job vacancy rate across all sectors.
Job vacancies down in Quebec and up in Ontario and Manitoba
The number of job vacancies in February decreased in Quebec (-11,400 to 116,400), while it increased in Ontario (+14,300 to 194,600) and Manitoba (+3,200 to 22,200). Job vacancies were little changed in six provinces.
In February, the job vacancy rate was highest in Manitoba (3.5%) and British Columbia (3.4%), while it was lowest in Newfoundland and Labrador (2.5%).
Year over year, the job vacancy rate was down in seven provinces in February, with the largest decreases being in Saskatchewan (-1.2 percentage points to 3.1%), Alberta (-1.0 percentage points to 2.8%), Quebec (-0.9 percentage points to 2.9%) and British Columbia (-0.9 percentage points to 3.4%).
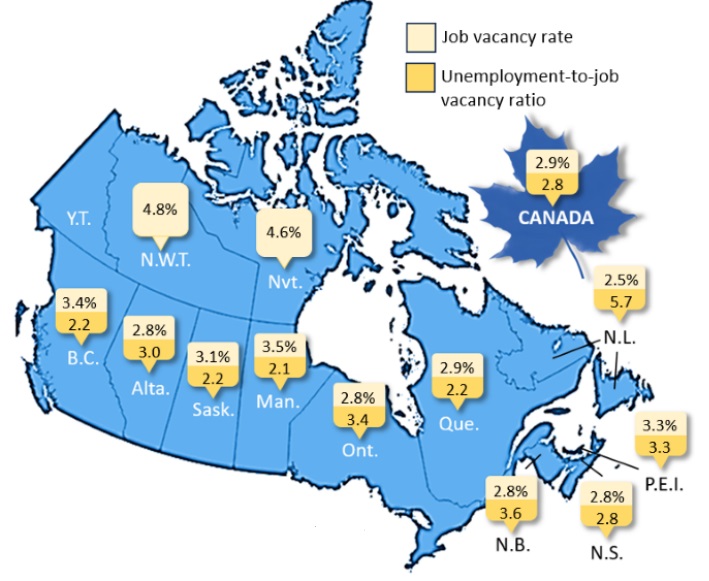
Map 1: Job vacancy rate and unemployment-to-job vacancy ratio in February 2025
Description - Map 1
The title of the map is "Job vacancy rate and unemployment-to-job vacancy ratio in February 2025"
This is a map of Canada by province and territory showing the job vacancy rates and unemployment-to-job vacancy ratios in February 2025.
The job vacancy rate in Canada was 2.9% and the unemployment-to-job vacancy ratio was 2.8 in February 2025.
The job vacancy rate in Newfoundland and Labrador was 2.5% and the unemployment-to-job vacancy ratio was 5.7 in February 2025.
The job vacancy rate in Prince Edward Island was 3.3% and the unemployment-to-job vacancy ratio was 3.3 in February 2025.
The job vacancy rate in Nova Scotia was 2.8% and the unemployment-to-job vacancy ratio was 2.8 in February 2025.
The job vacancy rate in New Brunswick was 2.8% and the unemployment-to-job vacancy ratio was 3.6 in February 2025.
The job vacancy rate in Quebec was 2.9% and the unemployment-to-job vacancy ratio was 2.2 in February 2025.
The job vacancy rate in Ontario was 2.8% and the unemployment-to-job vacancy ratio was 3.4 in February 2025.
The job vacancy rate in Manitoba was 3.5% and the unemployment-to-job vacancy ratio was 2.1 in February 2025.
The job vacancy rate in Saskatchewan was 3.1% and the unemployment-to-job vacancy ratio was 2.2 in February 2025.
The job vacancy rate in Alberta was 2.8% and the unemployment-to-job vacancy ratio was 3.0 in February 2025.
The job vacancy rate in British Columbia was 3.4% and the unemployment-to-job vacancy ratio was 2.2 in February 2025.
The job vacancy rate in Yukon was suppressed due to its low quality (F) in February 2025.
The job vacancy rate in Northwest Territories was 4.8% in February 2025.
The job vacancy rate in Nunavut was 4.6% in February 2025.
Note: Data are seasonally adjusted. The unemployment-to-job-vacancy ratio is not available for the territories and the ratio for Canada excludes the territories for consistency with the geographic coverage of the Labour Force Survey. Data for Yukon were suppressed due to their low quality (F).
Sources: Job Vacancy and Wage Survey (5217), table 14-10-0432-01; Labour Force Survey (3701), table 14-10-0287-01.
Sustainable Development Goals
On January 1, 2016, the world officially began implementation of the 2030 Agenda for Sustainable Development—the United Nations' transformative plan of action that addresses urgent global challenges over the next 15 years. The plan is based on 17 specific sustainable development goals. The Survey of Employment, Payrolls and Hours is an example of how Statistics Canada supports the reporting on the Global Goals for Sustainable Development. This release will be used in helping to measure the following goals:
Note to readers
Survey of Employment, Payrolls and Hours
The key objective of the Survey of Employment, Payrolls and Hours (SEPH) is to provide a monthly portrait of the level of earnings, employment and hours worked, by detailed industry, at the national, provincial and territorial levels.
Payroll employment, as measured by the SEPH, refers to the number of employees receiving pay and benefits (employment income) during a given month. The survey excludes the self-employed, owners and partners of unincorporated businesses and professional practices, and employees in the agricultural sector.
SEPH estimates are produced by integrating information from three sources: a census of approximately 1 million payroll deduction records provided by the Canada Revenue Agency; the Business Payrolls Survey, which collects data from a sample of 15,000 establishments; and administrative records of federal, provincial and territorial public administration employment, provided by these levels of government.
Estimates of average weekly earnings and hours worked are based on a sample and are therefore subject to sampling variability. This analysis focuses on differences between estimates that are statistically significant at the 68% confidence level. Payroll employment estimates are based on a census of administrative data and are not subject to sampling variability.
With each release of SEPH data, data for the preceding month are revised. Users are encouraged to use the most up-to-date data available for each month.
Statistics Canada also produces employment estimates from its Labour Force Survey (LFS). The LFS is a monthly household survey, the main objective of which is to divide the working-age population into three mutually exclusive groups: the employed (including the self-employed), the unemployed and those not in the labour force. This survey is the official source for the unemployment rate, and it collects data on the sociodemographic characteristics of all people in the labour market.
Employment trends from the SEPH and from the LFS generally track each other closely, especially over longer periods of time. That said, because of differences in concepts, definitions and methodologies, variations in employment levels in SEPH and in the LFS may differ, especially over shorter periods. For a more in-depth discussion of the conceptual differences between employment measures from the LFS and the SEPH, refer to Section 8 of the Guide to the Survey of Employment, Payrolls and Hours (Catalogue number72-203-G).
The SEPH and LFS both also provide monthly indicators of pay received by employees. Used together, average weekly earnings (from SEPH) and average hourly wages (from the LFS) can provide a comprehensive portrait of pay dynamics in Canada. For information on definitions for each indicator, key conceptual and measurement differences, and guidance to data users on when to use each indicator, refer to the report "Earnings and Wages – A guide to using indicators from the Survey of Employment, Payrolls and Hours and the Labour Force Survey."
Unless otherwise stated, this release presents seasonally adjusted data, which facilitate comparisons because the effects of seasonal variations are removed. For more information on seasonal adjustment, see Seasonally adjusted data – Frequently asked questions.
Non-farm payroll employment data are for all hourly and salaried employees and for the "other employees" category, which includes piece-rate and commission-only employees.
Unless otherwise specified, average weekly hours data are for hourly and salaried employees only and exclude businesses that could not be classified to a North American Industry Classification System (NAICS) 2022 version 1.0 code.
All earnings data include overtime and exclude businesses that could not be classified to a NAICS code. Earnings data are based on gross taxable payroll before source deductions. Average weekly earnings are derived by dividing total weekly earnings by the number of employees. Changes in average weekly earnings can reflect a range of factors, including changes in wages, composition of employment, hours worked and base-year effects.
Base-year effect refers to the impact that trends from 12 months earlier (base month) have on the current month's estimate of year-over-year change. In the case of SEPH, when the average weekly earnings in the base month is at the peak of a short-term trend, this tends to have a downward effect on year-over-year average weekly earnings growth in the current month. In contrast, if the value of the base month is at a low point of a trend, this tends to have an upward effect on the current month's year-over-year growth in average weekly earnings.
Job Vacancy and Wage Survey
Job Vacancy and Wage Survey (JVWS) collection is done on a quarterly basis. The quarterly sample of business locations is allocated to the three collection months of the quarter, approximately balanced by province and by industrial sector across each of the three months. This allows both quarterly and monthly estimates to be produced.
Preliminary monthly estimates are produced for job vacancies, job vacancy rates and payroll employment using available responses from business locations sampled in the corresponding reference month. The reference period for the JVWS is the first day of the respective month. This analysis focuses on differences between estimates that are statistically significant at the 68% confidence level.
These preliminary monthly estimates are revised and finalized when the corresponding quarterly estimates are released or shortly thereafter. Users are encouraged to use the most up-to-date data available for each month.
Unless otherwise stated, this release presents seasonally adjusted data, which facilitate comparisons because the effects of seasonal variations are removed. For more information on seasonal adjustment, see Seasonally adjusted data – Frequently asked questions.
While JVWS employment is calibrated to the SEPH, SEPH payroll employment and JVWS preliminary monthly employment figures may differ because of calibration grouping and differences in scope and reference period.
The unemployment-to-job vacancy ratio excludes the territories for consistency with the geographic coverage of the available LFS data (table 14-10-0287-01).
The JVWS also provides comprehensive quarterly data on job vacancies by industrial sector and detailed occupation for Canada and the provinces, territories and economic regions; offered hourly wages; and job vacancy characteristics. More information about the concepts and use of data from the JVWS is available in the Guide to the Job Vacancy and Wage Survey (75-514-G).
Real-time data tables
Tables 14-10-0357-01 and 14-10-0358-01 have now been archived.
Real-time data tables 14-10-0331-01 and 14-10-0332-01 will be updated on May 12.
Reference
Data tables: Access the latest tables.
- Note: some data tables may best be viewed on desktop.
Definitions, data sources and methods: survey numbers 2612 and 5217.
Previous release: Payroll employment, earnings and hours, and job vacancies, January 2025.
Next release: May 29, 2025.
Contact information
For more information, or to enquire about the concepts, methods or data quality of this release, contact us (toll-free 1-800-263-1136; 514-283-8300; infostats@statcan.gc.ca) or Media Relations (statcan.mediahotline-ligneinfomedias.statcan@statcan.gc.ca).